TradingSessionVisualizer

Avant de plonger dans les fonctionnalités de cet indicateur, n'oubliez pas de noter ce produit, laisser un commentaire pour partager votre expérience, et vous abonner à ma page pour rester informé des dernières mises à jour et nouveaux outils. Votre soutien est précieux et m'aide à améliorer constamment mes créations !

Description :

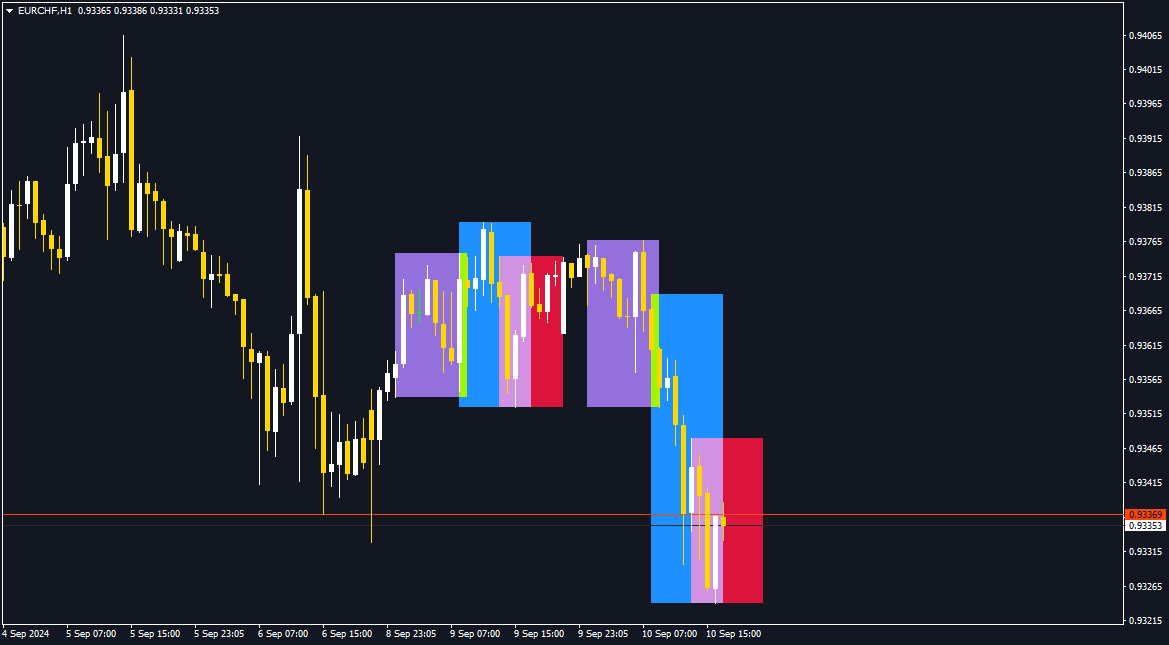
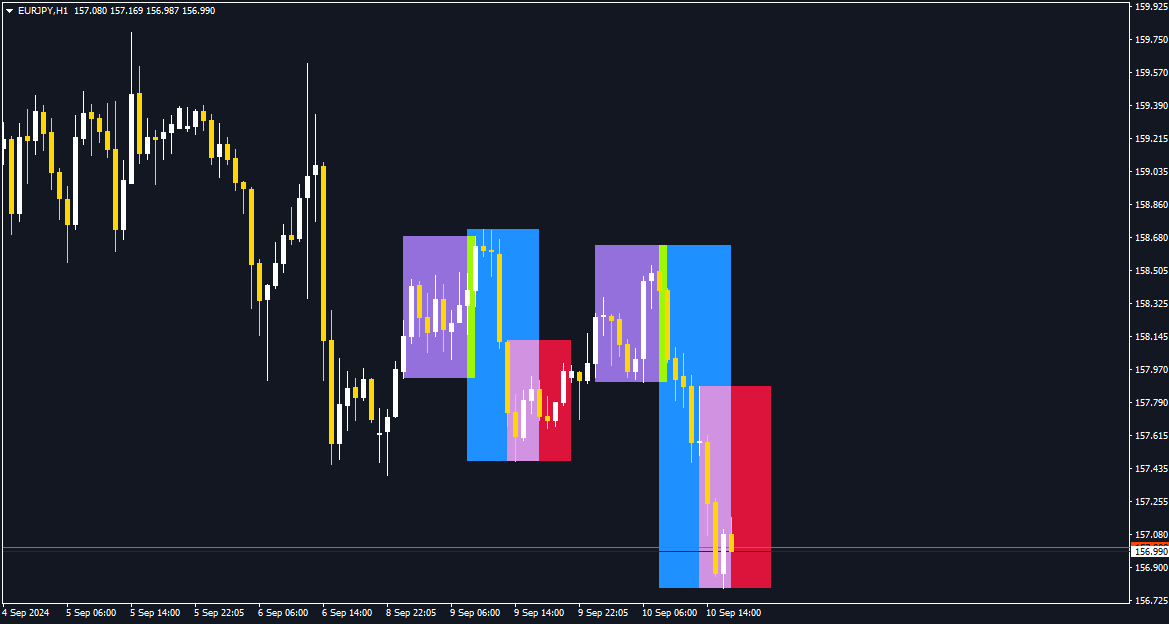
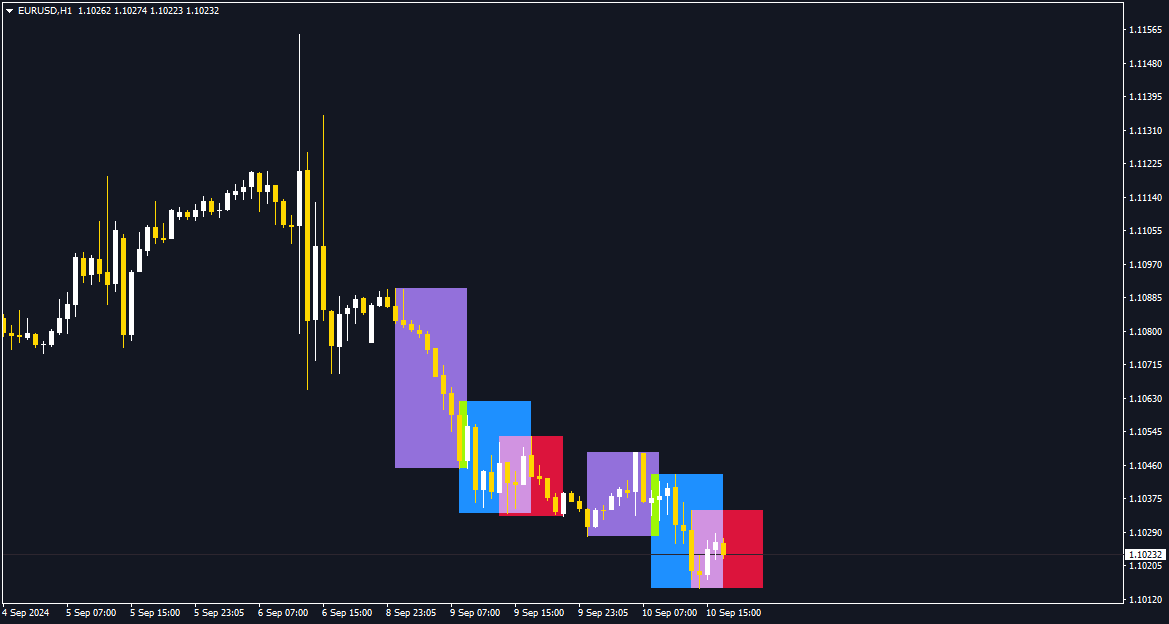
Le TradingSessionVisualizer est un indicateur puissant conçu pour MetaTrader 4, offrant une visualisation claire et personnalisable des principales sessions de trading sur vos graphiques. Cet outil vous permet de distinguer facilement les sessions de trading asiatiques, londoniennes et new-yorkaises, vous aidant ainsi à mieux comprendre les mouvements du marché pendant ces périodes clés.

Fonctionnalités principales :

  • Affichage des Sessions de Trading : Visualisez clairement les sessions de trading Asiatiques, Londoniens et New-Yorkaises avec des rectangles colorés sur votre graphique.
  • Paramètres Personnalisables : Ajustez la couleur, la largeur des lignes, et la possibilité de remplir ou non les rectangles pour chaque session.
  • Affichage Dynamique : L'indicateur s'adapte automatiquement en fonction du nombre de jours que vous choisissez de visualiser (jusqu'à 3 jours).
  • Gestion Facile : Le code assure la gestion efficace des objets graphiques, en supprimant les anciens objets et en mettant à jour les nouveaux.

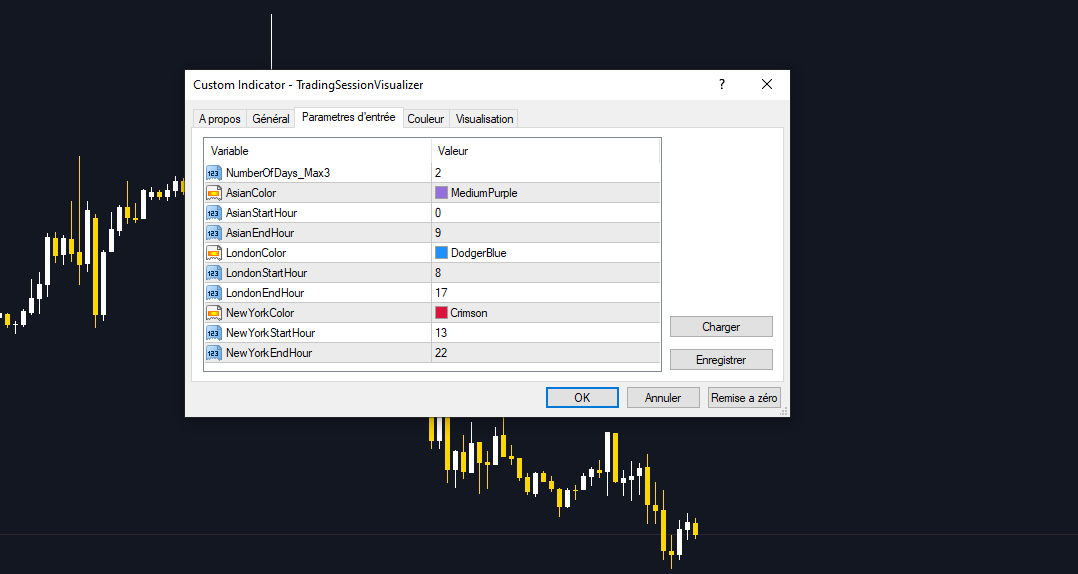
Paramètres de l'indicateur :

  • Nombre de Jours : Affichez les sessions pour un maximum de 3 jours.
  • Couleur et Style : Personnalisez les couleurs des sessions et le style des bordures des rectangles.
  • Remplissage des Rectangles : Choisissez si vous souhaitez que les rectangles soient remplis ou seulement les bordures visibles.

Comment utiliser :

  1. Installation : Téléchargez et installez l'indicateur dans le répertoire des indicateurs de MetaTrader 4.
  2. Configuration : Ajustez les paramètres selon vos préférences directement dans le panneau de configuration de l'indicateur.
  3. Analyse : Observez les sessions de trading sur votre graphique pour une meilleure prise de décision.

N'hésitez pas à explorer les fonctionnalités et à ajuster les paramètres pour tirer le meilleur parti de votre analyse de marché. Merci pour votre soutien et bonne trading !


Produits recommandés
TequilaEA
Kun Jiao
1 (1)
Documentation de la stratégie de trading TequilaEA 1. Informations de base Nom   : TequilaEA Version   : 1.0 Instrument applicable   : XAUUSD (Or/Dollar américain) Timeframe applicable   : M1 (graphique de 1 minute) Développeur   : Tulip Financial Technology 2. Logique de trading principale Cet Expert Advisor (EA) prend des décisions de trading basées sur une combinaison d'indicateurs techniques et de reconnaissance de motifs de prix, avec la logique principale suivante : Jugement de tendance Dé
FREE
CandlePips
Yawo Julio K Kavege Atileh
This indicator works on this way: Trader should provided the n period "Number of Candle" ( the default period is 6) Then the indicator  will calculate the number of pips in the last n period  (not the current candle) And that is display on the chart With that the should confirmed his up trend or down trend analyse according to the number of pips in the last  n candles( bullish or bearish) he has provided
FREE
MASi Wave Histogram
Aleksey Terentev
5 (1)
This is an implementation of the market cycle indicator described by Raghee Horner in the book "Forex Trading for Maximum Profit" . The current state of the market can be determined by analyzing the inclination angle of the exponential moving average (EMA) running on a period of 34 bars. If the EMA inclination is defined as the direction of the hour hand on the dial from 12 to 2 hours, then an uptrend is considered to be present; from 2 to 4 hours, the market consolidates; from 4 to 6 hours, a d
FREE
It is a custom non-repaint indicator to identify trade opportunities in swing action as prices move within an upper and lower band. Inspired by the Keltner Channel, the most popular channel Indicator introduced by Chester Keltner. It is different with a Bollinger Bands. It represents volatility using the high and low prices, while Bollinger's studies rely on the standard deviation. The algorithm for this indicator is also available in the EntryMaximator EA. Including the option to use it or not.
FREE
Growing Bands Sh
Nikolay Likhovid
3 (2)
Do you use dynamic ranges (like Bollinger Bands or Envelopes) in your trading? A fixed period is usually used for such calculations. But is such approach relevant to the very nature of the market? In fact, the price chart consists of a series of successive processes - trends and flats. In this case, we can talk about the internal development logic inside a single process only. Therefore, the nature of the market is better described by dynamic ranges designed for the processes occurring "here and
FREE
Ratio market
Aleksandr Krokhalev
4.33 (15)
Volatility under control. The indicator shows the optimal depth for setting goals within the day and on the average trend. It also builds pivot zones for the estimated correction depth. As an accompaniment, the key levels of the structure are displayed for several timeframes. Classical volatility indicators ATR & ADX on fixed timeframes are used for calculation. The calculation takes into account the spread, and if the market is slightly volatile, you will see a warning about the risk. You can c
FREE
MASi Three Screens
Aleksey Terentev
5 (2)
MASi Three Screens is based on the trading strategy by Dr. Alexander Elder. This indicator is a collection of algorithms. Algorithms are based on the analysis of charts of several timeframes. You can apply any of the provided algorithms. List of versions of algorithms:     ThreeScreens v1.0 - A simple implementation, with analysis of the MACD line;     ThreeScreens v1.1 - A simple implementation, with analysis of the MACD histogram;     ThreeScreens v1.2 - Combines the first two algorithms in
FREE
XOATRHIST
Ainur Sharipov
4.83 (6)
This is one of my first indicators. Slightly improved. The indicator is based on point and figure chart, but their period is equal to ATR indicator values. Parameters: ATRPeriod - ATR period for calculation of steps. XOPips - manual pararmetr, ATR ignoring. Note: The indicator uses closes price, thus it is recommended to consider completed bars. There is a more visual, with the display of lines on the chart and alerts, paid version of XOatrline
FREE
TrendNavigator Robot
Hong Ling Mu
4 (1)
This robot is equipped with trend-following logic. Specifically, it detects trends using the Parabolic Indicator and identifies when prices move significantly compared to normal fluctuations. You can input a desired number of pips (Price GAP pips) to determine at what price fluctuation the entry should occur. In case the trend reverses, all open orders will be closed. The number of simultaneous orders you can hold is customizable. Additionally, if you have multiple orders, they will all close o
FREE
AngDistPer
Vasiliy Anokhin
The oscillator indicator " AngDistPer " is one of a series of three calculators of the angular deviation of the price chart of a trading instrument. INPUT PARAMETER: DRAWs =128 - Number of bars to display the indicator in the chart history; DistPER =14 - calculation period of the indicator in the number of bars. The values of the indicator indicators are degrees . The presence of a Strong price Movement begins with a value of +-45 degrees, and can not exceed +-90 degrees. A Good Trading Rese
FREE
JAngleR
Vasiliy Anokhin
The oscillator indicator " JAngleR " is one of a series of three calculators of the angular deviation of the price chart of a trading instrument. INPUT PARAMETER: DRAWs =128 - Number of bars to display the indicator in the chart history; Period_IND =14 - calculation period of the indicator in the number of bars; ma_period =1 - Moving Average Period; ma_method =MODE_SMA - moving Method; applied_price =PRICE_CLOSE - applied Moving Average Price. The values of the indicator indicators are degrees
FREE
The oscillator indicator " AnglerSPeriod " is one of a series of three calculators of the angular deviation of the price chart of a trading instrument. INPUT PARAMETER: DRAWs =128 - Number of bars to display the indicator in the chart history; PeriodIND =14 - calculation period of the indicator in the number of bars. The values of the indicator indicators are degrees . The presence of a Strong price Movement begins with a value of +-45 degrees, and can not exceed +-90 degrees. A Good Trading
FREE
For more info,  questions   and problems join to discord.gg/reitakfx Very informative and detailed tool for your account.  - pairs, number of trades, lot size, profit, lose, nett p/l, net pips - profit growth chart Instalation : - open chart and delete every other indicator on it - put this report on chart Setting : - magic number - filters (comment, symbols, currencies) - date (today, week, month custom) - Start / End date (this is for custom date) - report type (open - only active trades wi
FREE
MACD Scanner With Alerts
Niravkumar Maganbhai Patel
4 (2)
MACD Dashboard Panel   This indicator helps you to scan symbols which are in the Market Watch window and filter out a trend according to MACD. Moving Average Convergence Divergence (MACD) is a trend-following momentum indicator that shows the relationship between two moving averages of a security’s price. The MACD is calculated by subtracting the 26-period Exponential Moving Average (EMA) from the 12-period EMA. The result of that calculation is the MACD line. A nine-day EMA of the MACD called
FREE
Period Breakout Indicator
Komang Putra Riswanjaya
5 (1)
Overview The Period Breakout Indicator is a versatile tool designed for traders seeking to identify breakout opportunities based on customizable time periods. This indicator automatically determines the highest and lowest prices within a user-defined period, allowing you to tailor it precisely to your trading strategy. Key Features Customizable Time Periods: Define the start and end times based on your preferred trading hours or any specific period. The indicator will then calculate the highest
FREE
Super trend is one of the best trend indicators in metatrader 4 (MT4). Triple SuperTrend indicator is an indicator that consist of three super trend indicator that can be aranged. This indicator is built by mql4 language and doesn't provided by MT4 platform. Highly recommended using EMA SuperTrend Strategy Indicator if you want to get better result in here: https://www.mql5.com/en/market/product/91664 This indicator is easy to use, power full and has many benefits, there are: Using three indic
FREE
SRFactor
Aleksandr Teleguz
5 (2)
This indicator identifies short-term, medium-term and long-term highs and lows of the market according to the method described by Larry Williams in the book "Long-term secrets to short-term trading". Brief description of the principle of identifying the market highs and lows A short-term high is a high of a bar with lower highs on either side of it, and, conversely, a short-term low of a bar is a low with higher lows on either side of it. Medium-term highs and lows are determined similarly: a
FREE
In addition to the MA of the set period, the MAs of the two higher timeframes with the same period are displayed on the chart simultaneously (though in a simulated way). No matter which timeframe you switch to, it will display the MA for that timeframe as well as the MAs for the two higher timeframes. Additionally, it will show the 200 MA as well! To display the MA for the higher timeframes on the current chart, you need to set the MA calculated using the Moving Average indicator. If you try to
FREE
Point Of Week
Kristhara Tharaviriyadech
The **Point of Week Indicator** is a powerful MetaTrader 4 indicator that displays point values for multiple timeframes (W1, D1, H4, H1) directly on your chart. It calculates the position of the close price within the candle's range and displays it as a point value, along with the total range of the candle. ## Features - Displays point values for 4 timeframes: **Weekly (W1), Daily (D1), 4-Hour (H4), and Hourly (H1)** - Shows point value and total range in format: `"point_value/range_value
FREE
Renko Chart with Moving Average. Classic Renko charts idea. It is protted on main chart and Moving Average can be applied. Prices for bars are used from a lower timeframe. Parameters: BarsBack - how many bars of lower timeframe to use. If value is zero than it will use all available bars. LTF - lower timeframe. BrickSize - Renko bar in points. BullishColor - color for bull candle. BearishColor - color for bear candle. HideLineChart - if this value is true the line chart when be hidden when sele
FREE
Draw Lines
Antonio Franco
Tracez facilement les niveaux d’entrée, de take profit et de stop loss sur votre graphique pour analyser et suivre les signaux de trading. Fonctionnalités principales Saisie facile des valeurs d’entrée, TP1, TP2, TP3 et SL Ligne verticale optionnelle pour marquer l’heure exacte du signal Étiquettes et couleurs personnalisables pour chaque ligne Évaluez visuellement la précision et le ratio risque/rendement des signaux Compatible avec tous les actifs et toutes les unités de temps Aucun recal
FREE
This indicator uses a different approach from the previous version to get it's trendlines. This method is derived from Orchard Forex, and the process of making the indicator is demonstrated in there video   https://www.youtube.com/watch?v=mEaiurw56wY&t=1425s . The basic idea behind this indicator is it draws a   tangent line   on the highest levels and lowest levels of the bars used for calculation, while ensuring that the lines don't intersect with the bars in review (alittle confusing? I know
FREE
Heikin Ashi Smoothed – Indicateur pour MT4 Heikin Ashi Smoothed est un indicateur personnalisé pour MetaTrader 4 (MT4) qui améliore la lecture du graphique classique Heikin Ashi en appliquant un processus de lissage supplémentaire via des moyennes mobiles. Cette méthode permet une représentation visuelle beaucoup plus claire et fluide des tendances, réduit considérablement le « bruit » du marché et facilite l’identification de la direction principale du marché ainsi que des points de retournemen
FREE
MASi Wave
Aleksey Terentev
4.63 (8)
This is an implementation of the market cycle indicator described by Raghee Horner in the book "Forex Trading for Maximum Profit" . The current state of the market can be determined by analyzing the inclination angle of the exponential moving average (EMA) running on a period of 34 bars. If the EMA inclination is defined as the direction of the hour hand on the dial from 12 to 2 hours, then an uptrend is considered to be present; from 2 to 4 hours, the market consolidates; from 4 to 6 hours, a d
FREE
Momentum ADX 4
Aiman Saeed Salem Dahbag
Momentum ADX Indicator A powerful and simple trend momentum indicator based on the Average Directional Index (ADX). It visualizes market strength using a clean color-coded histogram: Green bars show bullish momentum when +DI dominates Red bars show bearish momentum when -DI dominates This indicator helps traders quickly identify trend direction and strength without complexity, making it suitable for scalping, intraday, and swing trading strategies. Clean visual signals Easy to inter
FREE
Very usefull expert advisor for ichimoku kinko hyo indicator. this expert advisor will notify you whenever there is a cross over/below the clouds or tenken sen  /kijun crossing. All Ichimoku traders know the importance and valuable signals when crosses done below or above the clouds or tenkan and kijun crosses. Now you will be alerted quickly to make benefits from the markets This will help you to be alerted for possible trade action. it will simplify your chart observation and be notified wtith
FREE
SMC Institutional Visualizer with Weekly Range Box - Detect Liquidity Sweeps, BOS, Order Blocks, FVGs & Weekly Key Levels Complete Smart Money Concepts (SMC) indicator for institutional trading visualization. Detects Liquidity Sweeps, Break of Structure (BOS), Order Blocks, and Fair Value Gaps (FVG). Now includes Weekly Range Box showing last closed weekly candle's high, low, and midline. Fully customizable colors and styles. Perfect for price action and supply/demand traders. Long Description
FREE
Mini Charts
Sergey Efimenko
4.78 (9)
L'indicateur affiche des graphiques minimisés de n'importe quel symbole de n'importe quelle période. Le nombre maximum de graphiques affichés est de 28. Les graphiques peuvent être situés à la fois dans la fenêtre principale et dans la fenêtre inférieure. Deux modes d'affichage : bougies et barres. La quantité de données affichées (barres et bougies) et la taille des graphiques sont réglables. Paramètres: Corner - afficher le coin de départ (sélectionné dans la liste) CandleMode - mode d'afficha
FREE
Parabolic SAR extreme
Teng Qi Sheng Joshua
5 (1)
Parabolic SAR extreme When the Parabolic SAR value indicates an uptrend or downtrend, the EA will open a buy or sell trade respectively, given that all other criteria are met This EA allows you to set up to 21 separate Parabolic SAR  criteria for the EA to work on  There are 3 input parameter sets (SAR1, SAR2, and SAR3) Each set allows you to determine the parameters (such as the step and max step) for each set And within each set, you get to indicate up to 7 timeframe for the EA to operate in
FREE
Trend Z MT4
Claudia Ramona Angerer
Hypothetical trend line display Distance from the trend line Can be used in all symbols Can be used in all time frames An interesting indicator for predicting small waves The greater the distance from the trend line, the more likely it is to return to the trend line Settings: The first three(osic 1,2,3): are the same as the settings of the zigzag indicator The bigger these numbers are, the bigger the trend lines and the longer the trend Back Show: The number of candles displayed Clr1,2: The
FREE
Les acheteurs de ce produit ont également acheté
Neuro Poseidon MT4
Daria Rezueva
4.94 (32)
Neuro Poseidon is a new indicator by Daria Rezueva. It combines precise trading signals with adaptive TP/SL levels - creating best possible trades as a result! Message me and get  Neuro Poseidon Assistant  as a gift to automize your trading process! What makes it stand out? 1. Proven profitability on all assets and timeframes 2. Only confirmed BUY and SELL signals present on the chart 3. Adaptive TP & SL levels generated by the software for each trade 4. Easy to understand - suitable for all
Gann Made Easy
Oleg Rodin
4.84 (165)
Gann Made Easy est un système de trading Forex professionnel et facile à utiliser qui est basé sur les meilleurs principes de trading en utilisant la théorie de mr. WD Gann. L'indicateur fournit des signaux d'ACHAT et de VENTE précis, y compris les niveaux Stop Loss et Take Profit. Vous pouvez échanger même en déplacement en utilisant les notifications PUSH. VEUILLEZ ME CONTACTER APRÈS L'ACHAT POUR RECEVOIR GRATUITEMENT DES INSTRUCTIONS DE TRADING ET D'EXCELLENTS INDICATEURS SUPPLÉMENTAIRES! Vou
M1 Sniper
Oleg Rodin
5 (24)
M1 SNIPER est un système d'indicateurs de trading facile à utiliser. Il s'agit d'un indicateur à flèche conçu pour l'unité de temps M1. Cet indicateur peut être utilisé seul pour le scalping sur l'unité de temps M1 ou intégré à votre système de trading existant. Bien que conçu spécifiquement pour le trading sur l'unité de temps M1, ce système peut également être utilisé avec d'autres unités de temps. Initialement, j'avais conçu cette méthode pour le trading du XAUUSD et du BTCUSD. Cependant, je
Dynamic Forex28 Navigator
Bernhard Schweigert
4.43 (7)
Dynamic Forex28 Navigator - L'outil de trading Forex de nouvelle génération. ACTUELLEMENT 49 % DE RÉDUCTION. Dynamic Forex28 Navigator est l'évolution de nos indicateurs populaires de longue date, combinant la puissance de trois en un : Advanced Currency Strength28 Indicator (695 avis) + Advanced Currency IMPULSE avec ALERT (520 avis) + CS28 Combo Signals (Bonus). Détails sur l'indicateur https://www.mql5.com/en/blogs/post/758844 Qu'offre l'indicateur de force de nouvelle génération ? Tout
Enigmera
Ivan Stefanov
5 (8)
ENIGMERA : Le cœur du marché Important : La démo de MQL5.com fonctionne dans le Strategy Tester et peut ne pas refléter pleinement les fonctionnalités d'Enigmera. Consultez la description, les captures d'écran et la vidéo pour plus de détails. N'hésitez pas à m'envoyer un message si vous avez des questions ! Le code de l'indicateur a été entièrement réécrit. La version 3.0 ajoute de nouvelles fonctionnalités et corrige les bugs accumulés depuis le lancement de l'indicateur. Introduction Cet in
Trend Catcher ind
Ramil Minniakhmetov
5 (2)
INDICATEUR DE DÉTECTEUR DE TENDANCE L'indicateur de détecteur de tendance analyse les mouvements de prix du marché grâce à une combinaison d'indicateurs d'analyse de tendance adaptatifs, propriétaires et personnalisés. Il identifie la véritable direction du marché en filtrant les fluctuations à court terme et en se concentrant sur la force de la dynamique sous-jacente, l'expansion de la volatilité et la structure des prix. Il utilise également une combinaison d'indicateurs personnalisés de lis
Cet indicateur est un indicateur d'analyse automatique des vagues, parfait pour le trading pratique ! Cas... Remarque :   je n'ai pas l'habitude d'utiliser des noms occidentaux pour l'évaluation des vagues. En raison de l'influence de la convention de dénomination de Tang Lun (Tang Zhong Shuo Zen), j'ai nommé la vague de base comme   un stylo   et la bande d'onde secondaire comme   un segment   . en même temps, le segment a la direction de la tendance.Le   segment de tendance principal   est no
KT Alpha Hunter Arrows MT4
KEENBASE SOFTWARE SOLUTIONS
La plupart des indicateurs à flèches vous donnent un signal, puis vous laissent gérer tout le reste seul. KT Alpha Hunter Arrows vous fournit un plan de trading complet. Chaque flèche de signal s’affiche avec un plan déjà tracé : ligne d’entrée, stop loss, quatre niveaux de take profit et un verdict d’edge en temps réel indiquant si ce symbole et cette unité de temps méritent d’être tradés maintenant. Le package inclut un Trade Manager EA qui prend en charge l’exécution après votre entrée, afin
Scalper Inside PRO
Alexey Minkov
4.74 (68)
Scalper Inside PRO Scalper Inside PRO is an intraday trend and scalping indicator for MetaTrader 4 that uses an exclusive algorithm to quickly detect market direction and key target levels. It automatically calculates entry, exit and multiple profit targets, and shows detailed performance statistics so you can see how different instruments and strategies performed. This helps you choose the most suitable trading instruments for the current market conditions. Additionally, you can easily integrat
Neo Wave PRO
Nikolay Raykov
5 (1)
Price & Time Market Structure Indicator A professional market structure tool that analyzes waves through both price and time — not price alone. Main Description NeoWave PRO is a professional market structure indicator for MetaTrader 4 designed for traders who want to move beyond traditional one-dimensional wave tools such as ZigZag, swing indicators, and basic high/low systems. Most wave indicators analyze only one thing: Price. But a real market wave is not only a price movement. A true wave de
Le système PRO Renko est un système de trading très précis spécialement conçu pour le trading de graphiques RENKO. Il s'agit d'un système universel qui peut être appliqué à divers instruments de négociation. Le système neutralise efficacement ce qu'on appelle le bruit du marché en vous donnant accès à des signaux d'inversion précis. L'indicateur est très facile à utiliser et n'a qu'un seul paramètre responsable de la génération du signal. Vous pouvez facilement adapter l'outil à n'importe que
Genesis Matrix Pro is a professional multi-timeframe trend detection indicator designed to help traders identify high-quality market alignment with clarity and structure. It combines 12 different technical indicators into one visual alignment matrix, allowing traders to quickly see when market conditions are bullish, bearish, or neutral. A signal is generated only when the selected strategies are aligned, helping reduce noise and improve decision-making. PLEASE CONTACT ME AFTER PURCHASE TO GET
Current event:  https://c.mql5.com/1/326/A2SR2025_NoMusic.gif A. Qu'est-ce que l'A2SR ?   * C'est un indicateur technique avancé (pas de peinture, pas de retard). -- Conseils : -- sur https://www.mql5.com/en/blogs/post/734748/page4#comment_16532516 -- et https://www.mql5.com/en/users/yohana/blog A2SR a une technique spéciale pour déterminer les niveaux de Support (demande) et de Résistance (offre). Contrairement à la manière ordinaire que nous avons vue sur le net, A2SR a un concept original
PZ Trend Trading
PZ TRADING SLU
4.8 (5)
Capture every opportunity: your go-to indicator for profitable trend trading Trend Trading is an indicator designed to profit as much as possible from trends taking place in the market, by timing pullbacks and breakouts. It finds trading opportunities by analyzing what the price is doing during established trends. [ Installation Guide | Update Guide | Troubleshooting | FAQ | All Products ] Trade financial markets with confidence and efficiency Profit from established trends without getting whips
Advanced Supply Demand
Bernhard Schweigert
4.91 (300)
Offre spéciale : 40 % de réduction La solution idéale pour les traders débutants comme experts ! Cet indicateur est un outil de trading unique, performant et abordable grâce à l’intégration de nombreuses fonctionnalités exclusives et d’une nouvelle formule. Cette mise à jour vous permet d’afficher des zones sur deux unités de temps. Vous pourrez ainsi visualiser non seulement une unité de temps supérieure, mais aussi l’unité de temps du graphique, ainsi que l’unité de temps supérieure : des z
IQ FX Gann Levels a precision trading indicator based on W.D. Gann’s square root methods . It plots real-time, non-repainting support and resistance levels to help traders confidently spot intraday and scalping opportunities with high accuracy. William Delbert Gann (W.D. Gann) was an exceptional market analyst, whose trading technique was based on a complex blend of mathematics, geometry, astrology, and ancient mathematics which proved to be extremely accurate. Setup & Guide:  Download  MT5 Ver
Scalper Vault
Oleg Rodin
5 (37)
Scalper Vault est un système de scalpage professionnel qui vous fournit tout ce dont vous avez besoin pour un scalpage réussi. Cet indicateur est un système de trading complet qui peut être utilisé par les traders de forex et d'options binaires. Le délai recommandé est M5. Le système vous fournit des signaux fléchés précis dans le sens de la tendance. Il vous fournit également des signaux supérieurs et inférieurs et des niveaux de marché Gann. Les indicateurs fournissent tous les types d'alertes
PZ Swing Trading
PZ TRADING SLU
5 (3)
Protect against whipsaws: revolutionize your swing trading approach Swing Trading is the first indicator designed to detect swings in the direction of the trend and possible reversal swings. It uses the baseline swing trading approach, widely described in trading literature. The indicator studies several price and time vectors to track the aggregate trend direction and detects situations in which the market is oversold or overbought and ready to correct. [ Installation Guide | Update Guide | Tro
L'indicateur « Dynamic Scalper System » est conçu pour la méthode de scalping, permettant de trader au sein des vagues de tendance. Testé sur les principales paires de devises et l'or, il est compatible avec d'autres instruments de trading. Fournit des signaux pour l'ouverture de positions à court terme le long de la tendance, avec un support supplémentaire pour les fluctuations de prix. Principe de l'indicateur : De grandes flèches déterminent la direction de la tendance. Un algorithme de gén
Version Swing M30/H1/H4 disponible Attraper les grands mouvements ? Gold Signal Swing Pro (M30/H1/H4). Objectif : $20-$80+ par trade. https://www.mql5.com/en/market/product/177643 KURAMA GOLD SIGNAL PRO (MT4) — Système de Trading XAUUSD Complet avec Filtre à 7 Couches, TP/SL Automatique et Notation de Qualité PAS DE REPAINT. PAS DE REDESSIN. PAS DE RETARD. Chaque signal est permanent. Ce que vous voyez est ce que vous obtenez. BONUS : Achetez la lice
PZ 123 Pattern
PZ TRADING SLU
1 (1)
Unlock powerful breakout opportunities The 123 Pattern is one of the most popular, powerful and flexible chart patterns. The pattern is made up of three price points: a bottom, a peak or valley, and a Fibonacci retracement between 38.2% and 71.8%. A pattern is considered valid when the price breaks beyond the last peak or valley, moment at which the indicator plots an arrow, rises an alert, and the trade can be placed. [ Installation Guide | Update Guide | Troubleshooting | FAQ | All Products  ]
MonsterDash Harmonic Indicator is a harmonic pattern dashboard. It recognizes all major patterns. MonsterDash is a dashboard that displays all detected patterns for all symbols and (almost) all timeframes in sortable and scrollable format. Users can add their own user defined patterns . MonsterDash can open and update charts with the pattern found. Settings MonsterDash's default settings are good enough most of the time. Feel free to fine tune them to your needs. The color settings are for thos
Apollo SR Master est un indicateur de support/résistance doté de fonctionnalités spéciales qui simplifient et fiabilisent le trading basé sur les zones de support/résistance. Cet indicateur calcule ces zones en temps réel, sans aucun décalage, en détectant les sommets et les creux locaux des prix. Pour confirmer la nouvelle zone de support/résistance, il affiche un signal spécifique indiquant que cette zone peut être prise en compte et utilisée comme un véritable signal d'achat ou de vente. Dans
Le détecteur de séisme de marché  sismographique. Description in English : https://www.mql5.com/en/market/product/113869?source=Site+Market+Product+Page#description How to use the Seismograph : https://www.mql5.com/en/market/product/113869#!tab=comments&page=2&comment=52806941 Create an EA : https://www.mql5.com/en/market/product/113869#!tab=comments&page=3&comment=52816509 Quelle que soit la façon dont vous tradez, vous voulez absolument éviter d'entrer sur le marché à faible liquidité.-
ACTUELLEMENT 40% DE RÉDUCTION La meilleure solution pour tout débutant ou trader expert ! Cet indicateur est un outil de trading unique, de haute qualité et abordable car nous avons incorporé un certain nombre de caractéristiques exclusives et une nouvelle formule. Avec seulement UN graphique, vous pouvez lire la force de la devise pour 28 paires Forex ! Imaginez comment votre trading va s'améliorer parce que vous êtes capable de repérer le point de déclenchement exact d'une nouvelle tendance
Introduction to Fractal Pattern Scanner Fractal Indicator refers to the technical indicator that makes use of the fractal geometry found in the financial market. Fractal Pattern Scanner is the advanced Fractal Indicator that brings the latest trading technology after the extensive research and development work in the fractal geometry in the financial market. The most important feature in Fractal Pattern Scanner is the ability to measure the turning point probability as well as the trend probabi
Auto Optimized Parabolic RSI : Moteur de Momentum 3D Avancé La plupart des indicateurs pour les particuliers échouent car ils s'appuient sur des paramètres statiques qui se brisent dès que la volatilité du marché change. L'Auto Optimized Parabolic RSI résout le problème de l'« obsolescence des indicateurs » en recalculant continuellement son propre avantage mathématique, apportant une adaptation quantitative de niveau institutionnel directement sur votre terminal MT5. L'Avantage Principal : Opti
Trend Lines PRO
Roman Podpora
5 (1)
TREND LINES PRO     Cet indicateur permet de comprendre les véritables changements de direction du marché. Il révèle les renversements de tendance et les points de retour des principaux acteurs. Tu vois     Lignes BOS     Détection des changements de tendance et des niveaux clés sur des unités de temps supérieures, sans paramètres complexes ni interférences inutiles. Les signaux restent affichés sur le graphique même après la fermeture de la bougie. VERSION MT 5    -     Révèle son potentiel max
The Propfolio Master Suite is the ultimate all-in-one analytical workstation for professional traders. Combining the power of the Beat The Market Maker (BTMM) methodology, Smart Money Concepts (SND/Liquidity), and Advanced Volume Profile, this suite replaces multiple different indicators with one optimized engine. Monitor up to 14 pairs simultaneously from a single chart, instantly identify market cycles, and seamlessly map institutional footprints with the click of a button. The Command Center
RFI levels PRO
Roman Podpora
5 (1)
L'indicateur montre avec précision les points de retournement et les zones de retour des prix où le       Acteurs majeurs   . Vous repérez les nouvelles tendances et prenez des décisions avec une précision maximale, en gardant le contrôle de chaque transaction. VERSION MT5     -     Révèle son potentiel maximal lorsqu'il est combiné à l'indicateur   TREND LINES PRO Ce que l'indicateur montre : Structures et niveaux d'inversion avec activation au début d'une nouvelle tendance. Affichage des nive
Plus de l'auteur
OrderBlock Analyzer MT5
Komi Eyram F Kahoho
5 (2)
L'OrderBlock Analyzer est un indicateur personnalisé pour MetaTrader 5 (MT5) conçu pour détecter et mettre en évidence automatiquement les Order Blocks sur les graphiques de prix. Cet outil est idéal pour les traders qui utilisent les Order Blocks dans leur stratégie de trading, offrant une visualisation claire et précise de ces zones cruciales. Fonctionnalités principales : Détection des Order Blocks :   Identifie automatiquement les Order Blocks haussiers et baissiers basés sur les configurati
Liquidity Zone Detector MT5
Komi Eyram F Kahoho
5 (1)
Le Liquidity Zone Detector est un indicateur technique avancé conçu pour identifier et tracer les zones de liquidité clés sur le marché en se basant sur l'indicateur ZigZag. Cet outil met en évidence les niveaux de prix où des liquidités importantes sont susceptibles d'être présentes, en dessinant des lignes de tendance sur les points hauts et bas capturés par le ZigZag. Le Liquidity Zone Detector aide les traders à repérer les zones potentielles de retournement ou de continuation des tendances
DailyHighLow MT5
Komi Eyram F Kahoho
N'oubliez pas de noter l'indicateur afin de m'aider en visibilité. L'indicateur DailyHighLow pour MetaTrader 5 (MT5) est un outil sophistiqué pour suivre les mouvements de prix quotidiens. Conçu pour les traders ayant besoin d'informations claires et exploitables sur les plus hauts et les plus bas du marché, cet indicateur trace automatiquement des lignes de tendance basées sur les prix les plus élevés et les plus bas sur une période personnalisable. Principales Caractéristiques : Personnalisat
FREE
DailyHighLow
Komi Eyram F Kahoho
5 (1)
N'oubliez pas de noter l'indicateur afin de m'aider en visibilité. L'indicateur DailyHighLow pour MetaTrader 4 (MT4) est un outil sophistiqué pour suivre les mouvements de prix quotidiens. Conçu pour les traders ayant besoin d'informations claires et exploitables sur les plus hauts et les plus bas du marché, cet indicateur trace automatiquement des lignes de tendance basées sur les prix les plus élevés et les plus bas sur une période personnalisable. Principales Caractéristiques : Personnalisa
FREE
FVG Analyzer
Komi Eyram F Kahoho
4 (1)
FVG Analyzer – L’outil ultime pour détecter les Fair Value Gaps (FVG) avec précision FVG Analyzer est un indicateur puissant et entièrement personnalisable conçu pour les traders sérieux qui exploitent les Fair Value Gaps (FVG) dans leurs stratégies. Grâce à une détection intelligente et une visualisation claire, cet outil vous permet d'identifier rapidement les zones d’inefficience du marché, là où le prix pourrait potentiellement revenir avant de repartir dans sa tendance. Fonctionnalités clés
L'OrderBlock Analyzer est un indicateur personnalisé pour MetaTrader 4 (MT4) conçu pour détecter et mettre en évidence automatiquement les Order Blocks sur les graphiques de prix. Cet outil est idéal pour les traders qui utilisent les Order Blocks dans leur stratégie de trading, offrant une visualisation claire et précise de ces zones cruciales. Fonctionnalités principales : Détection des Order Blocks : Identifie automatiquement les Order Blocks haussiers et baissiers basés sur les configuration
Le Liquidity Zone Detector est un indicateur technique avancé conçu pour identifier et tracer les zones de liquidité clés sur le marché en se basant sur l'indicateur ZigZag. Cet outil met en évidence les niveaux de prix où des liquidités importantes sont susceptibles d'être présentes, en dessinant des lignes de tendance sur les points hauts et bas capturés par le ZigZag. Le Liquidity Zone Detector aide les traders à repérer les zones potentielles de retournement ou de continuation des tendances
Le RR_TradeManager Visualizer est un indicateur de gestion de trade conçu pour les traders souhaitant visualiser facilement leurs niveaux de prise de profit (TP) et de stop loss (SL) sur un graphique. Cette version initiale est une représentation graphique simple qui affiche les zones de SL et TP ainsi que le prix d'entrée. Veuillez noter que cette version actuelle se concentre uniquement sur l'affichage graphique des zones de SL et TP sous forme de figures sur le graphique. Caractéristiques de
Avant de plonger dans les fonctionnalités de cet indicateur, n'oubliez pas de noter ce produit, de laisser un commentaire pour partager votre expérience, et de vous abonner à ma page pour rester informé des dernières mises à jour et nouveaux outils. Votre soutien est précieux et m'aide à améliorer constamment mes créations ! Description : TradingSessionPipsVisualizer - L'outil professionnel pour maîtriser les sessions de trading Visualisez instantanément les sessions Forex et optimisez votre tim
FVG Analyzer MT5
Komi Eyram F Kahoho
FVG Analyzer – L’outil ultime pour détecter les Fair Value Gaps (FVG) avec précision FVG Analyzer est un indicateur puissant et entièrement personnalisable conçu pour les traders sérieux qui exploitent les Fair Value Gaps (FVG) dans leurs stratégies. Grâce à une détection intelligente et une visualisation claire, cet outil vous permet d'identifier rapidement les zones d’inefficience du marché, là où le prix pourrait potentiellement revenir avant de repartir dans sa tendance. Fonctionnalités clés
Avant de plonger dans les fonctionnalités de cet indicateur, n'oubliez pas de noter ce produit, de laisser un commentaire pour partager votre expérience, et de vous abonner à ma page pour rester informé des dernières mises à jour et nouveaux outils. Votre soutien est précieux et m'aide à améliorer constamment mes créations ! Description : TradingSessionPipsVisualizer - L'outil professionnel pour maîtriser les sessions de trading Visualisez instantanément les sessions Forex et optimisez votre tim
Le   TradeManagerRR Visualizer MT5   est un indicateur de gestion de trade conçu pour les traders souhaitant visualiser facilement leurs niveaux de prise de profit (TP) et de stop loss (SL) sur un graphique. Cette version initiale est une représentation graphique simple qui affiche les zones de SL et TP ainsi que le prix d'entrée. Veuillez noter que cette version actuelle se concentre uniquement sur l'affichage graphique des zones de SL et TP sous forme de figures sur le graphique. Caractéristiq
Filtrer:
Aucun avis
Répondre à l'avis