ARKA Fisher Pro MT4
- Indicadores
-
Aren Davidian
 Hello, I'm Aren Davidian, the founder and visionary behind ARKA, your go-to source for cutting-edge trading tools and expert insights. With over 14 years of experience in IT security within the Forex market, my journey into this captivating world began nearly four years ago.
 - Versión: 2.90
- Activaciones: 5
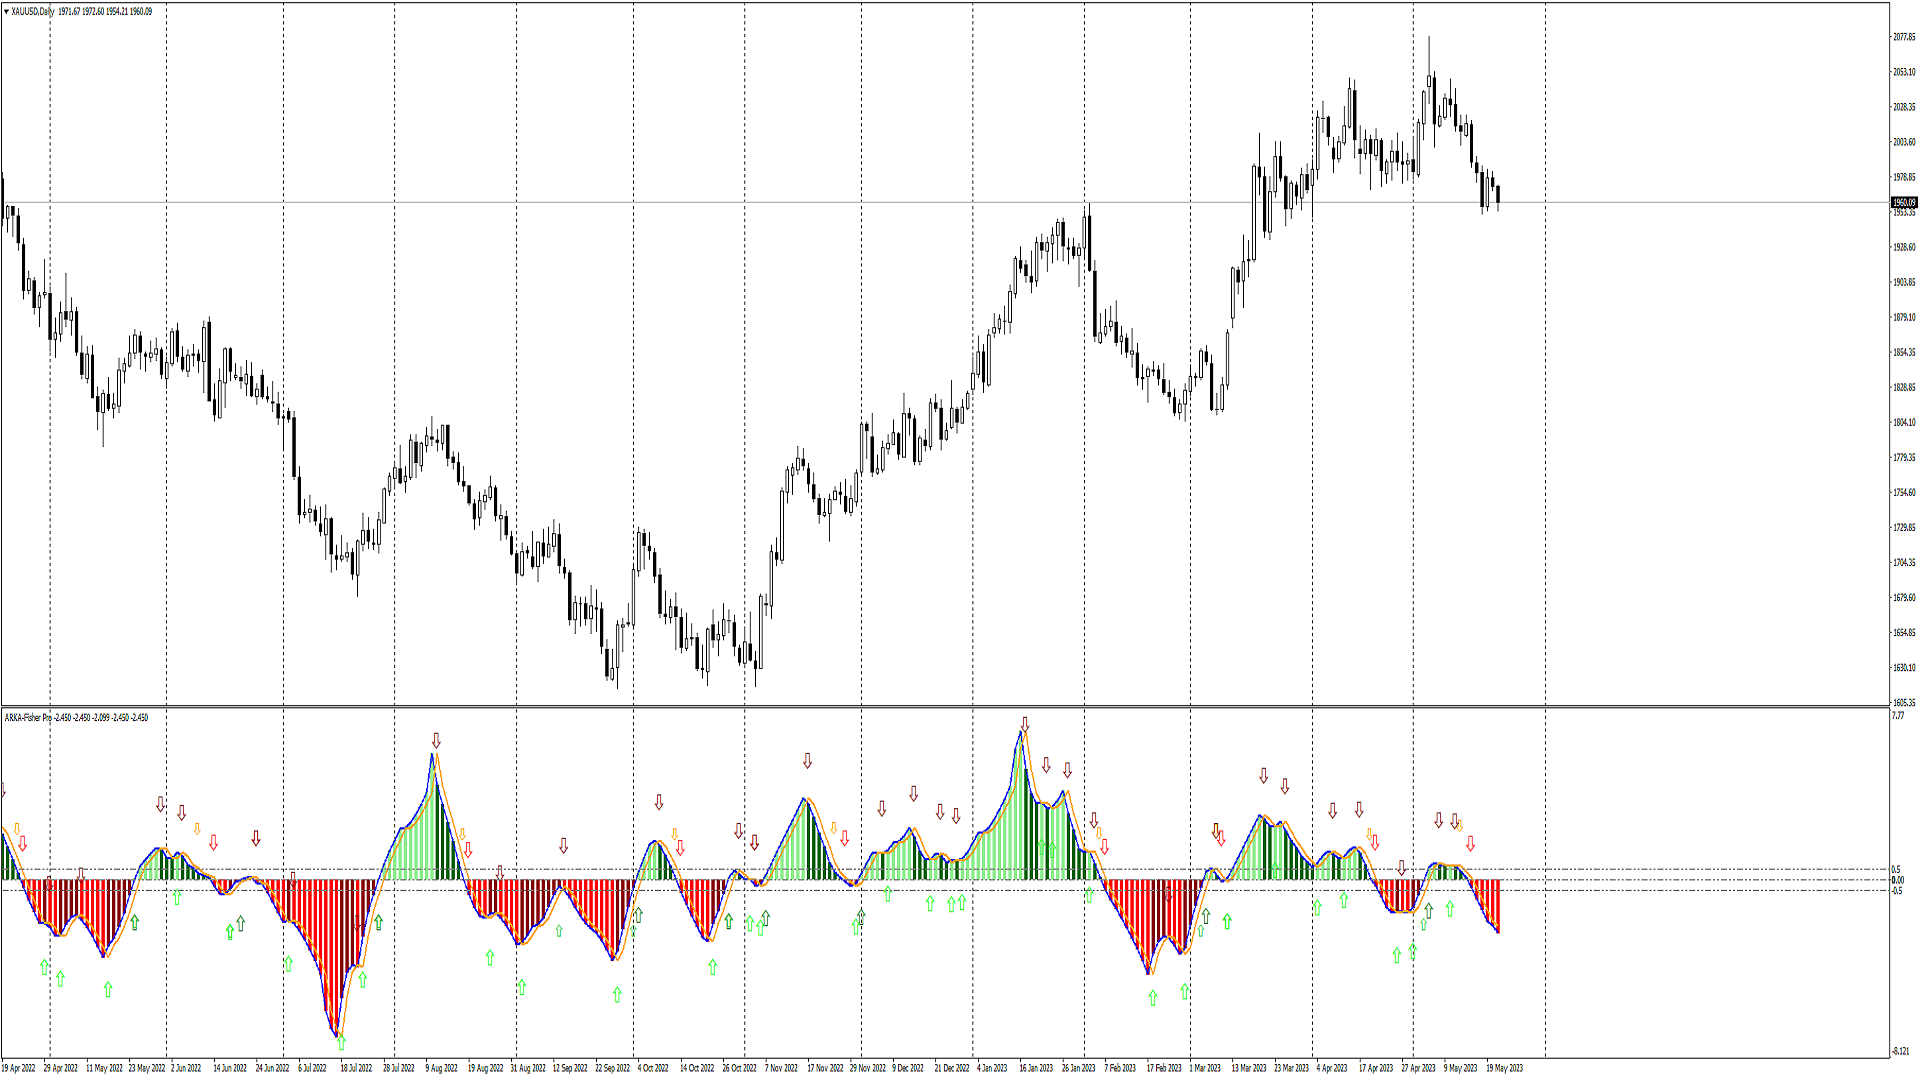
La Transformada de Fisher es un indicador técnico creado por John F. Ehlers que convierte los precios en una distribución normal gaussiana.
El indicador destaca cuándo los precios se han movido a un extremo, basándose en precios recientes. Esto puede ayudar a detectar puntos de inflexión en el precio de un activo. También ayuda a mostrar la tendencia y a aislar las ondas de precios dentro de una tendencia. La transformada de Fisher es un indicador técnico que normaliza los precios de los activos, lo que aclara los puntos de inflexión de los precios.
Conclusiones Los puntos de inflexión se vuelven mucho más claros con el uso de la Transformada de Fisher y su capacidad para seguir los precios de los activos. Además, mientras que algunos operadores optan por buscar lecturas más dramáticas que indiquen retrocesos en los precios, otros pueden encontrar más beneficioso seguir los cambios direccionales de la Transformada de Fisher. Aunque la Transformada de Fisher suele aplicarse a los precios de los activos, también puede aplicarse a otros indicadores.
Como se menciona en la sección Definición, la Transformada de Fisher es un indicador técnico que convierte el precio a una distribución normal gaussiana, a menudo incluyendo datos que no suelen tener una distribución normal (es decir, los precios de mercado). Esto hace que los datos se presenten como más uniformes, con cambios menos extremos para determinar los verdaderos retrocesos de los precios en el mercado.
Este indicador técnico es lo que algunos llamarían "ilimitado" y, por lo tanto, es posible que se produzcan extremos a largo plazo. La base de lo que constituye un extremo viene determinada por las lecturas históricas del activo con el que se está trabajando. Los valores de lectura difieren en función del activo que se esté analizando. Las lecturas del activo son importantes porque tienen el potencial de señalar una reversión, que puede ser confirmada o negada por los cambios direccionales de la Transformada de Fisher.
La Transformada de Fisher a menudo tendrá una línea de señal adjunta. Es esencialmente la media móvil de valor de la Transformada de Fisher y se mueve más lentamente que la línea del indicador tradicional. A menudo se utiliza cuando la Transformada de Fisher se mueve a través de la línea de activación.
Muchos operadores optan por utilizar la Transformada de Fisher con otros indicadores que trazan específicamente el análisis de tendencias. Esto se debe a que la Transformada de Fisher envía muchas señales comerciales diferentes, algunas de las cuales no son rentables en lo más mínimo. Al emparejarlo con otros indicadores, los operadores obtienen una visión más completa sobre cuándo reconocer y actuar sobre las señales de compra y venta.
Tenga en cuenta que el indicador de Transformación de Fisher no debe confundirse con las Bandas de Bollinger. Pueden parecer diferentes en un gráfico, pero ambos se basan en la distribución de los precios de los activos y a menudo pueden confundirse. Una forma de distinguirlos fácilmente es recordar que la Transformada de Fisher aparece en un gráfico de precios como un indicador independiente, mientras que las Bandas de Bollinger se superponen de forma distintiva sobre el precio.
Limitaciones Como se mencionó en la sección Qué buscar, la Transformada de Fisher a menudo puede enviar muchas señales comerciales, causando un poco de congestión cuando todo lo que está tratando de hacer es hacer reversiones y cambios extremos en el precio más fácil de identificar para los operadores. Esto puede llegar a ser un problema, por lo que se sugiere emparejarlo con otro indicador.
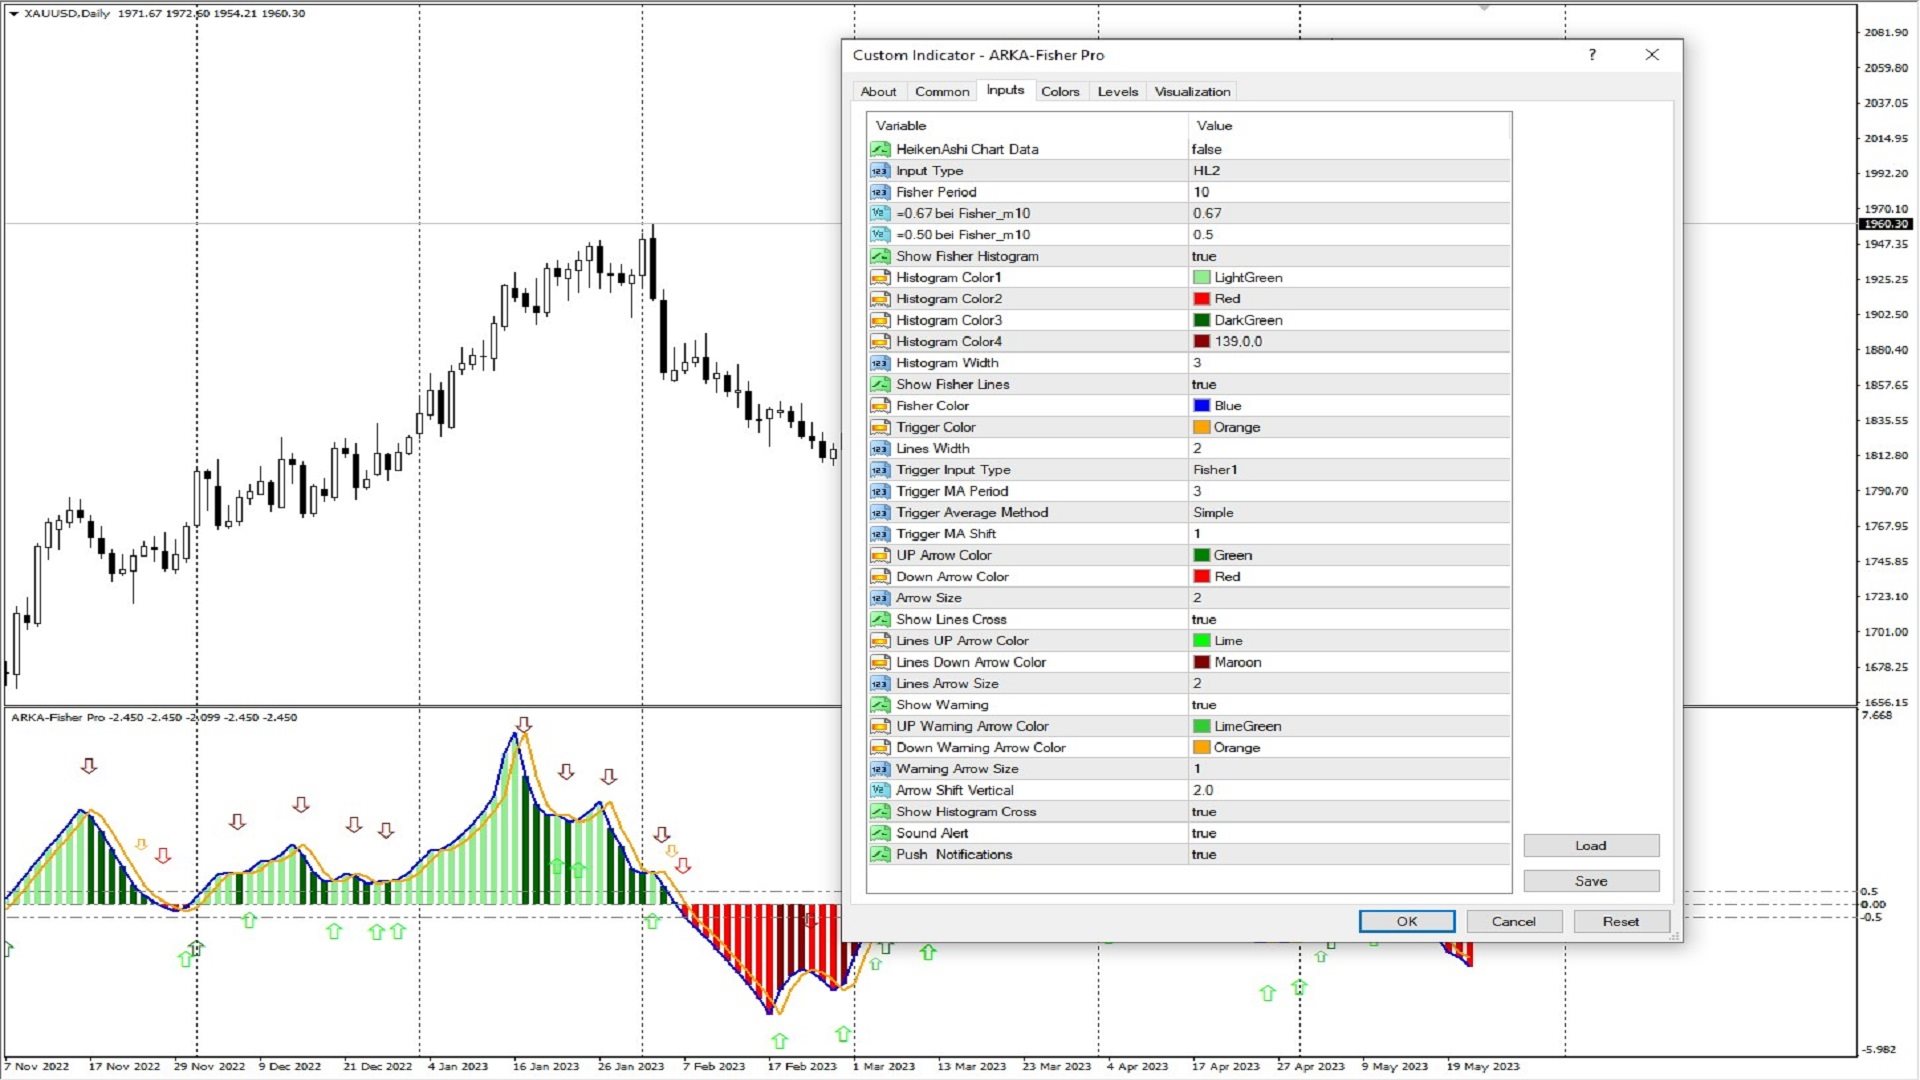
En este indicador, el histograma y las líneas se pueden utilizar simultáneamente y soporta cálculos basados en datos Heiken Ashi.
Hasta ahora es uno con posibilidades de versión gratuita. Las características de la versión Pro incluyen la especificación de señales con flechas y la visualización de alertas de notificación y más variedad para las entradas de cálculo.