ARKA Qstick MT4
- Indicadores
-
Aren Davidian
 Hello, I'm Aren Davidian, the founder and visionary behind ARKA, your go-to source for cutting-edge trading tools and expert insights. With over 14 years of experience in IT security within the Forex market, my journey into this captivating world began nearly four years ago.
 - Versión: 2.80
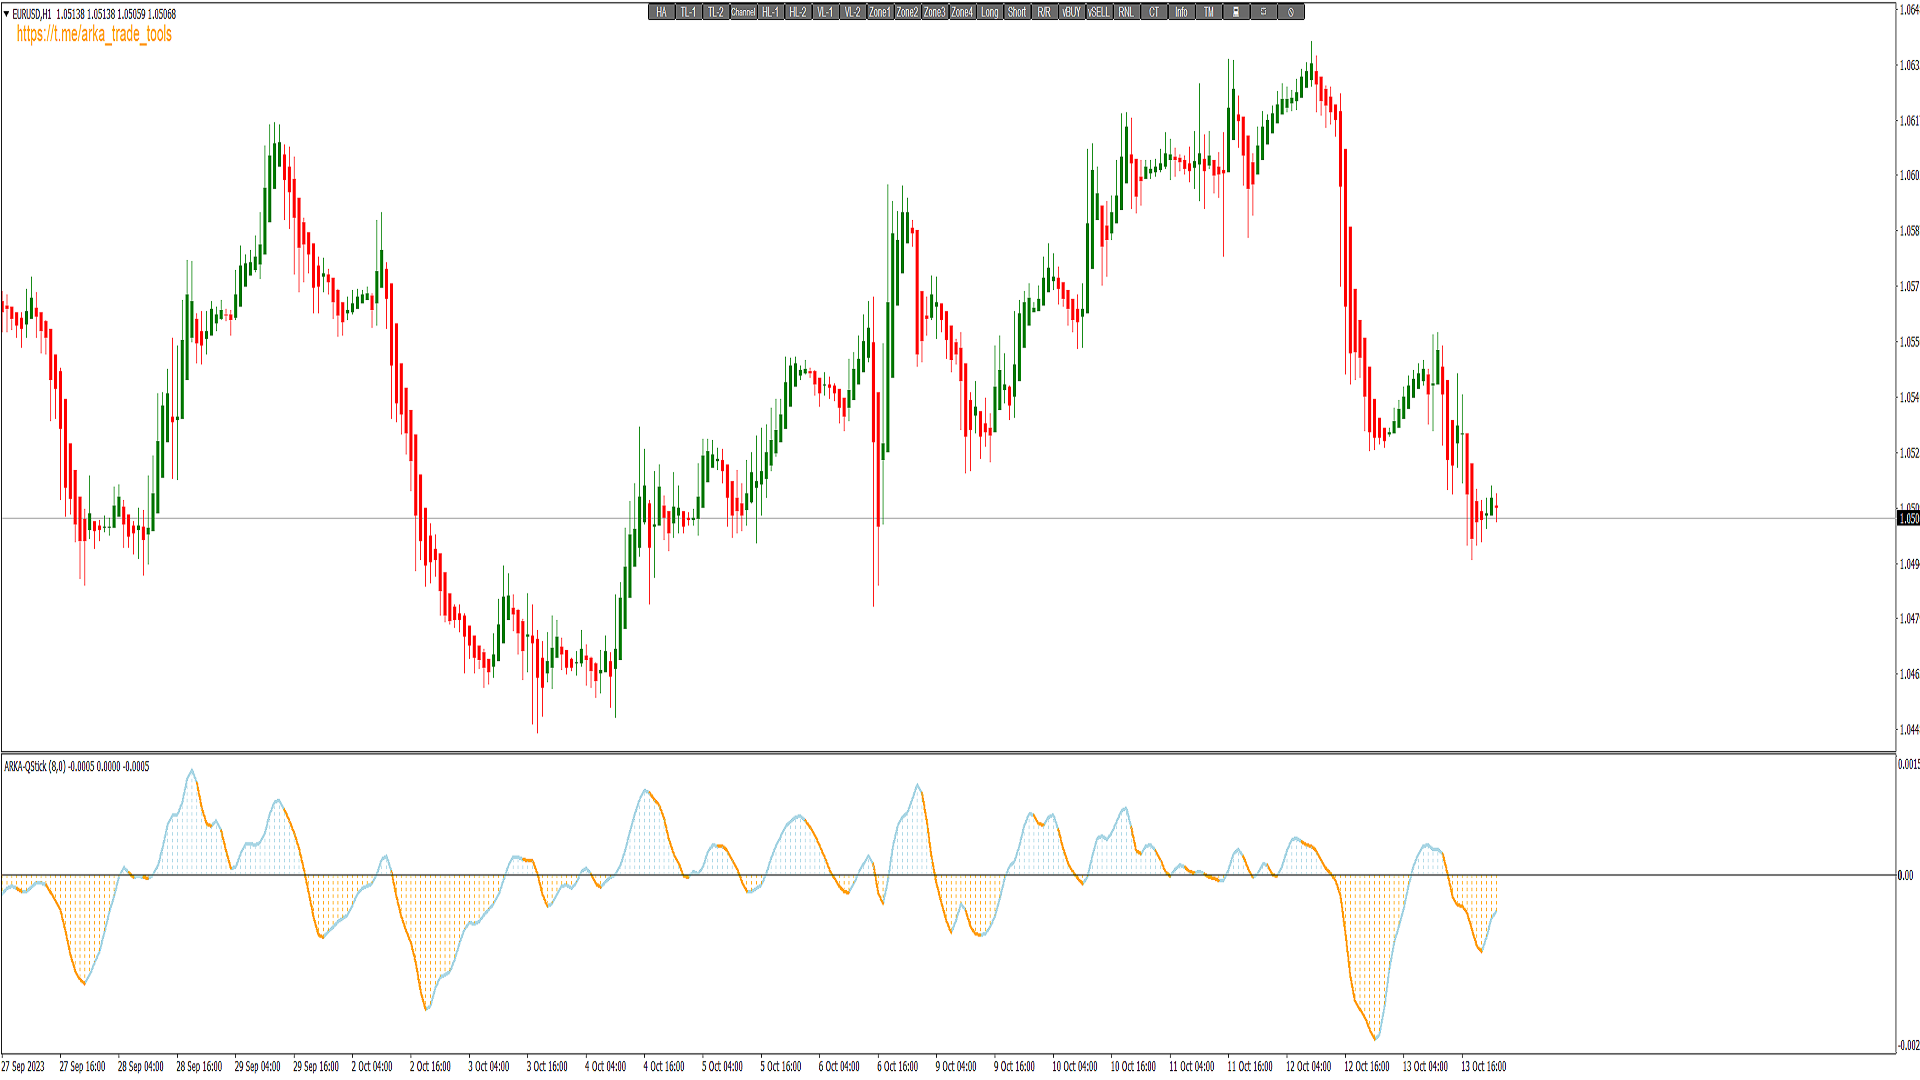
La idea de este indicador proviene de Tushar Chande y se llama Qstick.
Los indicadores técnicos cuantifican la dirección y la fuerza de la tendencia de diferentes maneras.
Una forma es utilizar la diferencia entre el cierre y la apertura de cada barra y sumarla durante un periodo de tiempo.
La forma es:
Qstick(periodo ) = Promedio ((cierre-abertura ), periodo )
En este indicador, podemos elegir cómo calcular el cuerpo según dos tipos de gráficos famosos. El primero y la configuración por defecto del indicador se basan en el gráfico Heiken Ashi, y el segundo se basa en el gráfico de Velas.
Si el valor resultante es positivo, la tendencia se considera alcista y se muestra con el color azul; de lo contrario,
la tendencia se considera bajista y se muestra con el color rojo.
Cuando el valor de Qstick es mayor que cero significa que la mayoría de los últimos "n" días (el valor por defecto es 8)
han sido alcistas, lo que indica que la presión de compra ha ido en aumento. A la inversa, cuando el valor de Qstick es inferior a cero significa que la mayoría de los últimos "n" días han sido bajistas, lo que indica que la presión vendedora ha ido en aumento.
El cruce de Qstick por encima del nivel cero se utiliza como sesgo alcista (señalde entradalarga) porque está indicando
que la presión compradora está aumentando, mientras que el sesgo bajista (señal de entrada corta) proviene delcrucedel indicador
por debajo de cero. Este indicador puede formar parte de sistemas de trading y podemos utilizarlo para confirmar nuestras señales.