Volume Impuls VSA
- Indicadores
- Versión: 1.1
- Actualizado: 21 noviembre 2021
- Activaciones: 5

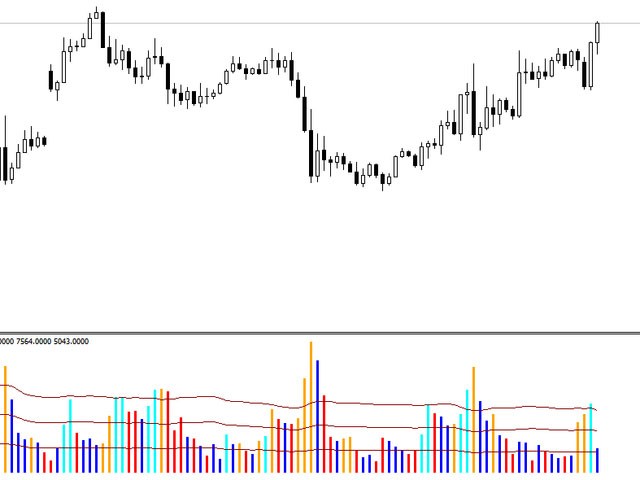
El indicador Impulsos de Volumen VSA pinta un histograma de volúmenes teniendo en cuenta la dirección de la barra y comparándolo con el volumen de las barras anteriores. El volumen de la tendencia alcista y bajista se pintan respectivamente en azul y en rojo. Si el volumen actual supera los volúmenes de la dirección opuesta, se forma un impulso. En consecuencia, el impulso de las tendencias alcista y bajista se pintan en azul y naranja. Además, el indicador muestra tres niveles, en base a los cuales se pueden comparar fácilmente los volúmenes. El análisis del volumen ayuda a identificar la tendencia actual del mercado. El indicador será útil para los operadores que utilizan el método VSA en el comercio. Utilizando el indicador, podrá determinar fácilmente los posibles niveles de retroceso durante la corrección, así como los momentos de inicio, fin e inversión de la tendencia. La combinación de Volume Impuls VSA con el indicador ProfileVolumesMarket de concentraciones de volumen proporciona una potente herramienta para la negociación de niveles basada en el volumen.
Parámetros ajustables
- PeriodAutoFit - cuando se establece en "true" - período de niveles para comparar los volúmenes del indicador 24 horas
- VSA_Period - periodo para calcular niveles de comparación de volúmenes del indicador en barras, si PeriodAutoFit = false
- ShowOfBars - profundidad del historial de visualización del indicador