Real Multi 25Market Speed 3Component Indicator
- Indicadores
-
Gerald Birkner
 MQL 4/5 Developer & active Forex Trader
Special Software on demand.
Experts & Indicators
Love the markets and coding.
Keep it growing ;-) - Versión: 1.1
- Actualizado: 25 enero 2023
- Activaciones: 5
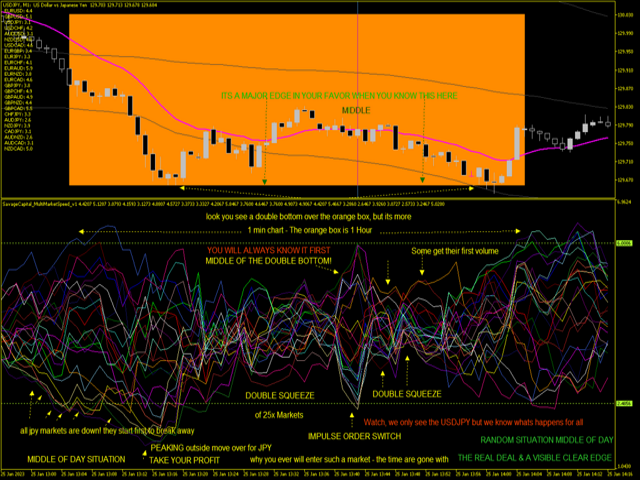
INDICADOR DE VELOCIDAD MULTIMERCADO PARA LA CATEGORIZACIÓN DEL FLUJO Y EL RENDIMIENTO DEL MERCADO
Especialmente desarrollado para la detección de patrones y la investigación de múltiples mercados y entre mercados,volatilidad yrendimiento.
Mide en tiempo real la velocidad y el rendimiento en varios mercados.
Detecte ciclos de precio y tiempo, compresiones, rendimiento, patrones en la estructura, patrones en el precio y la estructura, patrones en diferentes mercados individuales y cómo se mueven juntos, tiempo y acción del precio y, por supuesto, volatilidad próxima.
SÍ, ¡ha leído bien! Patrones próximos, formaciones de picos, aprietos de volatilidad y cambios de sentimiento. Muy efectivo para observaciones INTRADAY y comportamiento específico del mercado... Este indicador mql5 muestra cosas que normalmente nunca se ven, fácil y sencillo de usar. Te muestra muchos detalles. Date sólo 1 o 2 días de espectador, crecerás como trader y no caerás más en trades inútiles.
SIGUE CRECIENDO - DEJA DE HACER TRADES DE MALA CALIDAD. Utiliza herramientas profesionales que te darán una verdadera VENTAJA en toda tu perspectiva mental y de mercado. Con esto, usted puede pararse de condiciones de mercado de mierda esta herramienta lo hace visualmente claro? No hay lectura de números. Usted puede si usted necesita / desea detalles, pero basta con ver las líneas de sus mercados favoritos. Cuando estén listos para moverse, ¡lo verá ahora de frente! Sin adivinar, sin esperar que los mercados se muevan. Aprenda este programa para ver, y usted es capaz de desarrollar un mejor plan de comercio para usted.
- Sin retras osni demoras. Mantenga su codicia bajo control - ¡Espere el momento!
- Obtener un sentido para el flujo real del mercado y ver qué grupos de mercado se separan unos de otros, cómo y en qué momento.
- Esto no es un emisor de señales para tomar decisiones comerciales. No le mostrará ningún patrón estándar predefinido.
- En un par de días con esta herramienta será capaz de leer el flujo de 25 mercados (elija cualquier símbolo de mercado que tenga/quiera ver y compárelo con los demás) PERO GANARÁ MUCHA VISIÓN INTERIOR.
- Si desea ocultar algunos mercados, hágalos transparentes.
- Si desea agrupar los mercados, darles un color que te gusta
- O agrúpalos con diferentes estilos
Usted puede encontrar con esta herramienta de comercio de alta calidad muchos detalles para desarrollar estrategias de comercio fuertes y constantes.
Configuración ajustable:
- Timeframe
- Variable basada en RSI
- Variable basada en ROC
- Variable basada en la velocidad
- 25 mercado
- color
- estilo
- valores finales numéricos calculados para la identificación del rendimiento global de cada mercado.
BIENVENIDO A HACKED-MARKETS,
DISFRUTE DE UN SOFTWARE DE TRADING PROFESIONAL PARA OBTENER RESULTADOS DE TRADING CONSTANTES