SUM Swing HL n CP MT5
- Indicadores
- Versión: 1.0
- Activaciones: 10

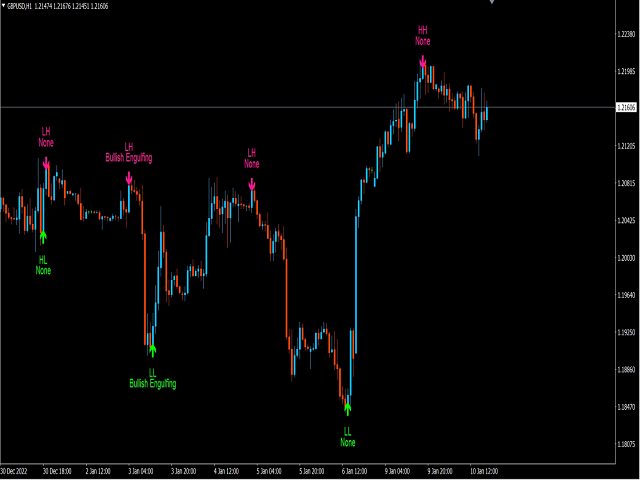
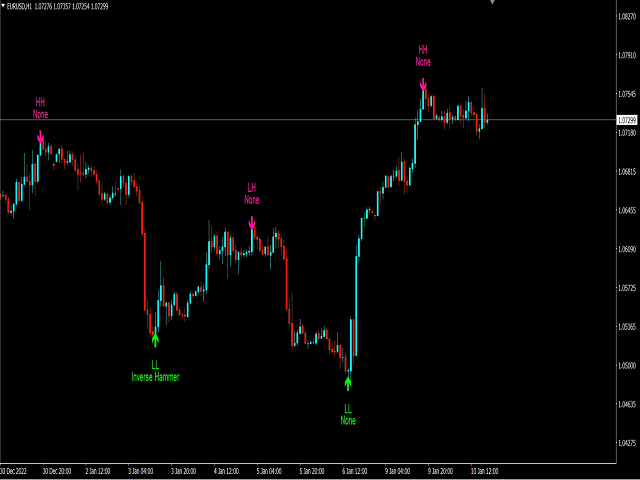
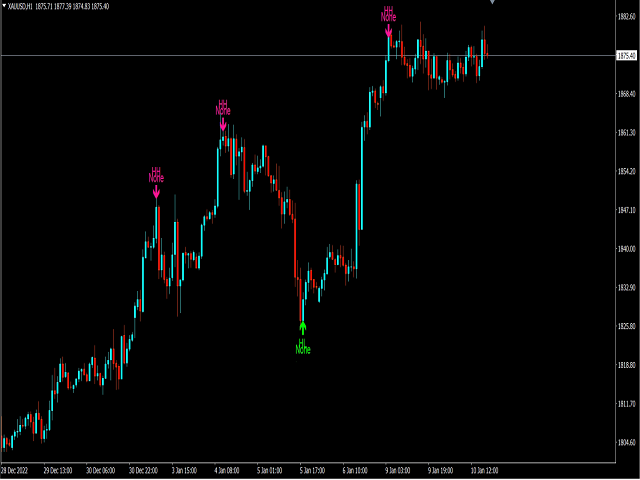
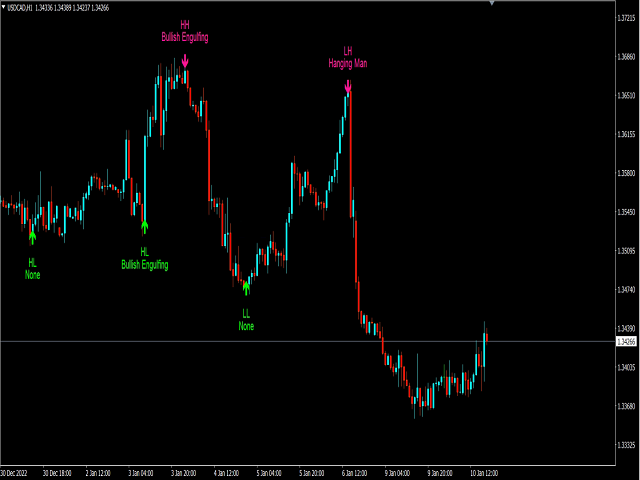
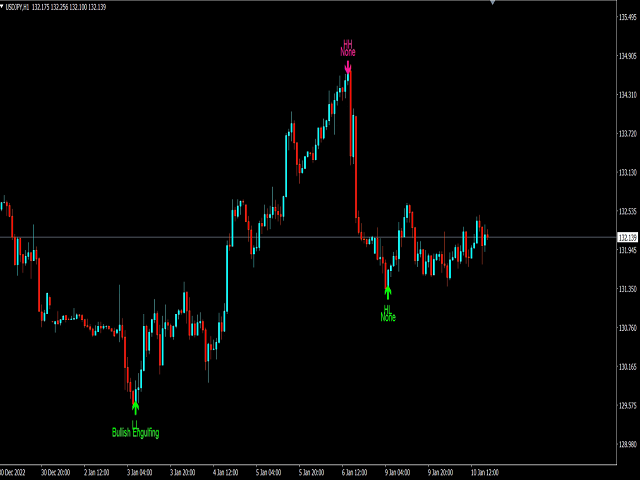
Este indicador etiqueta los máximos y mínimos oscilantes, así como el patrón de velas que se produjo en ese punto preciso.
El indicador puede detectar los siguientes 6 patrones de velas:martillo, martilloinverso, envolvente alcista, hombre colgante,estrella fugaz yenvolvente bajista.
Las notaciones HH, HL, LH y LL que puede ver en las etiquetas se definen de la siguiente manera:
- HH : Máximo más alto
- HL : Mínimo superior
- LH : Máximo más bajo
- LL : Mínimo inferior
Ajuste
- Longitud: Sensibilidad de la detección de swing high/low, con valores más bajos devolviendo el máximo/mínimo de variaciones de precio a más corto plazo.
Uso y Detalles
Puede ser interesante ver si un máximo o mínimo está asociado a un patrón de vela específico, esto nos permite estudiar el potencial de dicho patrón para indicar una reversión. Puede pasar el ratón sobre una etiqueta con un patrón específico para ver más detalles sobre el mismo.
Tenga en cuenta que las etiquetas están desplazadas, y aparecerán más tarde en tiempo real, por lo que este indicador no está pensado para detectar máximos/bajos en tiempo real.