Z Score Standardized Normal Distribution
- Indicadores
-
Florian Nuebling
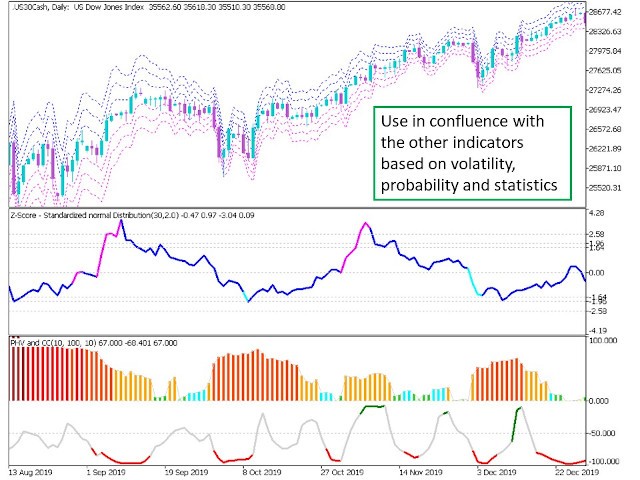
 indicators based on statistical methods, probabilities and volatility. As price follows a random walk and assumed to follow a log-normal distributed, the provided concepts are based on log returns for normalization. Returns are mean reverting and can be approximated as normal distributed. The
 - Versão: 1.0
- Ativações: 5
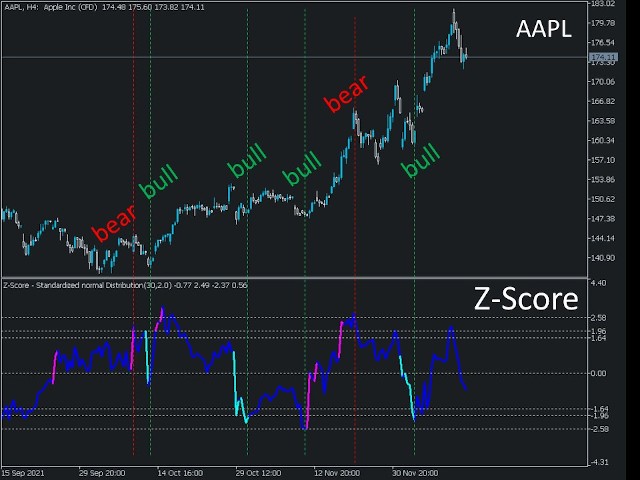
This z-score indicator shows the correct z-score of an asset, as it uses the normalized price data for calculation, which is the only correct way. Z-score is only applicable for normal distributed data, therefore not the actual price is considered, but the normalised returns, which were assumed to follow a normal distribution.
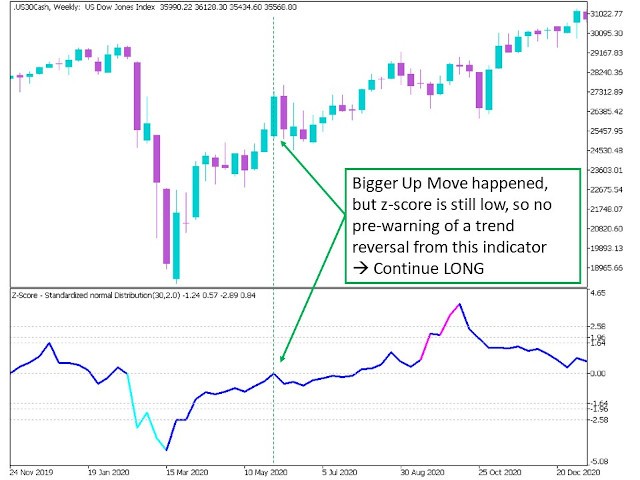
Returns are mean reverting and assumed to follow a normal distribution, therefore z-score calculation of returns is more reliable than z-score on price, as price is NOT mean reverting and follow NOT a normal distribution but a log-normal distribution.
Z-score measures the distance to the mean in terms of standard deviation. If z-score is 0 it is equivalent to the mean score, if it is 1.0 the distance is 1 standard deviation from the mean. Therefore, it is important that the underlaying data follows a normal distribution, which the returns are assumed.
This indicator curve is the thick z-score line (coloured blue). It also shows outliers, if the respective line exceeds it individual standard deviation band it changes colour. At the default mode is exceeding 2 SDs. If turning pink it indicates a pre-warning that a bearish reversal could take place. If the Blue line turns “aqua” it indicates a bullish reversal.
How to use: As the returns are mean reverting, it is more likely if the z-score is high, that there will be a reversal back to the mean. So, it is an oscillator in the general sense. The confidence intervals for 90%, 95% and 99%, are also plotted which can act as probability levels, that the z-score will not exceed that level. That means, it can indicate a reversal. For instances if the curve is close to the 99% line, there is only a probability of 1% that the z score will exceed that line, so a reversal is more likely. Also, the colour change of the returns line (default: blue) can indicate a reversal (pink: bearish, aqua: bullish)
The Input Settings:
Sample Size: Default 30, length of periods back to calculated z-score
Multiplier: default 2.0, Multiplier in terms of standard deviation, to show outliers/possible reversals (line colour change)
Remark: Indicator is provided for statistical analysis and showing probabilities only and should not be construed as financial advice.