Percentile of Historical Volatility Correlation
- Indicadores
-
Florian Nuebling
 indicators based on statistical methods, probabilities and volatility. As price follows a random walk and assumed to follow a log-normal distributed, the provided concepts are based on log returns for normalization. Returns are mean reverting and can be approximated as normal distributed. The
 - Versión: 1.0
- Activaciones: 5
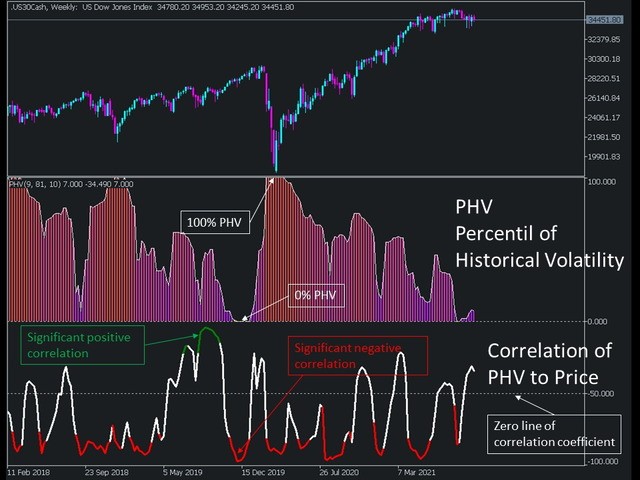
El percentil de la volatilidad histórica y el coeficiente de correlación muestran si el activo está barato o caro en función de la volatilidad. Se utiliza para determinar un buen punto de entrada. Tiene dos indicadores incorporados: La volatilidad histórica se clasifica por percentiles y su correlación con la acción del precio que da una indicación de la dirección de un posible movimiento futuro. Juntos, ambos indicadores pueden proporcionar buenas entradas y direcciones.
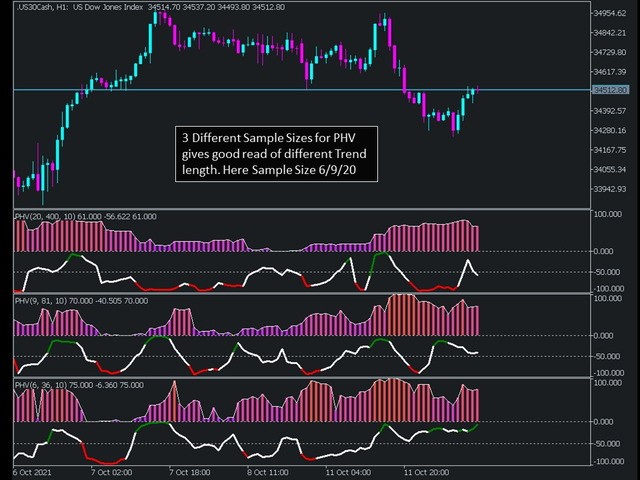
Volatilidad Histórica es una medida estadística de la dispersión de los rendimientos de un activo durante un período determinado (Tamaño de la Muestra de Volatilidad Histórica). En este indicador el modelo de volatilidad se calcula como la desviación estándar de los rendimientos. Ponderado con percentil con el periodo dado (Sample Size Percentile). Muestra el porcentaje de velas durante el último periodo seleccionado (Percentil de Tamaño de Muestra) donde la Volatilidad Histórica se negoció por debajo del nivel actual.
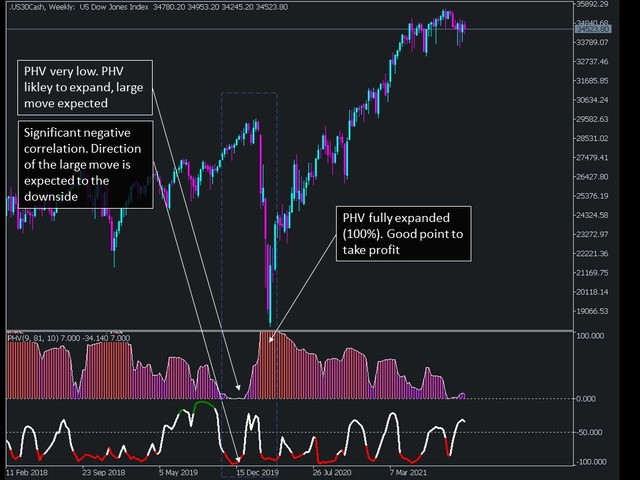
Esto significa que si el PHV (Percentil de la Volatilidad Histórica) está en el 5%, se negoció sólo el 5% de las veces (dentro del período del percentil) por debajo de ese nivel. Si PHV está por encima del 80% indica, que la volatilidad histórica es más alta de lo habitual. Por lo tanto, una estrategia podría ser, entrar en un PHV muy bajo, ya que es probable que se expanda y se produzca un movimiento más grande.
Los valores del indicador se muestran como columnas y van de 0 a 100 [%]. NO es un indicador direccional, sólo junto con la Correlación es posible determinar la dirección.
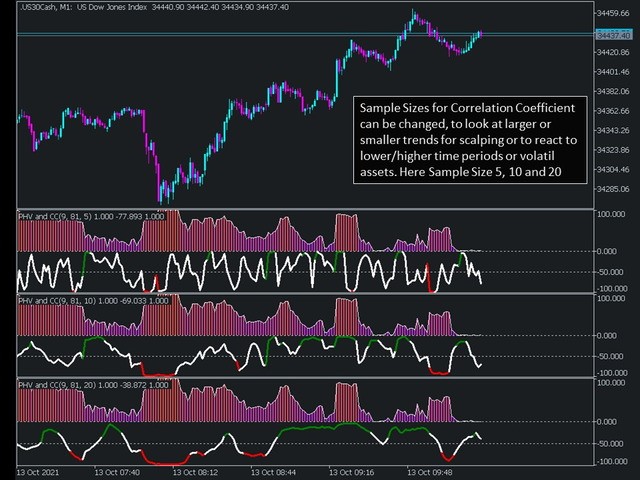
El Coeficiente de Correlación se muestra en el panel debajo del PHV para correlacionar el indicador no direccional con el precio, para hacerlo direccional. Se utiliza la Correlación de Pearson tradicional. Se muestra como una línea y se escala. Por lo general, va de -1 a 1, para la representación se escala de -100 a 0 (por lo que -50 es la línea cero). La línea de correlación se colorea a partir del valor p calculado, basado en un nivel de confianza de significación de 0,05 (5%). Si la línea de correlación se vuelve "verde", muestra una correlación positiva significativa entre el PHV y el precio. Si se vuelve "roja", se determina una correlación negativa significativa.
Estrategias de ejemplo:
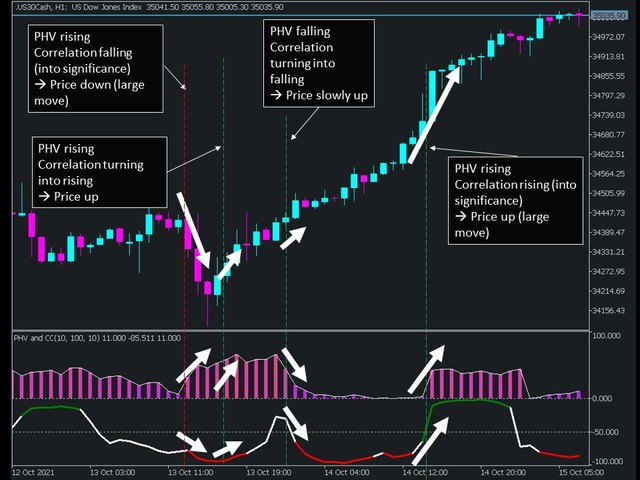
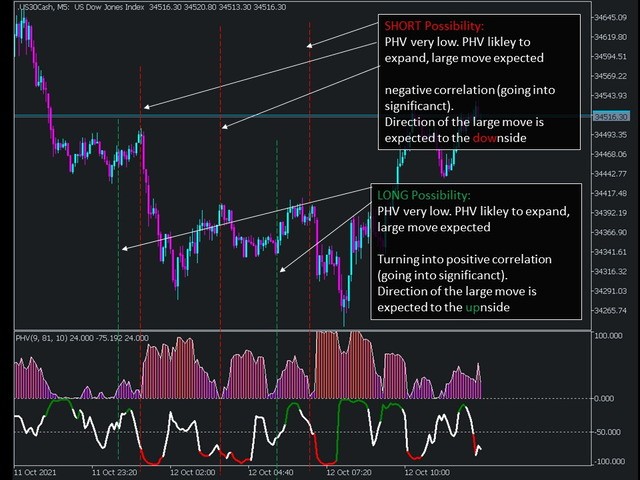
- PHV en aumento (percentil de volatilidad histórica en aumento) Y correlación positiva significativa = posible movimiento más grande en la acción del precio al alza esperada (LARGO)
- PHV al alza (percentil de volatilidad histórica en aumento) Y correlación negativa significativa = posible movimiento más amplio en la acción del precio a la baja esperada (CORTO)
- PHV a la baja (percentil de volatilidad histórica decreciente) Y correlación negativa = es probable que el precio suba lentamente (LARGO)
- PHV decreciente (percentil de volatilidad histórica decreciente) Y correlación positiva = el precio probablemente se moverá lentamente a la baja (CORTO)
Los ajustes de entrada:
Tamaño de la Muestra Volatilidad Histórica: Por defecto 10, longitud de los períodos de vuelta a la volatilidad histórica calculada.
Tamaño de Muestra Percentil: Por defecto 100 (Recomendación utilizar la potencia del Tamaño de Muestra de Volatilidad Histórica), duración de los periodos de vuelta al percentil calculado de volatilidad histórica.
Tamaño Muestra Correlación: Por defecto 10, duración de los periodos de vuelta a la correlación calculada de PHV y Precio.
Observación: El indicador se proporciona únicamente para el análisis estadístico y para mostrar probabilidades, y no debe interpretarse como asesoramiento financiero.