CCI Scanner with Alerts
- Indicadores
- Versión: 1.0
- Activaciones: 5
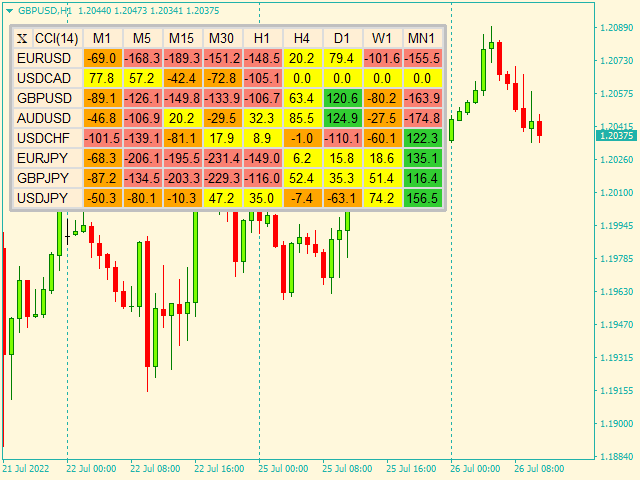
Un útil panel que muestra los valores del CCI para múltiples símbolos y marcos temporales.
Se puede ocultar/mostrar fácilmente con un simple clic en la X de la parte superior izquierda del panel.
Puede introducir los valores superior e inferior del CCI y configurar los colores para que se muestren por encima o por debajo de estos valores. Los valores por defecto son 100 y 30-100.
También se pueden introducir colores para cuando el CCI es positivo o negativo (pero sin sobrepasar los niveles superior/inferior).
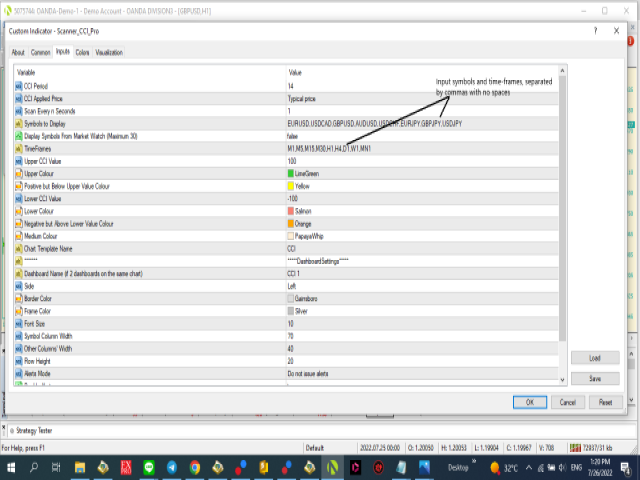
Los símbolos y los plazos se introducen separados por comas.
Los símbolos también pueden cargarse desde la ventana de Observación del Mercado. Si hay más de 30 símbolos, sólo se cargarán los 30 primeros.
Puede elegir si el panel se muestra a la derecha o a la izquierda del gráfico.
Si desea tener 2 tableros en el mismo gráfico, debe introducir un nombre diferente para cada uno.
El escaneo se ajusta a un temporizador y el valor por defecto es cada segundo.
ALERTAS
Puede configurarlo para que emita alertas cuando se alcancen los niveles superiores o inferiores.
Las alertas intra-barra se activarán basándose en el valor del CCI de la última barra cerrada y el valor actual del CCI.
Por ejemplo, si el CCI de la última barra cerrada está por debajo del nivel superior del CCI y el valor actual del CCI alcanza el nivel superior, se emitirá una alerta.
Sólo se emitirá una alerta por barra.
Las alertas de barra cerrada normalmente sólo se activan cuando una barra acaba de cerrarse y se basan en la barra que acaba de cerrarse y en la barra anterior a ésta.
Por ejemplo, si el CCI de la barra que acaba de cerrarse está por encima del nivel superior y la barra anterior a ese valor de CCI está por debajo del nivel superior, se emitirá una alerta.
Cuando se inicia el escáner, puede recibir alertas adicionales inicialmente mientras se actualiza.
Puedes configurar una plantilla de gráfico y llamarla "CCI" ( o lo que quieras y cambiar la entrada).
Así, si le interesa el EURUSD M15, sólo tiene que hacer clic en la celda correspondiente (frente al EURUSD y debajo del M15) y se abrirá un nuevo gráfico con la plantilla "CCI" aplicada.
No es recomendable que la plantilla tenga también el escáner, sólo el indicador CCI y cualquier otra cosa que pueda necesitar.