RSI Divergence Scanner, Multi Timeframe and Multi Symbol
Product Page MT5: click here
Product Page MT4: click here
You can download the demo version from bottom of the page.
INPUT PARAMETERS:

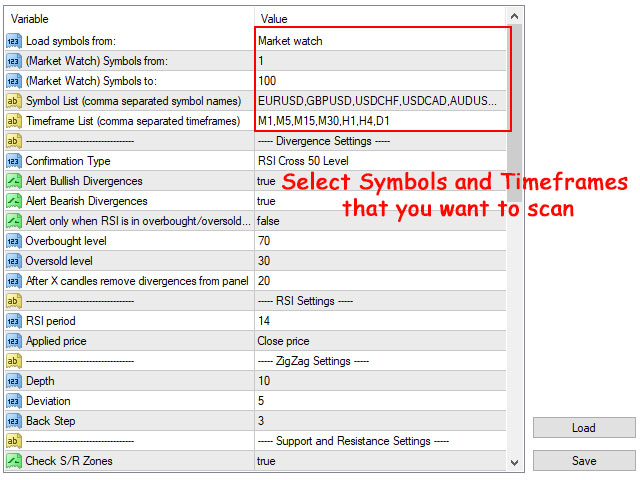
- Load Symbols from: Select the source of the symbols for load into the dashboard, it can be market watch or comma separated symbol names from the next parameter.
- (Market Watch) Symbols from: Start loading market watch symbols from this number.
- (Market Watch) Symbols to: End loading market watch symbols to this number.
- Symbol List: Comma separated list of symbol names to show in the dashboard, ignore this parameter if you select market watch as source of symbols.
- Timeframe List: Input comma separated list of timeframes for showing in dashboard, like: M1,M15,H4,D1.
Divergence Settings
- Divergence Type: Scanner searches for which type of divergences: regular, hidden or both
- Confirmation Type: This parameter determines when you receive the alert after the divergence has formed:
- When RSI returns to the 50 level and crosses it
- After the price returns to the beginning of the last wave
- Changing the color of Heiken Ashi indicator: This usually happens fast, so you will have early alerts (more alerts and more failed divergences).
- Strong Candle (may not happen): Divergence will confirm when a strong reversing candle happens after it. You can set the parameters to define the strong candle. Please remember that based on your settings, strong candle may not happen and dashboard don't show the divergence.
- Alert without confirmation, this option gives early alerts, so there will be more failed divergences but more reward/risk for valid divergences. Also if the trend continues you may receive an alert for each new candle.
- Use Moving Average filter: By enabling this option dashboard shows divergences only if they are in the direction of the trend, so dashboard shows bullish divergences only if the MA goes upward or/and bullish divergence happens above the MA, and dashboard shows bearish divergences if the MA goes downward or/and bearish divergence happens below the MA (also check the Moving Average Filter Settings).
- Alert only when RSI is in overbought/oversold levels: Enabling this option usually cause that scanner only consider divergences that happen after bigger price moves.
- Regular divergence overbought,oversold levels: Comma separated overbought and oversold levels for regular divergence (default is 70,30).
- Hidden divergence overbought,oversold levels: Comma separated overbought and oversold levels for hidden divergence (default is 55,45).
- After X candles remove alerts from the dashboard: For how many candles, dashboard must keep the record of the divergences.
Regular Divergence Ratios:
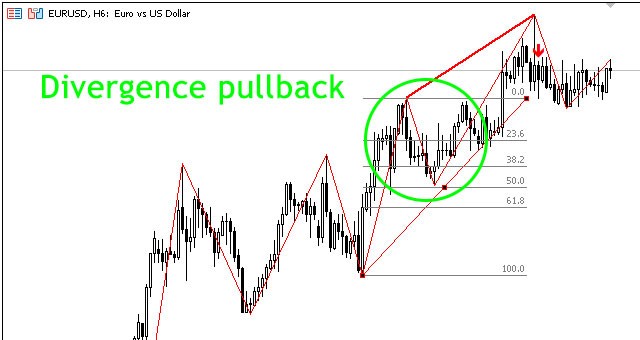
- Min. divergence pullback percent (Fibonacci retracement): With this parameter you can set the minimum percentage of pullback needed before the last leg of the trend, a larger pullback means the trend loses more power. Higher values for this parameter reduces the number of detected divergences.
- Only find divergences that happen after a long trend: By enabling this option you can ignore divergences that happen after short price movements, enabling this option reduces the number of signals.
- Min. trend length ratio (trend length/last wave): Define how many times the total length of the trend must be bigger than the length of the last wave.

Strong Reversing Candle (Confirmation Type) Settings:
Settings for "Strong Reversing Candle" option of "Confirmation Type" parameter. In this confirmation type, divergence will be confirmed if a strong reversing candle happens after it. With more strict parameters, you will receive fewer alerts.
Both filters won't consider the last candle of the trend in their calculations, because the last candle of the trend may be an exhaustion gap candle (a very big candle that happens at the end of the trend).
- How to find strong candle: Choose the filter type for finding strong candles. Filters compare the candle with last candles of the trend (candles that lead to happening of the divergence).
- Average body filter: The body of the reversing strong candle must be bigger than the average body of the last X candles of the trend.
- Big candle filter: The body of the strong reversing candle must be bigger than the body of all last X candles of the trend.
- Whichever happens first: Both filters will be used to find a strong candle faster.
- Average Body Factor: How much the body of the strong candle must be bigger than the average body of the previous candles. For example, if you set this parameter=2.5, then the body of the strong candle must be at least 2.5 times bigger than the average body of the previous candles. If this parameter=1 then the strong candle must be just bigger than the average body of the previous candles.
- Average Body Period: Number of last candles of the trend that must be used for averaging.
- Big Candle Factor: How many times the body of the strong candle must be bigger than the body of previous candles.
- Big Candle Period: Number of last candles of the trend that the body of the strong candle must be bigger than them.
- Strong candle must open before price return to previous H/L: By enabling this option you can ignore a divergence if strong candle opens after price returns to the last High/Low of the trend.
- Strong candle must happen max X candles after divergence: Ignore divergence if strong candle happens too far from the divergence.
Moving Average Filter Settings:
- Main MA filter: You can choose to receive alert for divergences based on the direction of the MA or the position of the divergence relative to the MA (for example, receive alert for bullish divergences if MA is bullish or divergence happens above the MA), also you can choose to receive alert if any of the previous conditions are met or receive alert only when both of the previous conditions are met.
- Second MA filter: Like main MA, you can select filter type for second MA or don't use the second MA for filtering the divergences.
- Main MA filter direction: If you select the “Find divergences that are in the direction of MA” option, then you will receive alert for bullish divergences if the main MA is bullish or divergence happens above the main MA. But if you select the “Find divergences that are in opposite direction of MA” option, you will receive alert for bullish divergences if the main MA is bearish or divergence happens below the main MA. The same applies for bearish divergences.
- Second MA filter direction: Similar to the above parameter, so for example if you select the “Find divergences that are in opposite direction of MA” option, you will receive alert for bearish divergences if the second MA is bullish or divergence happens above the second MA.
- Apply main MA filter to: You can choose to apply the main MA filter to only regular divergences or hidden divergences.
- Apply second MA filter to: You can choose to apply the second MA filter to only regular divergences or hidden divergences.
For each timeframe you can use 1 or 2 MA filters and each of these MA filters can be from the same or bigger timeframes. So in the following parameters you can set: MA filter for each timeframe should be from which timeframe. Also, you can set different MA periods for filters. Example: with following parameters, you can set that MA filter for M30 timeframe must be Exponential MA from H4 timeframe with period equal to 50. - Main MA timeframes (9|21 comma separated values for M1 to MN1): For each timeframe, you can choose from which timeframe the MA filter should be. For example, if you want to apply the M30 MA filter to the M15 timeframe, then set M30 as the third value in the comma-separated string. Another example, if you want to apply the daily MA filter to the daily chart, set the seventh value = D1. The default value of the parameter, sets the MA filter of each time frame from the same time frame.
- Second MA timeframes (9|21 comma separated values for M1 to MN1): The default value of this parameter sets the MA filter of each timeframe (except W1 and MN1 timeframes) from the second bigger time frame. For example the MA filter for M15 timeframe, is the MA from H1 timeframe.
- Main MA periods (1 value or 9|21 comma separated for M1 to MN1): You can set one MA period value for all main MA filters of timeframes, or like above parameters set 9 (21 for MT5) comma separated period values for MA filters for 9 (21 for MT5) timeframes.
- Second MA periods (1 value or 9|21 comma separated for M1 to MN1): You can set one MA period value for all second MA filters of timeframes, or like above parameters set 9 (21 for MT5) comma separated period values for MA filters for 9 (21 for MT5) timeframes.
- Method (for both MAs): MA averaging method
- Applied price (for both MAs): MA applied price

Support and Resistance Settings:
Please check shved supply and demand indicator to see how zones change based on these parameters.
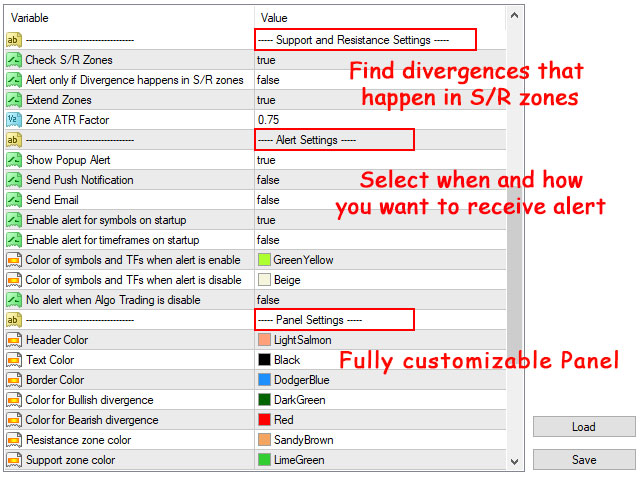
- Check S/R Zones: If set to true, scanner checks all timeframes of all symbols, and if HH/LL of divergence is inside support or resistance zones then it changes the background color of the related cell based on the type of the zone. Also if you move the mouse cursor to the cell you can see the type and strength of the zone on the popup text.
- Alert only if divergence happens in S/R zones: If set to true, the alert only triggers if divergence is formed inside the support and resistance zones.
- Extend Zones: If set to true, EA goes dipper in history bars to find support and resistance zones. The result will be more and sometimes wider zones.
- Zone ATR Factor: Changes zone height based on ATR indicator values, less value means thinner and more accurate zones, but less chance to trigger the alert.
Alert Settings:
- Enable alert for symbols on startup: Enable alert for all symbols when attaching the EA to chart. You can also enable/disable alert for each symbol by clicking on its cell on the dashboard.
- Enable alert for timeframes on startup: Enable alerts for all timeframes when attaching the EA to the chart. You can also enable/disable alert for each timeframe by clicking on its cell on the dashboard.
- Show Popup Alert: Show popup alert when RSI divergence happens in the selected timeframes of the selected symbols.
- Send Push Notification: Send push notification to mobile phone when alert triggers (you should set metatrader Notifications options).
- Send Email: Send email when alert triggers (you should set metatrader Email options).
- Color of symbols and TFs when alert is enable: Color for symbol and timeframe cells when alert is enabled.
- Color of symbols and TFs when alert is disable: Color for symbol and timeframe cells when alert is disabled.
- No alert when Algo Trading is disable: If true, then you can disable alerts by disabling "Algo trading" button on metatrader terminal.
Dashboard Settings:
- Split symbols in X columns: You can split the symbols into 2 or 3 columns.
- Header Color: Color of the header of the dashboard.
- Text Color: Color of symbol and timeframe text.
- Border Color: Color of borders of the dashboard and its cells.
- Color for bullish regular divergence: Color for the text of bullish regular divergence.
- Color for bearish regular divergence: Color for the text of bearish regular divergence.
- Color for bullish hidden divergence: Color for the text of bullish hidden divergence.
- Color for bearish hidden divergence: Color for the text of bearish hidden divergence.
- Resistance zone color: Color for cells that show resistance zones.
- Support zone color: Color for cells that show support zones.
- Height of Dashboard Rows: Height of the dashboard rows.
- Width of Symbols Column: Width of first column of the dashboard that shows the symbol names.
- Width of Timeframe Columns: Width of other columns of the dashboard .
- Dashboard Distance from Left: Dashboard distance from left of the chart.
- Dashboard Distance from Top: Dashboard distance from top of the chart.
- Text Font Name:Font name of dashboard text.
- Font Size:Font size of dashboard text.
- Draw dashboard behind the price chart: If set to true, dashboard will be behind the price chart
- When clicking on the dashboard cells: Save a template with default.tpl or custom.tpl name, then use this option to choose what happen when click on dashboard cells
- Show divergence and arrow in opened chart: After clicking on table cells, show divergence and arrow in opened chart with default template.
- Show S/R zone in opened chart: After clicking on table cells, show S/R zone in opened chart with default template
- Custom template name for opened charts: Custom template name for opened charts: template name for opened chart, if you want to open chart with custom template
- Auto open chart when divergence detected: If set to true, when you receive alert for divergence, also its chart will open without need to click on its dashboard cell.
In the MT5, RSI divergence indicator automatically will be added to the opened chart, but for MT4 you should save the RSI indicator on "default.tpl" template (with input parameters equal to RSI parameters in the dashboard settings), then the dashboard draws the divergence line on the indicator in the new chart.
How to use dashboard signals in EA?
Dashboard signals can't be inserted in the EAs like the way we do for indicators, but you can set the dashboard to open a chart (with default or custom chart template) for each divergence that it detects and show the divergence lines and signal arrow in the new chart.
Add your EA to the chart template, so when dashboard opens a new chart your EA will be running on the new chart and it can use the name of the signal arrow object to extract the divergence info, these info are:
- Type of the divergence (regular or hidden)
- Direction of the divergence (bull or bear)
- Open time of candles that show the start of the divergence line, end of the divergence line and signal arrow.
- The timeframe of the signal (for example, 15 for M15 and 16385 for H1)
For example, the arrow name for RSI divergence scanner is like this:
RSIS_Regular_Bull_1695816000_1696377600_1696377600_15
So in your EA you should use ObjectsTotal() and ObjectName() functions to search for an arrow that starts with "RSIS", then use the StringSplit() function to insert the 6 parts of the arrow name in an array and use that array to access the divergence info.
After further analysis of the signal, if your EA doesn't decide to open an order, it can close the chart with the ChartClose() function.
DOWNLOAD DEMO:
Demo version works on M4,M6,M12,M20,H3,H8 timeframes (M1,M5,M30,W1 for MT4).

