MACD Divergence Scanner
- Indicadores
-
Reza Aghajanpour
 =============================================================================================
<<<<<< Our team after 19 years of experience in the markets and programming would like to share winner solutions with you. >>>>>> - Versión: 1.11
- Actualizado: 27 febrero 2026
- Activaciones: 20
** Todos los símbolos x Todos los marcos de tiempo escanear con sólo pulsar el botón del escáner **.
Introducción
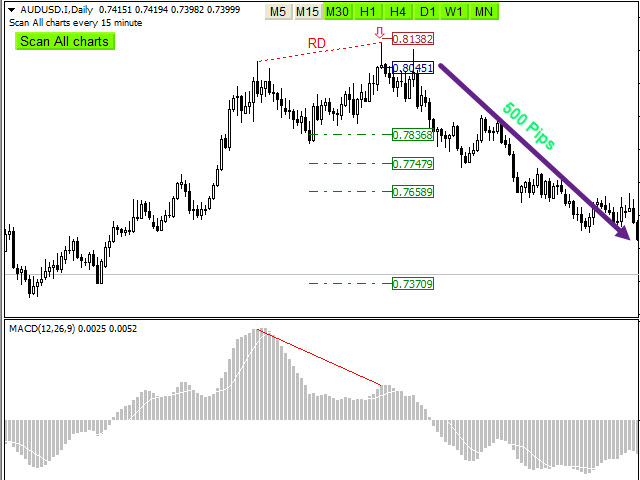
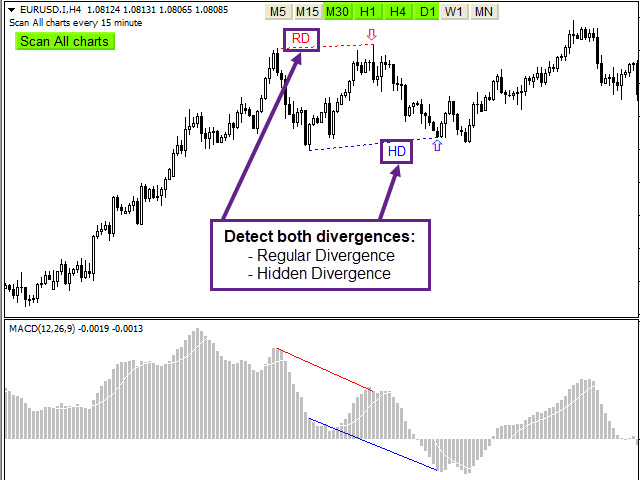
La divergencia MACD es una técnica principal utilizada para determinar la inversión de tendencia cuando es el momento de vender o comprar porque los precios son propensos a caer o recoger en los gráficos. El indicador de Divergencia MACD puede ayudarle a localizar la parte superior e inferior del mercado. Este indicador encuentra divergencia Regular para pullback el mercado y también encuentra MACD Divergencia oculta para mostrar la continuación de la tendencia.
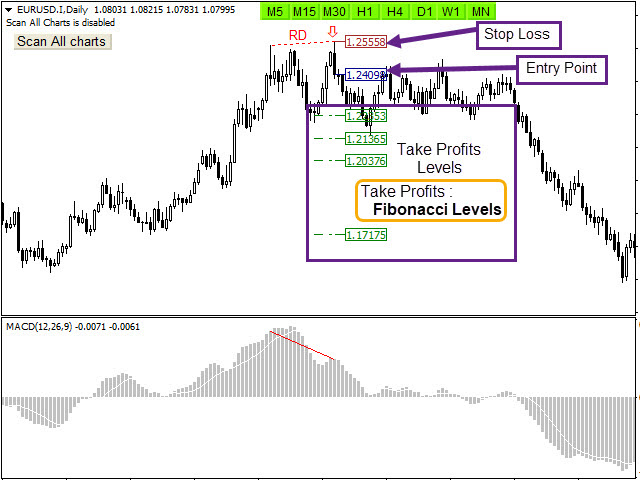
Este indicador muestra la divergencia en el MACD que es un fuerte indicio de un excelente punto de entrada y encuentra inmediatamente con alarma y notificación y también tiene stop loss, take profits y punto de entrada con los niveles de Fibonacci y la comprobación de velas para facilitar el comercio.
Características principales
- Detecta el mejor y más exitoso punto de tendencia o tendencia de reversión
- Indicador fácil de usar
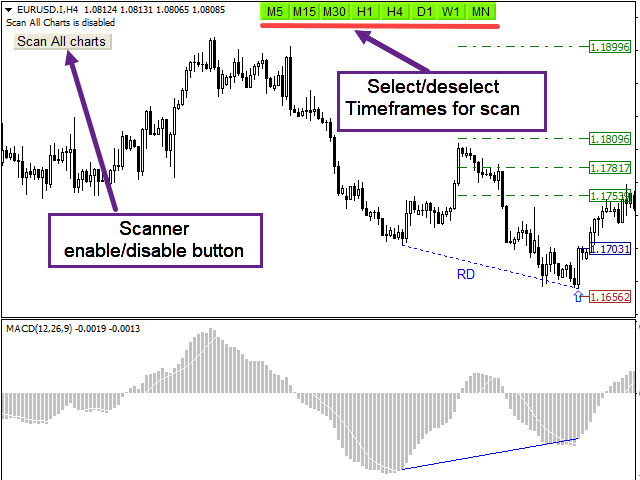
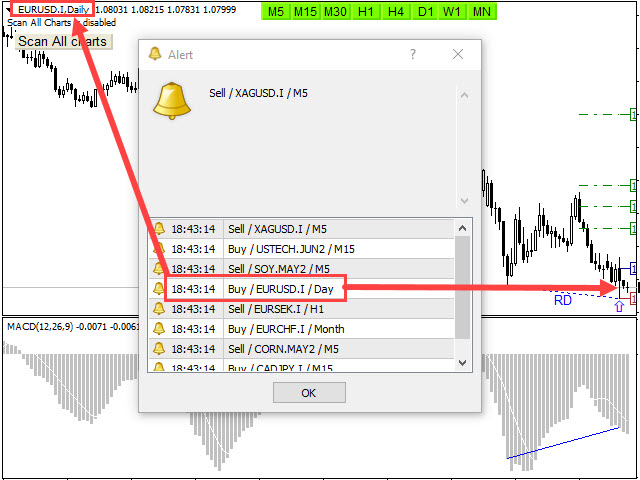
- Botón de escaneo de todos los gráficos (divisas, criptomonedas, índices y materias primas)
- Selecciona y deselecciona marcos de tiempo para escanear (M5,M15,M30,H1,H4,D1,W1,MN)
- Muestra y notifica los niveles de stop-loss, entry-point y take-profit.
- Comprobación de velas para el mejor punto de entrada
- Utiliza los niveles de Fibonacci
- Envío de alertas y notificaciones push
- Activación/desactivación de la alerta en función de la hora configurada
- Ajuste la configuración del patrón
Cómo probar:
Puede encontrar la versión de prueba aquí. Es gratis en los gráficos reales USDCHFyAUDCHF.
Parámetros de entrada
=========Scanner============
- Escanear todos los gráficos - Activar
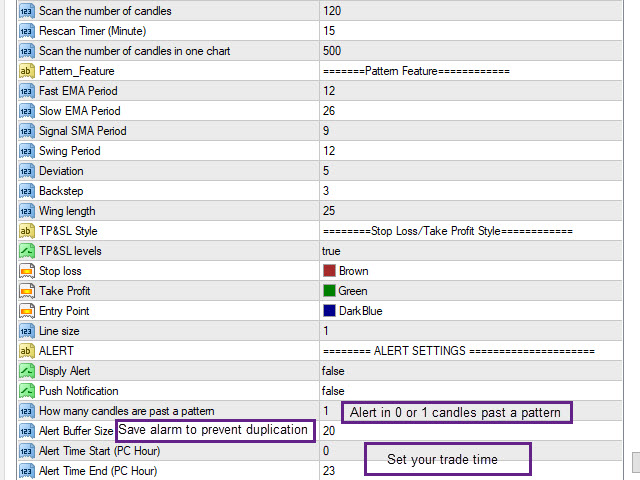
- Escanear el número de velas - Cantidad de barras históricas a evaluar
- Re-scan Timer - Re-escanea todos losgráficos en todos los marcos de tiempo después de pasar el tiempo
=======Pattern Feature============
- Función MACD (Periodo EMA rápido, Periodo EMA lento, Periodo SMA de señal ) - FuncionesMACD
- Pattern Feature(Period, Deviation, Back step, Wing length) - Parámetros del algoritmo para el reconocimiento de patrones
=======Display/style Options============
- Opciones de visualización - Muestra o no los niveles de Take Profit y Stop Loss
- Niveles de Stop Loss/Take Profit y Estilo de Breakout - Configurar las Fuentes y colores de los patrones
========CONFIGURACIÓN DE ALERTAS ==========
- Mostrar Alerta o Notificación Push - Activar o desactivar Alerta o Notificación Push
- Cuántas velas han pasado de un patrón - Número máximo de velas pasadas de un patrón para permitir la alerta
- Tamaño del Buffer de Alerta - Máximo de alertas guardadas para evitar alertas duplicadas
- Hora de inicio/fin de la alerta - Determina las horas de negociación basándose en el reloj del ordenador para activar y desactivar la alarma


I am satisfied with this product,Macd divergence scanner is very Good und usefull indicator ,highly recommend !