Rise Fall ATR MT5
- Indicadores
-
Yu Zhang
 I am a senior practitioner in Fintech industry.
And I have done a lot of academic research on financial markets.
From 2012, I work as a Quant.
Forex, stock and futures are my main trading varieties.
I can use MQL4, MQL5, C++, MySql, and Python. - Versión: 1.0
- Activaciones: 20
1. ¿Qué es esto?
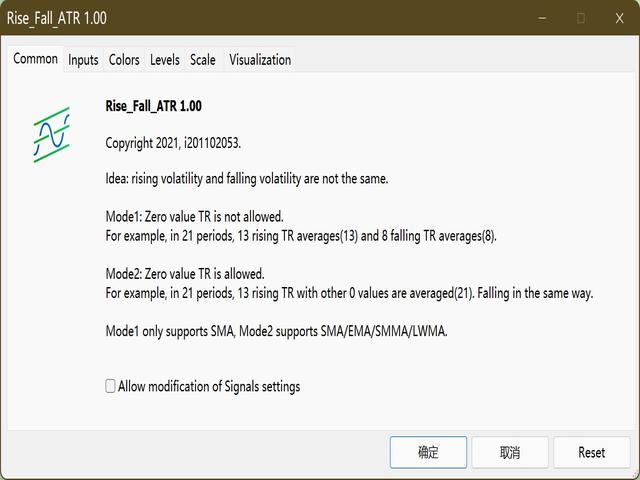
La volatilidad alcista y la volatilidad bajista no son lo mismo, ya sea la investigación académica o las pruebas reales han demostrado este punto.
El indicador ATR original se calcula juntando las fluctuaciones al alza y a la baja. Este indicador es calcular por separado la volatilidad alcista y la volatilidad bajista, lo que puede ayudarle mejor a estudiar el mercado.
2. Descripción del indicador
Hay dos modos para el cálculo de este indicador, como se muestra en la siguiente tabla:
| 0 | 1 | 2 | 3 | 4 | 5 | |
| Dirección | + | - | + | + | - | + |
| TureRange | 15 | 20 | 17 | 5 | 16 | 8 |
| ATR | (15+20+17+5+16+8)/6=13.5 | |||||
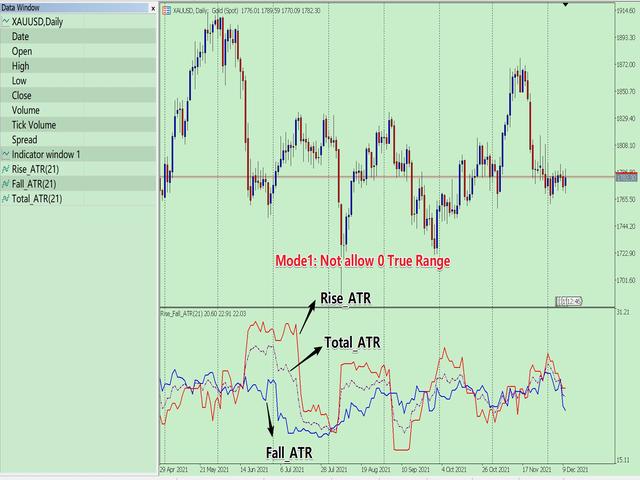
| Modo1 | No rellene la posición con 0, el periodo cambiará | |||||
| Modo1_Rise_TR | 15 | 17 | 5 | 8 | ||
| Modo1_Caída_TR | 20 | 16 | ||||
| Modo1_Rise_ATR | (15+17+5+8)/4=11.25 | |||||
| Modo1_Caída_ATR | (20+16)/2=18 | |||||
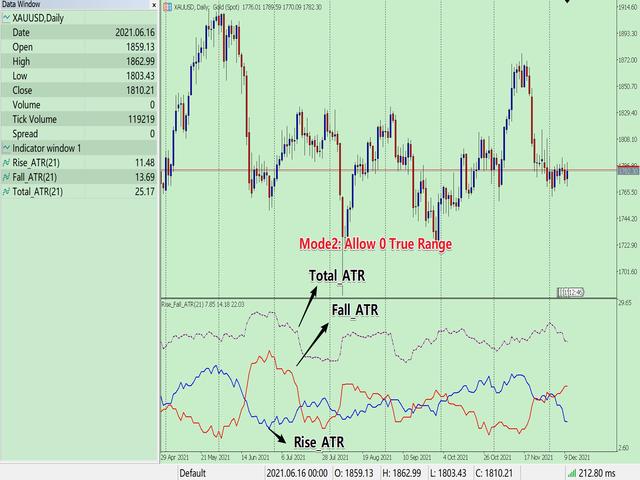
| Modo 2 | Rellena la posición con 0, el periodo no cambia | |||||
| Modo2_Rise_TR | 15 | 0 | 17 | 5 | 0 | 8 |
| Modo2_Caída_TR | 0 | 20 | 0 | 0 | 16 | 0 |
| Modo2_Rise_ATR | (15+0+17+5+0+8)/6=7.5 | |||||
| Modo2_Caída_ATR | (0+20+0+0+16+0)/6=6 | |||||
Como se muestra en la tabla anterior. Por ejemplo, en una secuencia con un periodo de 6, hay 4 subidas y 2 bajadas. El modo 1 no llena la posición con 0, por lo que el período de subidas y bajadas se cambia a 4 y 2 respectivamente. El modo 2 llena la posición con 0, por lo que el periodo de subidas y bajadas sigue siendo el mismo.
El modo 1 sólo utiliza la SMA para calcular el promedio. El modo 2 puede calcularse mediante diversos métodos de promediación, ya que el periodo no varía.
3. Instrucciones de uso
Descripción de parámetros:
- InpAtrPeriod = 21; // Periodo ATR
- InpAllowZeroTR = false; // Si se permite rango verdadero cero.
- InpMAMethod = MODE_SMA; // Si lo anterior es cierto(permitir TR cero), puede elegir el Método ATR.
Hay 3 resultados: Rise_ATR, Fall_ATR, Total_ATR. Entre ellos, Total_ATR es el resultado ATR que no distingue entre subidas y bajadas.
4. Otros
Este indicador tiene versión MT4 y versión MT5
MT4: https: //www.mql5.com/en/market/product/75431
MT5: https: //www.mql5.com/en/market/product/75427