Wave Splash
- Indicadores
- Versión: 1.2
- Actualizado: 16 octubre 2021

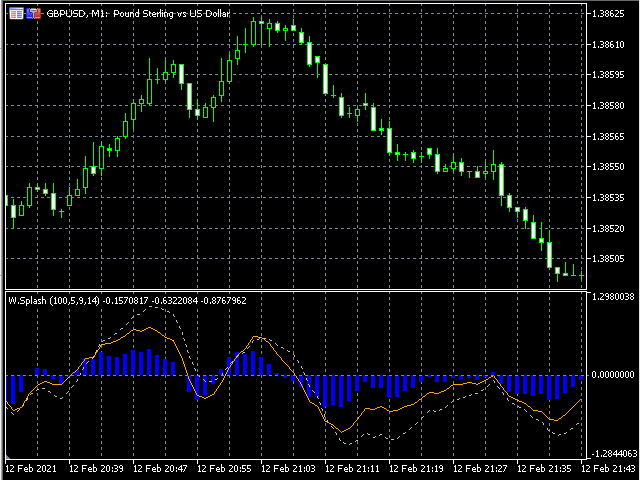
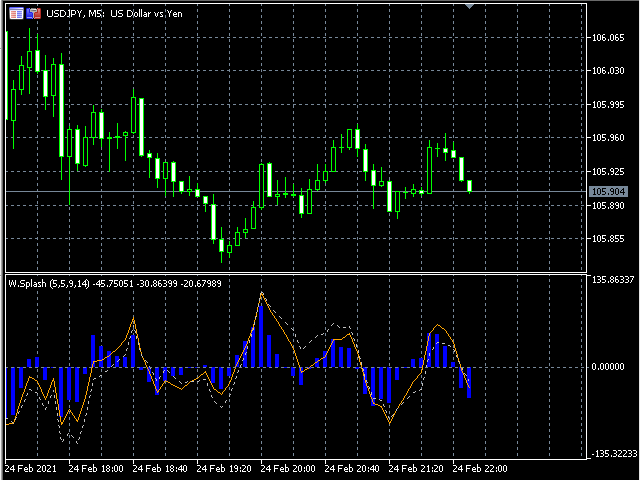
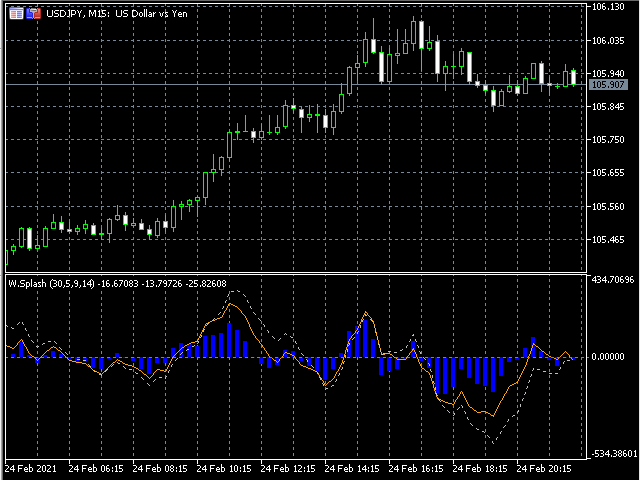
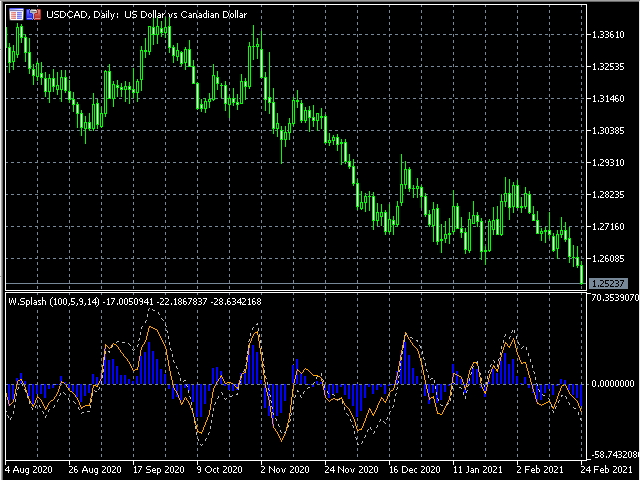
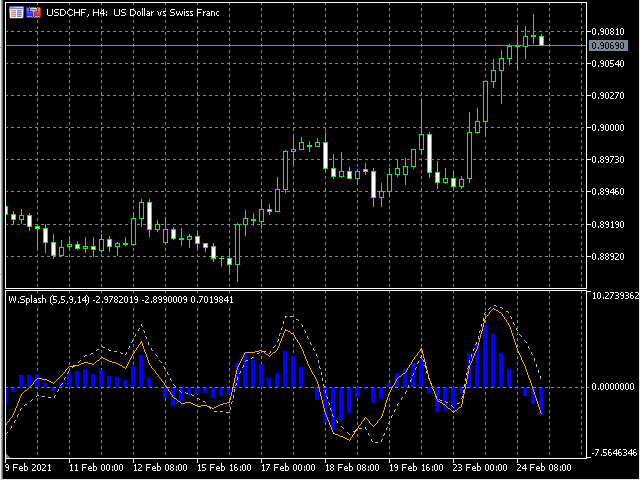
El indicador técnico Wave Splash mide la desviación del precio de un instrumento respecto a los valores medios durante un periodo de tiempo determinado. Forma patrones de divergencia con el gráfico de precios y genera señales adelantadas que permiten detectar a tiempo señales de una próxima corrección en el precio de un instrumento o una inversión con cambio de tendencia incluso en el momento en que el precio actualiza valores extremos. El indicador Wave Splash es efectivo en un mercado activo.
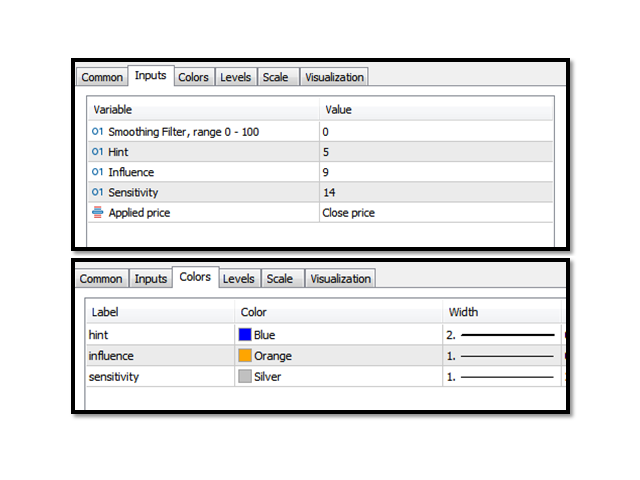
Ajustes:
Filtro de suavizado (por defecto) = 0. Rango de trabajo 0 - 100.
Sugerencia (gráfico de barras) = 5.
Influencia (línea sólida) = 9.
Sensibilidad (línea punteada) = 14.
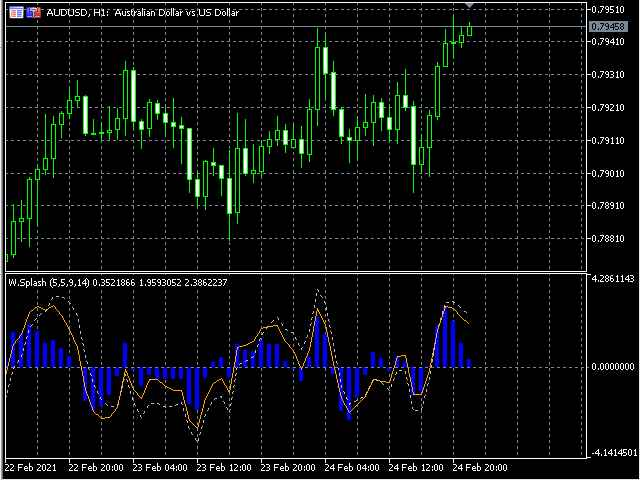
Ps>= Pi+ Ph,
Pi> Ph, donde
Ps - período para la línea de Sensibilidad;
Pi - período para la línea de Influencia;
Ph - período para Hint (gráfico de barras).
Señales:
- divergencia / convergencia;
- cruce de la línea de nivel cero;
- identificación de zonas de sobrecompra / sobreventa;
- posición de las líneas del indicador entre sí.
Además de la función de señal del indicador, es obvio que Wave Splash se utiliza como filtro a la hora de tomar decisiones de trading.
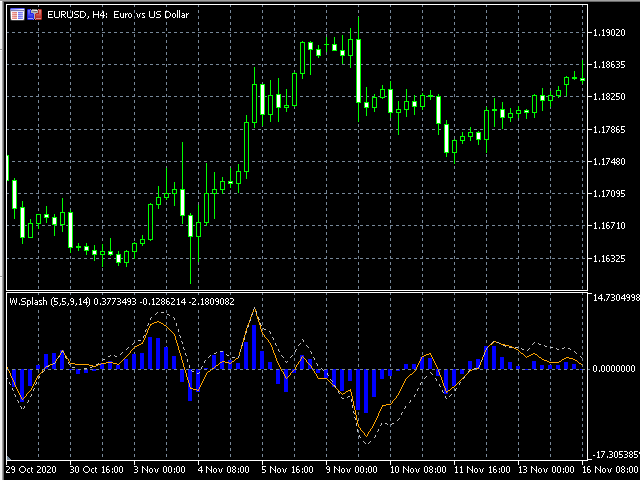
Thank you for your hard work, this indicator provides great confirmation with trade decisions.