Wave Splash
- インディケータ
- バージョン: 1.2
- アップデート済み: 16 10月 2021

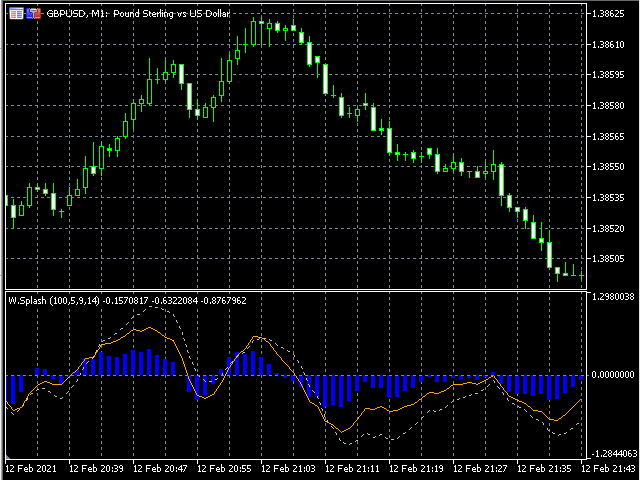
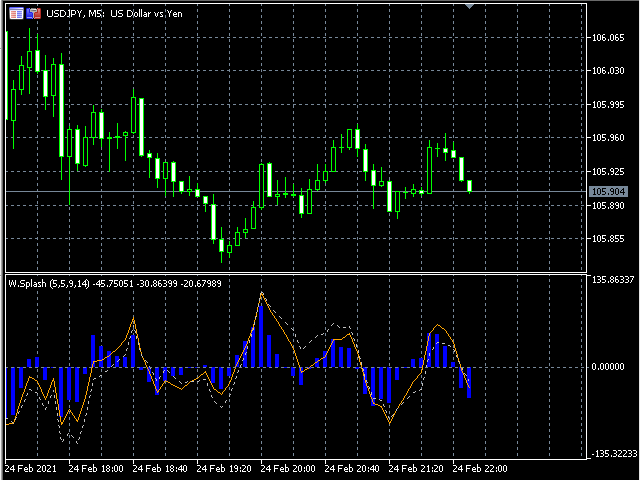
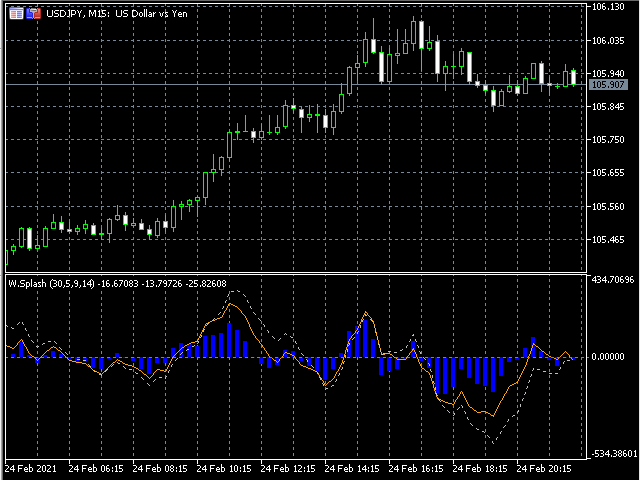
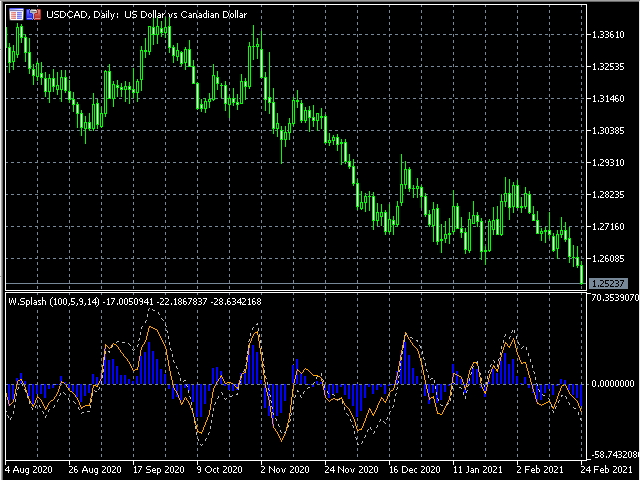
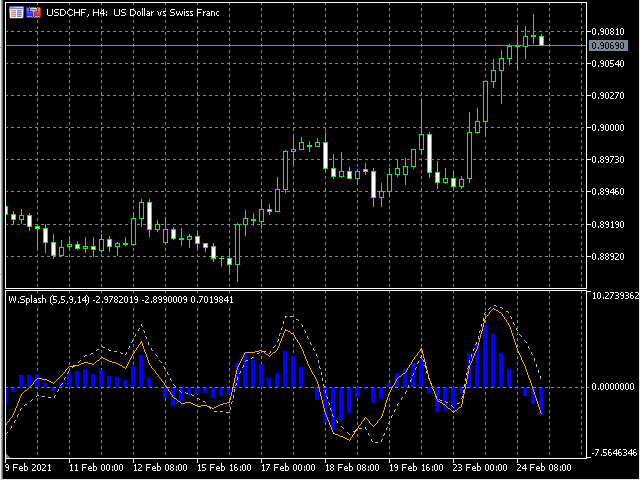
The Wave Splash technical indicator measures the deviation of the price of an instrument from the average values over a specified period of time. It forms divergence patterns with the price chart and generates leading signals that make it possible to timely detect signs of an upcoming correction in the price of an instrument or a reversal with a trend change even at the moment the price updates extreme values. The Wave Splash indicator is effective in an active market.
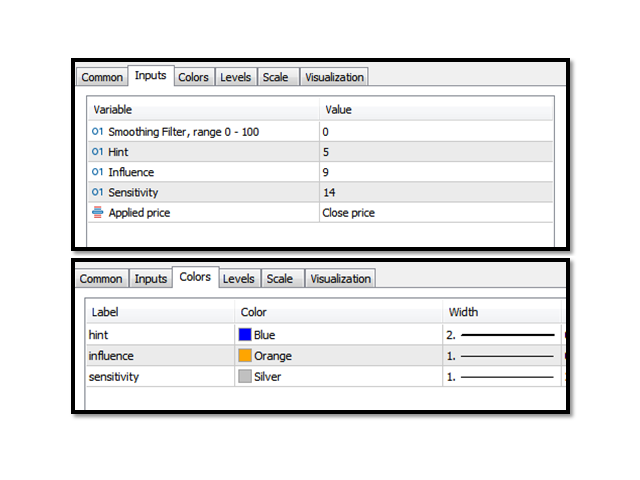
Settings:
Smoothing Filter (default) = 0. Work range 0 - 100.
Hint (bar chart) = 5.
Influence (line solid) = 9.
Sensitivity (line dotted) = 14.
Ps> = Pi + Ph,
Pi> Ph, where
Ps - period for Sensitivity line;
Pi - period for Influence line;
Ph - period for Hint (bar chart).
Signals:
• divergence / convergence;
• crossing the zero level line;
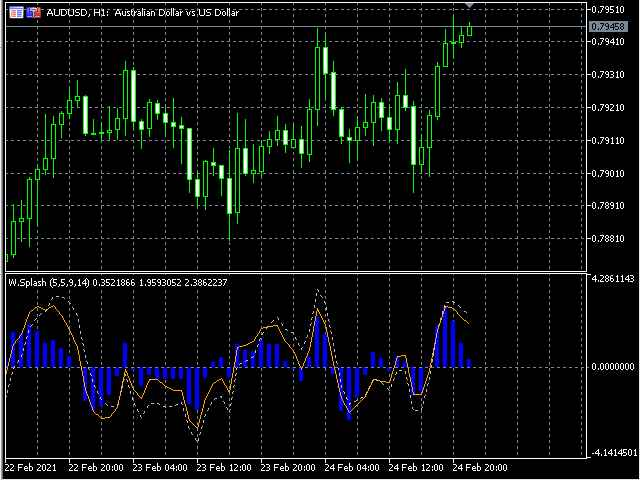
• identification of overbought / oversold zones;
• the position of the indicator lines relative to each other.
In addition to the signal function of the indicator, it is obvious that Wave Splash is used as a filter when making trading decisions.
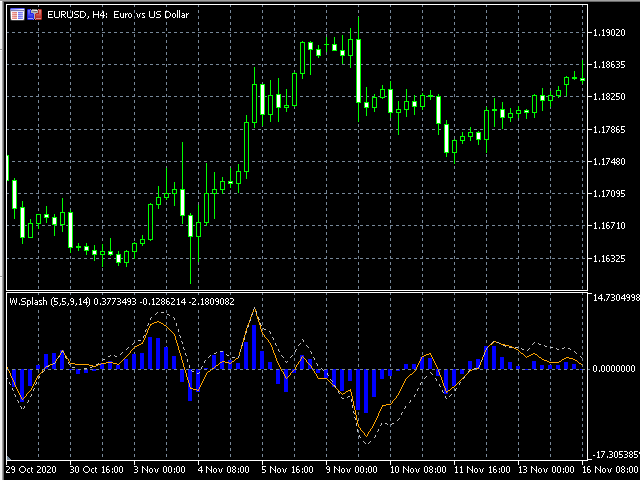
Thank you for your hard work, this indicator provides great confirmation with trade decisions.