Levels ATR
- Indicadores
- Versión: 1.0
- Activaciones: 5

El Indicador de Niveles ATR para MT4 es un indicador creado específicamente para los operadores que utilizan Meta Trader 4 para sus análisis comerciales, gráficos de diferentes pares de divisas y activos comerciales, haciendo sus análisis técnicos y tomando decisiones comerciales durante todo el día de negociación mientras trabajan.
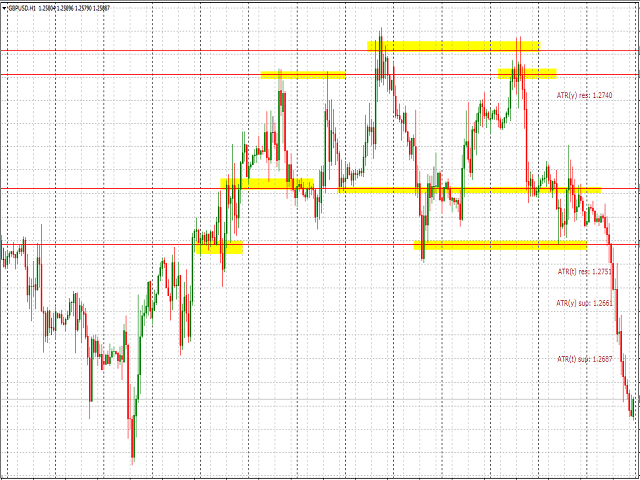
Una de las principales ventajas de utilizar el indicador de niveles ATR para MT4 es que ayuda automáticamente al operador a detectar niveles muy importantes en los mercados basados en el indicador Average True Range.
Esto significa que el operador que utiliza el indicador puede muy fácilmente ser capaz de identificar los principales niveles en el precio donde el mercado tiene el mayor potencial de revertir durante el día de negociación. Estos niveles se trazan para el operador basándose en el rango producido por el precio en dichas zonas del precio.
Esto significa que el precio puede cambiar muy fácilmente su dirección en estos niveles.
Estos niveles se conocen como niveles de soporte y resistencia. Los niveles de soporte son aquellas áreas del precio por debajo del precio donde el mercado ha producido una especie de obstáculo para que el precio rompa por debajo de él.