RSI Scanner With Two Levels
- Indicadores
- Versión: 3.0
- Actualizado: 2 marzo 2021
- Activaciones: 5

Escanee todos sus pares favoritos con RSI y reciba notificaciones en los marcos temporales que prefiera.
Los ajustes son personalizables
Haga clic para cambiar el marco temporal o abrir nuevos pares
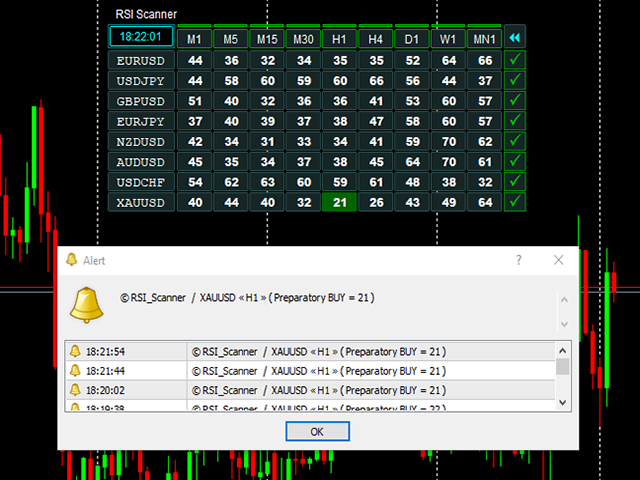
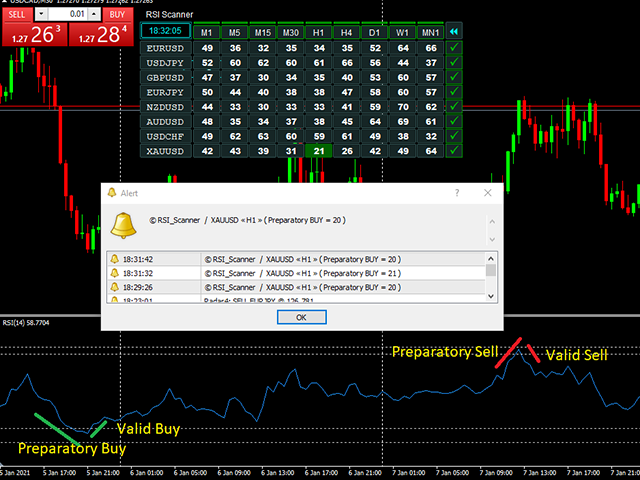
Notificación: Teléfono/Popup/Email
El índice de fuerza relativa (RSI) es un indicador técnico utilizado en el análisis de los mercados financieros. Su objetivo es trazar la fuerza o debilidad actual e histórica de un par/acción basándose en los precios de cierre de un periodo de negociación reciente.
El RSI se suele utilizar en un periodo de 14, medido en una escala de 0 a 100, con los niveles alto y bajo marcados en 70 y 30, respectivamente. Se utilizan plazos cortos o largos para perspectivas alternativamente más cortas o más largas. Los niveles alto y bajo -80 y 20, o 90 y 10- son menos frecuentes, pero indican un impulso más fuerte.
Este escáner le permite establecer dos niveles bajos y dos niveles altos. El escáner también notifica a los operadores cuando se alcanza el nivel establecido. Se envían señales preparatorias de compra/venta y señales válidas de compra/venta
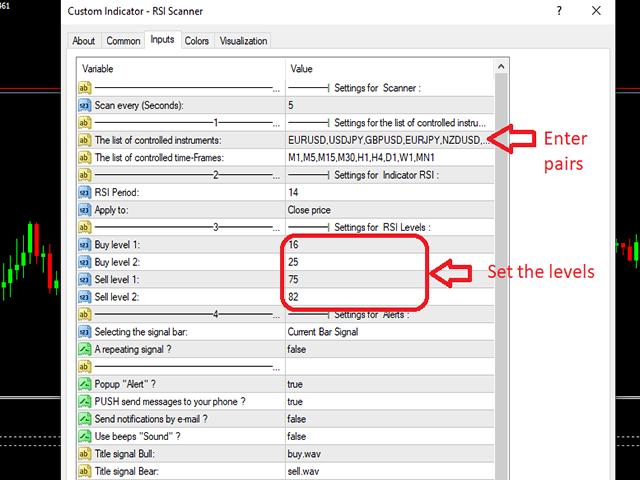
------------------------------------------------- = "--------| Ajustes para el Escáner :";
Escaneo = 5; // Escaneo cada (Segundos):
------------------------1------------------------ = "--------| Ajustes para la lista de instrumentos controlados y time-Frames :";
PairsToTrade = "EURUSD,USDJPY,GBPUSD,EURJPY,NZDUSD,AUDUSD,GBPJPY,USDCHF,XAUUSD"; // La lista de instrumentos controlados:
TimeFrames = "M1,M5,M15,M30,H1,H4,D1,W1,MN1"; // La lista de plazos controlados:
------------------------2------------------------ = "--------| Ajustes para el Indicador RSI :";
RsiPeriod = 14; // Periodo RSI:
RsiPrices = PRICE_CLOSE; // Aplicar a:
-------------------------------- = "--------| Ajustes para Niveles RSI :";
buys_level_1 = 16; // Comprar nivel 1:
buys_level_2 = 25; // Comprar nivel 2:
vender_nivel_1 = 75; // Vender nivel 1:
vender_nivel_2 = 82; // Vender nivel 2:
------------------------4------------------------ = "--------| Configuración de Alertas :";
NumSigBar = curr; // Selección de la barra de señal:
Repeating = false; // ¿Una señal repetitiva?
------------------------------------------ = "";
MostrarAlerta = true; // ¿"Alerta" emergente?
SendPush = true; // Enviar mensajes PUSH al teléfono ?
SendMailInfo = false; // Enviar notificaciones por correo electrónico ?
ShowSound = false; // Usar pitidos "Sonido" ?
SoundNameBull = "comprar.wav"; // Señal de título Toro:

Awesome indicator and great seller. Excellent communication. I recommend A+++.