RSI Scanner With Two Levels
- Indikatoren
- Version: 3.0
- Aktualisiert: 2 März 2021
- Aktivierungen: 5

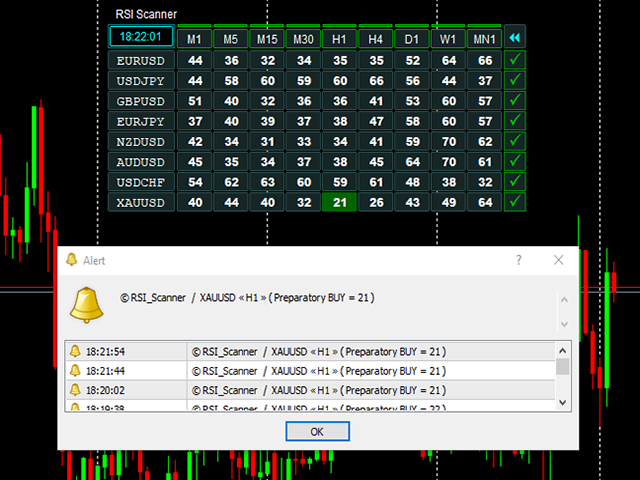
Scannen Sie alle Ihre Lieblingspaare mit RSI und lassen Sie sich zu den von Ihnen bevorzugten Zeitrahmen benachrichtigen.
Die Einstellungen sind anpassbar
Klicken Sie, um den Zeitrahmen zu ändern oder neue Paare zu öffnen
Benachrichtigung: Telefon/Popup/Email
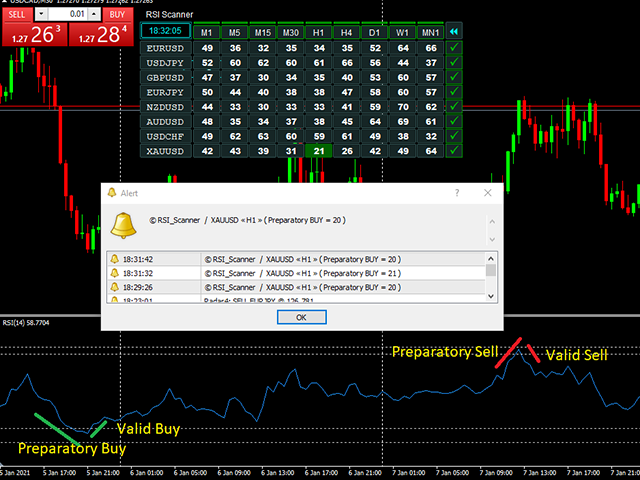
Der Relative-Stärke-Index (RSI) ist ein technischer Indikator, der bei der Analyse der Finanzmärkte verwendet wird. Er dient dazu, die aktuelle und historische Stärke oder Schwäche eines Paares/einer Aktie auf der Grundlage der Schlusskurse des letzten Handelszeitraums darzustellen.
Der RSI wird in der Regel für einen Zeitraum von 14 Tagen verwendet und auf einer Skala von 0 bis 100 gemessen, wobei die Höchst- und Tiefstwerte bei 70 bzw. 30 liegen. Kurze oder längere Zeiträume werden abwechselnd für kürzere oder längere Aussichten verwendet. Hoch- und Tiefstände - 80 und 20 bzw. 90 und 10 - treten seltener auf, zeigen aber eine stärkere Dynamik an.
Mit diesem Scanner können Sie zwei Tiefststände und zwei Höchststände festlegen. Der Scanner benachrichtigt den Händler auch, wenn das eingestellte Niveau erreicht wird. Vorbereitende Kauf-/Verkaufssignale und gültige Kauf-/Verkaufssignale werden gesendet
------------------------------------------------- = "--------| Einstellungen für Scanner :";
Scanning = 5; // Scannen alle (Sekunden):
------------------------1------------------------ = "--------| Einstellungen für die Liste der kontrollierten Instrumente und Zeitrahmen :";
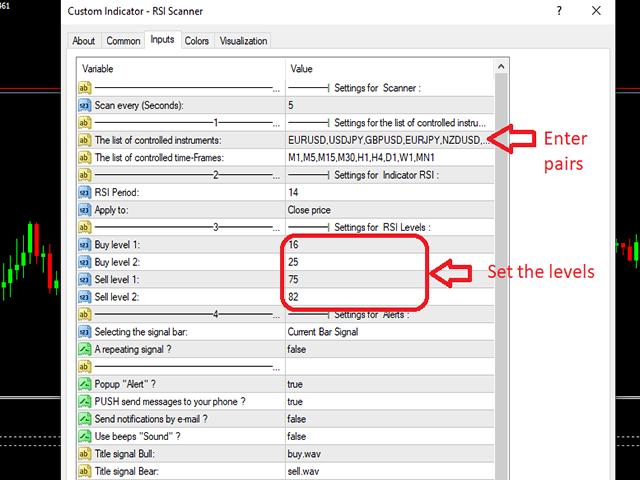
PairsToTrade = "EURUSD,USDJPY,GBPUSD,EURJPY,NZDUSD,AUDUSD,GBPJPY,USDCHF,XAUUSD"; // Die Liste der kontrollierten Instrumente:
TimeFrames = "M1,M5,M15,M30,H1,H4,D1,W1,MN1"; // Die Liste der kontrollierten TimeFrames:
------------------------------------------------ = "--------| Einstellungen für Indikator RSI :";
RsiPeriod = 14; // RSI-Periode:
RsiPrices = PRICE_CLOSE; // Anwenden auf:
------------------------3------------------------ = "--------| Einstellungen für RSI Levels :";
buys_level_1 = 16; // Kaufen Sie Level 1:
buys_level_2 = 25; // Level 2 kaufen:
sell_level_1 = 75; // Sell level 1:
sell_level_2 = 82; // Sell level 2:
------------------------4------------------------ = "--------| Einstellungen für Alerts :";
NumSigBar = curr; // Auswählen des Signalbalkens:
Repeating = false; // Ein sich wiederholendes Signal ?
------------------------------------------ = "";
ShowAlert = true; // Popup "Warnung" ?
SendPush = true; // PUSH sendet Nachrichten an Ihr Telefon ?
SendMailInfo = false; // Benachrichtigungen per E-Mail versenden ?
ShowSound = false; // Signaltöne "Sound" verwenden ?
SoundNameBull = "buy.wav"; // Titelsignal Bull:

Awesome indicator and great seller. Excellent communication. I recommend A+++.