Muvi2A
- Indicadores
-
Mikhail Bilan
 Good afternoon friends! If for some reason you ended up on my profile, then you are in luck) After all, here you will find a good product in the form of an indicator and signals from me.
 - Versión: 1.0
- Activaciones: 5
Lo mismo ocurre con las ventas.
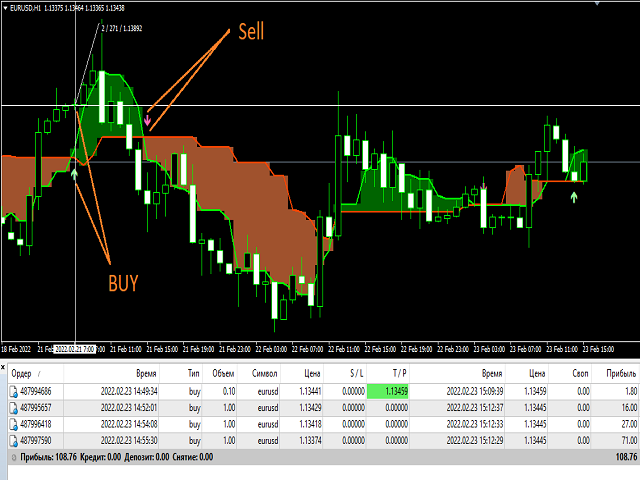
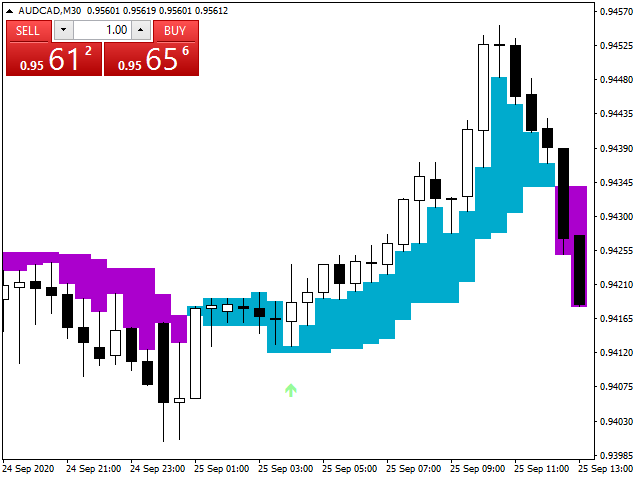
Además, el indicador contiene una señal de compra o venta en forma de flechas.
Indicador de tipo de potencia.
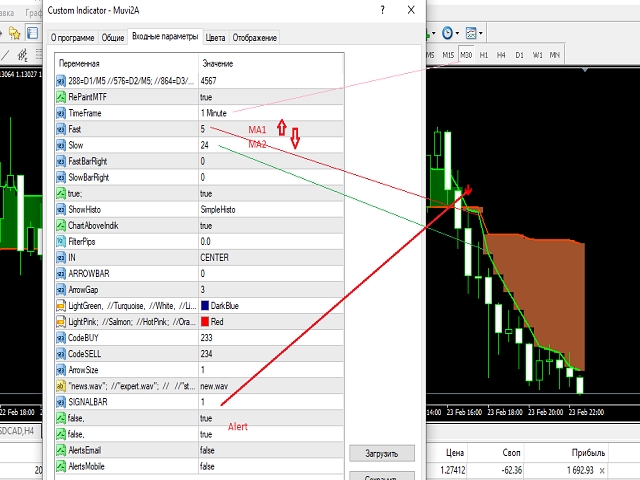
Pruébelo en un probador para asegurarse de que funciona. Es importante seleccionar los ajustes en función de la volatilidad del activo. Bueno para scalping y trading a largo plazo. Muchos ajustes. Lo más interesante es la capacidad de establecer en el indicador para mover en plazos de 1 minuto en los plazos de la carta principal. Las señales se vuelven aún más precisa)
Es muy importante que no haya redibujos de señal. Si la señal era falsa, entonces la orden va a breakeven o drawdown mínimo. Pero la señal posterior resultará en una operación perdedora.
Para todas las preguntas, por favor escriba en mensajes privados en el perfil.
¡Ganancias para todos! :)