Muvi2A

Similarly with sales.

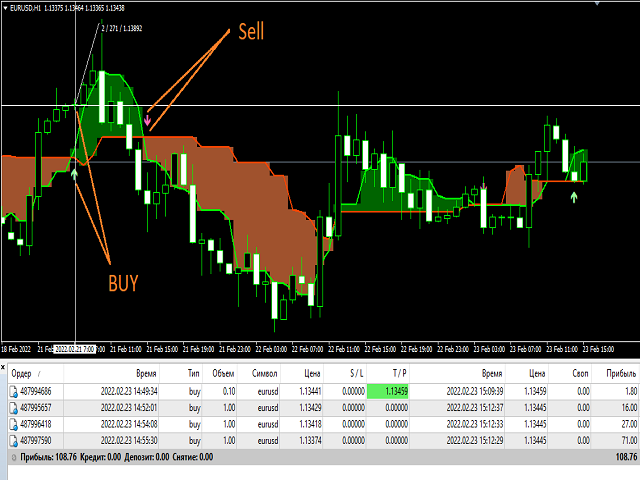
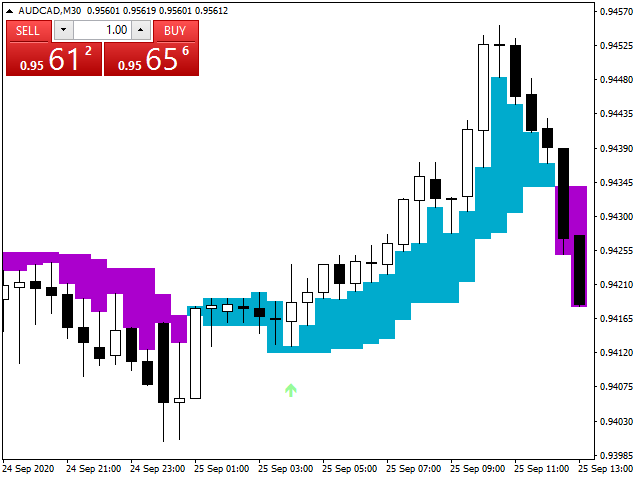
Additionally, the indicator contains a buy or sell signal in the form of arrows. 

Power type indicator. 

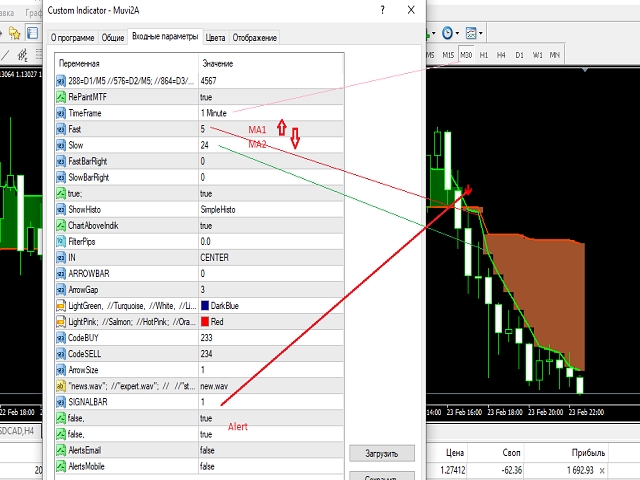
Test it in a tester to make sure that it works. It is important to select settings depending on the volatility of the asset. Good for scalping and long-term trading. Lots of settings. The most interesting thing is the ability to set in the indicator for moving on timeframes from 1 minute on the timeframes of the main chart. The signals become even more accurate)

It is very important that there are no signal redraws. If the signal was false, then the order goes to breakeven or minimum drawdown. But the subsequent signal will work out a losing trade. 

For all questions, please write in private messages in the profile. 

Profit to all! :)
Önerilen ürünler
Proinsta78
Mikhail Bilan
3.5 (4)
Good afternoon friends! At the request of buyers, now when conditions for buying or selling are met, the indicator will send an alert and push notifications. Push notifications come to the phone, provided that you have the MQL application installed. You just need to enter your MetaQuoteID in the application. You can find it in the MT4 platform in the Service - Settings - Notifications section. I showed the conditions for the signal in the form of screenshots in the section screenshots 1-2 phot
This is a professional Trend Sim indicator. The intelligent algorithm of the Trend Sim indicator accurately detects the trend, filters out market noise and generates input signals and exit levels. Functions with advanced statistical calculation rules improve the overall performance of this indicator. The indicator displays signals in a simple and accessible form in the form of arrows (when to buy and when to sell). Knowing the entry point of each of the currencies is very important for every f
Implementation of indication of trend movement with moments for potential stops in the Cloud Power indicator. The transition to the shadow warns of a possible reversal. The entry of the price inside the shadow speaks of a flat movement. The indicator tracks the market trend with unmatched reliability, ignoring sharp market fluctuations and noise around the average price. Simple, visual and efficient use. The indicator does not redraw and does not lag. It can be easily used as an independent t
Features: Sharkfin Alerts Multi-timeframe Multi-currency SM TDI: To show TDI lines with sharkfin levels Zigzag MTF: To see Higher Timeframe trend Detailed blog post and extras: https://www.mql5.com/en/blogs/post/759138 Arrows works on a single timeframe and single currency. But it’s visually helps see that sharkfins. You can also get the simple arrows from mql5 site product: https://www.mql5.com/en/market/product/42405 About Scanner: It is an easy to use simplified scanner. It will show when
The Trend Professor is a moving average based indicator designed for the purpose of helping the community of traders to analyse the price trend. The indicator will be displayed in the main chart as it is indicated on the screenshot section. How it works The indicator has lines of moving averages and colored histograms to depict the direction of the trend. There will be a fast signal line colored blue/yellow/red at some points. The red/yellow colored lines stands for bearish trend/signal while th
Introduction This indicator detects volume spread patterns for buy and sell opportunity. The patterns include demand and supply patterns. You might use each pattern for trading. However, these patterns are best used to detect the demand zone (=accumulation area) and supply zone (=distribution area). Demand pattern indicates generally potential buying opportunity. Supply pattern indicates generally potential selling opportunity. These are the underlying patterns rather than direct price action. T
Vrc Updated
Vimal Chudasama
This is an indicator that has been updated from the previous VRC indicator, which has both buy and sell arrows now, and it is optimised from the previous one. You can try it out, the version is upgraded and might suit your trading style. You can also use this indicator as a confluence, or you can use it as a main signal provider; it can be used along with your strategy or top-down approach analysis. Past performance does not guarantee future performance; kindly do a top-down analysis and keep yo
The MT4 " DayLevelsSignalPro " indicator . Signal Indicator – generates the most accurate buy / sell signals . Noise filtering indicator  – reduces false signals . Signal information with a clear , understandable and visually convenient view . User- friendly graphical interface ( colors , sound notifications , customization options ) . - Generation of a breakdown signal for significant peaks of the Current day . - Generation of a signal for the breakdown of the previous Day 's Level - Generation
HC candlestick pattern is a simple and convenient indicator able to define candle patterns.‌ Candlestick charts are a type of financial chart for tracking the movement of securities. They have their origins in the centuries-old Japanese rice trade and have made their way into modern day price charting. Some investors find them more visually appealing than the standard bar charts and the price action is easier to interpret. Hc candlestick pattern is a special indicator designed to find divergence
IMPORTANT; Price is subject to rise at any time from now! Do not miss this offer! Dear trader I am glad to introduce my new tool called Trend Analyser Dashboard to you. The design, style, and settings of this indicator  have been made simple to make its users not take too much time in understanding the indicator itself.   The purpose is to help traders in analysing the direction of the major trend and the status of the trend whether in weak trend or its strong trend. The indicator will also prov
Introduction to Fractal Pattern Scanner Fractal Indicator refers to the technical indicator that makes use of the fractal geometry found in the financial market. Fractal Pattern Scanner is the advanced Fractal Indicator that brings the latest trading technology after the extensive research and development work in the fractal geometry in the financial market. The most important feature in Fractal Pattern Scanner is the ability to measure the turning point probability as well as the trend probabi
This indicator draws lines at the open, close, high and low price of the last chart candle from the set timeframe. In addition, a label shows whether it was an up or down candle. The standard settings follow the original idea of ​​getting the price data from the daily timeframe for day trading/scalping, but since this indicator is fully customizable, you can also set a different timeframe. Based on the drawn price lines, you can then also display Fibonacci levels. This function can also be
Mega Dashboard MT4
Paul Anscombe
4.71 (7)
The Ultimate Dashboard Save $10 now - normal price $79 Indicators are useful for traders, but when you put them into a dashboard that can scan 28 symbols at once they become even better, and when you can also combine different indicators and timeframes to give you synchronized alerts, then they become awesome. This easy to use dashboard provides you with 23 leading indicators, use them individually or together, to create powerful combination alerts. So when you want to know that RSI is above 2
This indicator shows Linear Regression Line and it's channels which calculated with fibo numbers. You can use this indicator in different timeframes on your chosen timeframe chart. You only need to attach this indicator on the chart twice or more with a different colors to do this.  There are 6 input parameters; period      : you can choose regression timeframe independent of chart timeframe. linewidth : width of line on the chart. bars back regression begin : calculated regression bar count. LR
This indicator is designed to find the difference in RSI price and indicator.  This indicator shows the price and indicator difference on the screen. The user is alerted with the alert sending feature. Our Popular Products Super Oscillator HC Cross Signal Super Cross Trend Strong Trend Super Signal Parameters divergenceDepth -   Depth of 2nd ref. point search RSI_Period -   Second calculation period indAppliedPrice -   Applied price of indicator indMAMethod -   MA calculation method findExtInte
Why the RSI Alert Indicator is Essential for Your Trading Toolkit In the fast-paced world of trading, timely and accurate information is crucial. The RSI Alert Indicator is a powerful tool designed to help you stay ahead of the market by providing real-time alerts when the Relative Strength Index (RSI) reaches critical levels. Whether you're a novice trader or a seasoned professional, this indicator can significantly enhance your trading strategy by pinpointing potential market reversals with
KT Candlestick Patterns Scanner is a Multi-Symbol and Multi-Timeframe scanner that fetches and shows various candlestick patterns on 28 currency pairs and 9 time-frames concurrently . The scanner finds the candlestick patterns by loading the KT Candlestick Patterns indicator as a resource in the background. Features The scanner can find the candlestick patterns on 252* combinations of symbols and time-frames from a single chart. Open the signal's chart loaded with a predefined template with a s
Market Reality
Soghra Dejampisheh
Hello,  As you know more than 90% of people in the financial markets are losers, the most important reason is the lack of a proper fixed system and risk management. I want to introduce you to an indicator that is the result of my 8 years of experience, which shows you the reality of the market. My human dignity does not allow me to guarantee the future, but the table below shows the past statistics of this indicator and its performance which really the market past is the only way to find out the
Linear Trend Predictor - Giriş noktalarını ve yön destek çizgilerini birleştiren bir trend göstergesi. Yüksek/Düşük fiyat kanalını kırma prensibiyle çalışır. Gösterge algoritması piyasa gürültüsünü filtreler, oynaklığı ve piyasa dinamiklerini dikkate alır. Gösterge yetenekleri  Düzeltme yöntemleri kullanılarak piyasa trendi ve ALIM veya SATIŞ emirlerinin açılabileceği giriş noktaları gösterilir.  Herhangi bir zaman dilimindeki grafikleri analiz ederek kısa ve uzun vadeli piyasa hareketlerini
ToolBox 360 is the swiss knife of all indicators. It is full packed with useful tools to help you with your trading. It can be used to find best entry and exit points and help you to decide if you should open a trade or not. It shows market trends, candlestick formations outside / inside bars and you can sett time based allerts. Main features: Time based Fibonacci lines Choose a start and end time and the indicator shows you Fibonacci lines within the selected time range including range high a
Trend Analysis in act
Ihab Mohamed Kamal Fouda
The Trend Analysis Indicator is an innovative tool designed for traders and investors who seek to navigate the complexities of the financial markets with greater precision and insight. This powerful indicator is engineered to adeptly identify whether a market is trending or not, offering users a vital edge in their trading strategy. Key Features: Accurate Trend Detection : The core functionality of the Trend Analysis Indicator lies in its ability to accurately detect market trends. It analyzes p
Multiple RSI indicator works based on the standard RSI indicator. This indicator will display the RSI indicator from different timeframes on one screen. You will see the RSI indicator for all timeframes on one screen. This indicator saves you from constantly changing charts. At the same time you can analyze the operations of other graphs relative to each other. Features This indicator shows the RSI graph of the timeframe you are working on and the upper timeframe graphs. For example, if you run
Grafikleri yapılandıran ve döngüsel fiyat hareketlerini belirleyen teknik bir gösterge. Herhangi bir grafik üzerinde çalışabilirim. Birkaç çeşit bildirim var. Grafiğin kendisinde ek oklar var. Tarihe yeniden bakmadan, mumun kapanışına dair çalışmalar. M5 ve üzeri TF önerilir. Kullanımı ve yapılandırması kolay parametreler. Farklı parametrelere sahip 2 indikatörü kullanırken, bunları diğer indikatörler olmadan da kullanabilirsiniz. 2 giriş parametresi vardır Döngüsellik ve Sinyal Süresi Bu 2 pa
Cycle Sniper
Elmira Memish
4.39 (36)
Please contact us after your purchase and we will send you the complimentary indicators to complete the system Cycle Sniper is not a holy grail but when you use it in a system which is explained in the videos, you will feel the difference. If you are not willing to focus on the charts designed with Cycle Sniper and other free tools we provide, we recommend not buying this indicator. We recommend watching the videos about the indiactor and system before purchasing. Videos, settings  and descri
Trend surfer is indicator based on volume calculation in combination with algorithm that recognize trend changes . For aditional filtering, user can choose from 3 different oscillators, or can use their combination. Basic idea of indicator is to give signal when current volume is above value defined as Volume MA period*Volume MA multiplier, and trend change algorithm detects start of new trend wave. When all conditions are met and new trend wave is detected, indicator plot arrow on chart. Arrows
"Binary Smart Eye" MT4 göstergesi, M1'den W1'e kadar geniş bir zaman diliminde çalışan, hem ikili opsiyon hem de forex piyasaları için ticaret sinyalleri sağlamak üzere tasarlanmıştır. Potansiyel giriş noktalarını belirlemek için trend seviyelerini, akıllı bir hareketli ortalamayı ve optimize edilmiş ticaret dönemlerini birleştiren özel bir strateji kullanır. İşte temel özelliklerinin bir dökümü: Çoklu Zaman Dilimi Analizi: Göstergenin çok yönlülüğü, yatırımcıların M1'de scalping'den W1'de uzun
The Trends Trg indicator determines the prevailing trend. They help to analyze the market at the selected time interval. Easy to set up and works on all pairs and all time frames. Trend indicators make it possible to classify the direction of price movement by determining its strength. Solving this problem helps investors enter the market on time and get a good return. It is extremely important for any trader to correctly determine the direction and strength of the trend movement. Unfortunatel
Ruby Trend
Vitalii Zakharuk
The Ruby Trend indicator calculates the saturation levels of the price chart. A signal to exit the resale area is a buy signal. A signal to exit the overbought area is a signal to sell. Usually you need to set relative values for the overbought and oversold levels Bottom and Top for this indicator. Most often, a good trend is visible visually on the price chart. But an experienced trader must clearly understand the current balance of power in the market before entering. And the indicator will
The indicator scans for stop grabber (special pattern of Joe Dinapoli which gives very high probability buy / sell signals and does not repaint ) signals in multiple timeframes for the all markets filtered and shows the results on Dashboard. Key Features Dashboard can be used for all markets It can scan for stop grabber pattern on MN1, W1, D1, H4, H1, M30, M15 ,M5, M1 timeframes Parameters UseMarketWatch: Set true to copy all symbols available in market watch MarketWatchCount : Set the number
Trading with the Transition to quality indicator is as simple as possible, if a blue arrow appears on the chart pointing up, a buy deal is opened. In the same case, if you see a red arrow pointing down, open a sell order. That is, everything is as simple as possible, positions are closed according to the reverse scheme, that is, as soon as a signal is received to open an order in the opposite direction from your position. For example, you opened a long position (sell), close it when a red arro
Bu ürünün alıcıları ayrıca şunları da satın alıyor
Meravith
Ivan Stefanov
5 (1)
Gösterge, her noktadan hacmi analiz eder ve bu hacim için piyasa tükenme seviyelerini hesaplar. Üç çizgiden oluşur: Boğa hacmi tükenme çizgisi Ayı hacmi tükenme çizgisi Piyasa trendini gösteren bir çizgi. Bu çizgi, piyasanın boğa mı yoksa ayı mı olduğunu yansıtacak şekilde rengini değiştirir. Piyasayı istediğiniz herhangi bir başlangıç noktasından analiz edebilirsiniz. Bir hacim tükenme çizgisine ulaşıldığında, bir sonraki analize başlamak için yeni bir nokta belirleyin. Herhangi bir şeyi analiz
Şu anda %20 İNDİRİMLİ! Herhangi bir Acemi veya Uzman Tüccar için En İyi Çözüm! Bu gösterge paneli yazılımı 28 döviz çifti üzerinde çalışıyor. Ana göstergelerimizden 2'sine (Gelişmiş Para Birimi Gücü 28 ve Gelişmiş Para Birimi Dürtüsü) dayanmaktadır. Tüm Forex piyasasına harika bir genel bakış sağlar. Gelişmiş Para Birimi Gücü değerlerini, para birimi hareket hızını ve tüm (9) zaman dilimlerinde 28 Forex çifti için sinyalleri gösterir. Trendleri ve / veya scalping fırsatlarını belirlemek için
Bu gösterge, pratik ticaret için mükemmel olan otomatik dalga analizine yönelik bir göstergedir! Dava... Not:   Dalga sınıflandırması için Batılı isimleri kullanmaya alışkın değilim. Tang Lun'un (Tang Zhong Shuo Zen) adlandırma kuralının etkisiyle, temel dalgayı   kalem   , ikincil dalga bandını ise   segment   olarak adlandırdım. aynı zamanda segmentin trend yönü vardır. Adlandırma   esas olarak trend segmentidir   (bu adlandırma yöntemi gelecekteki notlarda kullanılacaktır, öncelikle söyleyey
Looking for a powerful yet lightweight swing detector that accurately identifies market structure turning points? Want clear, reliable buy and sell signals that work across any timeframe and any instrument? Buy Sell Arrow MT Swing is built exactly for that — precision swing detection made simple and effective. This indicator identifies Higher Highs (HH) , Higher Lows (HL) , Lower Highs (LH) , and Lower Lows (LL) with remarkable clarity. It is designed to help traders easily visualize market str
Dynamic Forex28 Navigator
Bernhard Schweigert
4.43 (7)
Dynamic Forex28 Navigator - Yeni Nesil Forex Ticaret Aracı. ŞU ANDA %49 İNDİRİM. Dynamic Forex28 Navigator, uzun zamandır popüler olan göstergelerimizin evrimidir ve üçünün gücünü tek bir göstergede birleştirir: Gelişmiş Döviz Gücü28 Göstergesi (695 inceleme) + Gelişmiş Döviz İMPULS ve UYARI (520 inceleme) + CS28 Kombo Sinyalleri (Bonus). Gösterge hakkında ayrıntılar https://www.mql5.com/en/blogs/post/758844 Yeni Nesil Güç Göstergesi Ne Sunuyor?  Orijinallerde sevdiğiniz her şey, şimdi yeni
RelicusRoad Pro
Relicus LLC
4.63 (106)
Ne kadar harika geriye dönük testler, canlı hesap performans kanıtları ve her yerde fantastik istatistikler sunan bir alım satım göstergesi aldınız, ancak onu kullandıktan sonra hesabınızı **patlatmakla mı sonuçlandınız?** Bir sinyale tek başına güvenmemelisiniz, öncelikle neden ortaya çıktığını bilmeniz gerekir ve RelicusRoad Pro bunu en iyi şekilde yapar! Kullanım Kılavuzu + Stratejiler + Eğitim Videoları + VIP Erişimli Özel Grup + Mobil Sürüm Mevcut Piyasaya Bakmanın Yeni Bir Yolu RelicusR
OrderFlow Absorption – MT4 için Profesyonel Delta ve Absorpsiyon Sinyal Göstergesi OrderFlow Absorption ile gerçek emir akışı analizinin gücünü keşfedin – MetaTrader 4 için nihai delta histogramı ve absorpsiyon sinyal göstergesi. Fiyat hareketlerinin arkasında gerçekte neler olduğunu görmek isteyen traderlar için tasarlanan bu araç, piyasayı hareket ettiren gizli alım/satım baskısını ve absorpsiyon olaylarını ortaya çıkarır. Özellikler Delta Histogramı Görselleştirme:   Alım ve satım baskısını a
" Dynamic Scalper System " göstergesi, trend dalgaları içinde işlem yapmak için scalping yöntemi için tasarlanmıştır. Başlıca döviz çiftleri ve altın üzerinde test edilmiştir, diğer işlem araçlarıyla uyumluluğu mümkündür. Ek fiyat hareketi desteğiyle trend boyunca pozisyonların kısa vadeli açılması için sinyaller sağlar. Göstergenin prensibi. Büyük oklar trend yönünü belirler. Küçük oklar şeklinde scalping için sinyaller üreten bir algoritma trend dalgaları içinde çalışır. Kırmızı oklar yüksel
BB Reversal Arrows Teknik Ticaret Sistemi, perakende kararları almak için ters noktaları tahmin etmek için geliştirilmiştir. Mevcut pazar durumu gösterge ile analiz edilir ve çeşitli kriterler için yapılandırılır: ters anlar beklentisi, potansiyel dönüm noktaları, satın alma ve satış sinyalleri. Gösterge fazla bilgi içermez, tüccarların makul kararlar vermesine izin veren görsel anlaşılabilir bir arayüze sahiptir. Tüm oklar mumu kapatıyor gibi görünüyor, yeniden çizim yapmadan, birkaç uyarı tür
NAM Order Blocks
NAM TECH GROUP, CORP.
3.67 (3)
MT4 Multi-timeframe Order Blocks detection indicator. Features - Fully customizable on chart control panel, provides complete interaction. - Hide and show control panel wherever you want. - Detect OBs on multiple timeframes. - Select OBs quantity to display. - Different OBs user interface. - Different filters on OBs. - OB proximity alert. - ADR High and Low lines. - Notification service (Screen alerts | Push notifications). Summary Order block is a market behavior that indicates order collection
The Nihilist 5.0 Indicator includes Forexalien and Nihilist Easy Trend trading strategies and systems. It is composed of an MTF Dashboard where you can analyze the different input possibilities of each strategy at a glance. It has an alert system with different types of configurable filters. You can also configure which TF you want to be notified on your Metatrader 4 platform and Mobile application The indicator has the option to view how could be a TP and SL by using ATR or fixed points, even w
Introducing the Delta Volume Profile Indicator - Unleash the Power of Institutional Precision!  Technical Indicator: Are you ready to trade like the pros? The Delta Volume Profile Indicator is no ordinary tool. It’s a high-precision, cutting-edge indicator that puts the power of institutional-grade trading in your hands. This unique indicator analyses delta volume distribution in real-time, revealing the market's hidden buy/sell imbalances that the biggest financial institutions rely on to antic
The Super Arrow Indicator provides non-repainting buy and sell signals with exceptional accuracy. Key Features No repainting – confirmed signals remain fixed Clear visual arrows: green for buy, red for sell Real-time alerts via pop-up, sound, and optional email Clean chart view with no unnecessary clutter Works on all markets: Forex, gold, oil, indices, crypto Adjustable Parameters TimeFrame Default: "current time frame" Function: Sets the time frame for indicator calculation Options: Can be set
Beast Super Signal
Dustin Vlok
4.73 (89)
Kârlı ticaret fırsatlarını kolaylıkla belirlemenize yardımcı olabilecek güçlü bir forex ticaret göstergesi mi arıyorsunuz? Beast Super Signal'den başka bir yere bakmayın. Bu kullanımı kolay trend tabanlı gösterge, sürekli olarak piyasa koşullarını izleyerek yeni gelişen trendleri araştırır veya mevcut trendlere atlar. Canavar Süper Sinyali, tüm dahili stratejiler birbiriyle uyumlu ve %100 örtüştüğünde bir al ya da sat sinyali vererek ek onay ihtiyacını ortadan kaldırır. Sinyal oku uyarısını aldı
Elliott Wave Trend was designed for the scientific wave counting. This tool focuses to get rid of the vagueness of the classic Elliott Wave Counting using the guideline from the template and pattern approach. In doing so, firstly Elliott Wave Trend offers the template for your wave counting. Secondly, it offers Wave Structural Score to assist to identify accurate wave formation. It offers both impulse wave Structural Score and corrective wave Structure Score. Structural Score is the rating to sh
Öncelikle, bu Ticaret Aracının Non-Repainting, Non-Redrawing ve Non-Lagging Gösterge olduğunu vurgulamakta fayda var, bu da onu profesyonel ticaret için ideal hale getiriyor. Çevrimiçi kurs, kullanıcı kılavuzu ve demo. Akıllı Fiyat Hareketi Kavramları Göstergesi, hem yeni hem de deneyimli tüccarlar için çok güçlü bir araçtır. İleri ticaret fikirlerini, Inner Circle Trader Analizi ve Smart Money Concepts Ticaret Stratejileri gibi 20'den fazla kullanışlı göstergeyi bir araya getirerek bir araya g
Supply and Demand Dashboard PRO
Bernhard Schweigert
4.8 (20)
Şu anda %20 İNDİRİMLİ! Bu gösterge paneli, birden fazla sembol ve 9 zaman dilimine kadar çalışan çok güçlü bir yazılım parçasıdır. Ana göstergemize dayanmaktadır (En iyi yorumlar: Advanced Supply Demand ).     Gösterge paneli harika bir genel bakış sağlar. Gösterir:    Bölge mukavemet derecesi dahil filtrelenmiş Arz ve Talep değerleri, Bölgelere/ve bölgeler içindeki pip mesafeleri, İç içe geçmiş bölgeleri vurgular, Tüm (9) zaman dilimlerinde seçilen semboller için 4 çeşit uyarı verir. Kişisel
Product Description Rtc ML Ai Predictor — Futuristic Intelligence for Real-Time Market Decisions Bring robotic precision to your trading.   Rtc ML Ai Predictor   fuses   Machine Learning   with   SMA-shift dynamics   to forecast short-term momentum and trend inflection points with clarity. The model evaluates multi-factor market structure, assigns a   confidence score   to each signal, and lets you act only when conditions align with your rules. Why traders choose Rtc ML Ai Predictor AI-guided e
ECM Elite Channel is a volatility-based indicator, developed with a specific time algorithm, which consists of finding possible corrections in the market. This indicator shows two outer lines, an inner line (retracement line) and an arrow sign, where the channel theory is to help identify overbought and oversold conditions in the market. The market price will generally fall between the boundaries of the channel. If prices touch or move outside the channel, it's a trading opportunity. The ind
GoldRush Trend Ok Sinyali GoldRush Trend Ok Sinyali göstergesi, XAU/USD'de yüksek hızlı, kısa vadeli scalperlar için özel olarak tasarlanmış hassas, gerçek zamanlı trend analizi sağlar. 1 dakikalık zaman dilimi için özel olarak tasarlanan bu araç, net giriş noktaları için yön okları gösterir ve scalper'ların değişken piyasa koşullarında güvenle hareket etmelerini sağlar. Gösterge, PRIMARY ve SECONDARY uyarı oklarından oluşur. PRIMARY sinyalleri, trend yönündeki değişikliği gösteren Beyaz ve
Algo Trading Indicaor  With this indicator , you’ll have zones and trends that hight probability the price will reverse from it. so will gives you all the help that you need  Why should you join us !?  1-This indicator is logical since it’s working in previous days movement , to predict the future movements. 2-Algo trading indicator will help you to draw trends which is special and are too strong than the basics trend , trends will change with the frame time that you work on . 3-We can use
Ultimate Arrow Indicator - Ticaret Başarınız için Araç! Çok şey vaat eden ama az şey sunan araçlardan bıktınız mı? MT4 için Ultimate Arrow Indicator, ticaretinizi bir sonraki seviyeye taşıyan nihai çözümünüzdür. Bu gösterge, size net, güvenilir ve tavizsiz sinyaller sunmak için cerrahi bir hassasiyetle tasarlanmıştır. İşte bu yüzden Ultimate Arrow Indicator, deneyimli trader'lar ve yeni başlayanlar için ideal bir seçimdir: Olağanüstü Performans - Kanıtlanmış Sonuçlar 1 yıl detaylı geri test: %9
Supreme Commander
Ramon Sobrevals Arce
4.13 (8)
The indicator of the indicators. The Most Powerful Technique to Determine Forex Trend Strength in 2023. We have perfected Supreme Commander that it calculates an average of the selected indicators (up to 16) and the selected timeframe (all) with the result of a single trend that indicates the potential of buying and selling.  It includes the following indicators: Accelerator/Decelerator oscillator Average Directional Movement Index Awesome oscillator; Bulls and Bears  Commodity Channel Index; De
BinaryUniversal is a signal indicator for binary options and Forex. In its work, the indicator uses a complex algorithm for generating signals. Before forming a signal, the indicator analyzes volatility, candlestick patterns, important support and resistance levels. The indicator has the ability to adjust the accuracy of the signals, which makes it possible to apply this indicator for both aggressive and conservative trading. The indicator is set in the usual way, it works on any time period and
Introduction to X3 Chart Pattern Scanner X3 Cherart Pattern Scanner is the non-repainting and non-lagging indicator detecting X3 chart patterns including Harmonic pattern, Elliott Wave pattern, X3 patterns, and Japanese Candlestick patterns. Historical patterns match with signal patterns. Hence, you can readily develop the solid trading strategy in your chart. More importantly, this superb pattern scanner can detect the optimal pattern of its kind. In addition, you can switch on and off individu
"Dragon's Tail" is an integrated trading system, not just an indicator. This system analyzes each candle on a minute-by-minute basis, which is particularly effective in high market volatility conditions. The "Dragon's Tail" system identifies key market moments referred to as "bull and bear battles". Based on these "battles", the system gives trade direction recommendations. In the case of an arrow appearing on the chart, this signals the possibility of opening two trades in the indicated directi
Scientific trade
Aleksey Ivanov
5 (1)
An extremely convenient indicator that truly makes the process of making money on the exchange easy. It is based on the scientifically rigorous theory of the market developed by the author, the beginning of which is presented here .                The full algorithm of this indicator operation is presented in the article .               The indicator calculates the most probable price movement trajectory and displays it on the chart. Based on the predicted price movement trajectory
Super Signal – Skyblade Edition Profesyonel No-Repaint / Gecikmesiz Trend Sinyal Sistemi, Olağanüstü Kazanma Oranı ile | MT4 / MT5 için Temel Özellikler: Super Signal – Skyblade Edition, özellikle trend bazlı işlemler için geliştirilmiş akıllı bir sinyal sistemidir. Yalnızca güçlü, yönlü ve gerçek momentum destekli piyasa hareketlerini tespit etmek amacıyla çok katmanlı bir filtreleme yapısı kullanır. Bu sistem zirve veya dip noktaları tahmin etmeye çalışmaz. Aşağıdaki üç koşul aynı anda karşıl
Hit Rate Top Bottom Signal Hit Rate Top Bottom Signal Hit Rate Top Bottom Signal tamamen yenilikçi bir yaklaşım sunar. Belirli bir TP-SL ve hangi ÇİFTLER/TF'lerde en iyi performansı gösterdiğini önceden değerlendirmek isteyenler için idealdir. Hit Rate Top Bottom Signal stratejisi, her trader ve her tür ticaret için temel bir araçtır çünkü yalnızca yeniden çizim yapmayan kesin sinyaller sağlamakla kalmaz, aynı zamanda her Parite ve TF için başarı oranının ayrıntılı bir kaydını tutar ve önceden t
First time on MetaTrader, introducing IQ Star Lines - an original Vedic Astrology based indicator. IQ Star Lines, an unique astrological indicator purely based on   Vedic astrology   calculations, published for the   first time on Metatrader.  This unique tool plots dynamic planetary grid lines based on real-time stars, constellations, and celestial movements, which allows you to plot the power of the cosmos directly onto your trading charts. This indicator is specifically designed for scalpers
Yazarın diğer ürünleri
DrakonMA
Mikhail Bilan
Moving indicator. It is written so that it doesn't signal when two moving averages cross. Easy to operate.  It performed well on European and Asian currencies. Designed for long-term and medium-term types of trading.  Индикатор мувингов. Написан так что даёт сигнал при пересечении двух скользящих. Прост в управлении.   Хорошо себя показал на европейских и азиатских валютах.  Рассчитан  на долгосрочный тип торговли. 
FREE
Trendbin
Mikhail Bilan
Трендовый индикатор предназначенный для поиска так называемого  разворота цены.  Который точно показывает трейдеру момент разворота цены. Данный индикатор лучше всего подходит для выставления стоп ордеров, а также для установления движения тренда или настроения рынка.Лучше всего работает в момент установления на рынке сильных трендовых направлений движения , которые происходят приблизительно 40% времени.   مؤشر الاتجاه المصمم للبحث عن ما يسمى بالنقاط المحورية ، الذي يبين بدقة للتاجر لحظة الانعكا
FREE
Proinsta78
Mikhail Bilan
3.5 (4)
Good afternoon friends! At the request of buyers, now when conditions for buying or selling are met, the indicator will send an alert and push notifications. Push notifications come to the phone, provided that you have the MQL application installed. You just need to enter your MetaQuoteID in the application. You can find it in the MT4 platform in the Service - Settings - Notifications section. I showed the conditions for the signal in the form of screenshots in the section screenshots 1-2 phot
Easy22
Mikhail Bilan
Данный индикатор Форекс построен на теории оценки силы тренда и расчёта, когда нужно входить в рынок. Как только появляется сигнал захода в рынок над свечёй вырисовуется стрелка которая и показывает дальнейшее направление цены. . Это полноценный индикатор который поможет вам принимать решение о входе в рынок и о позиции которую необходимо занять при открытии ордера. 
TRADING INDICATOR SHOWS AS JUDGING FROM the NAME BEGINNING AND the END of the THREE TRADING SESSIONS in the FOREX market : ASIAN(RED),EUROPEAN (GREEN), AMERICAN (PURPLE) COLOR. This indicator applies a color marking on the chart of any currency pair, in the form of squares. Each square corresponds to the duration of the session and its height corresponds to the trading range. 
Добрый День уважаемые трейдеры!  Вашему вниманию индикатор созданный и работающий на базе трендовика ADX,  для торговли на смене направления движения который учитывает коррекцию и даёт возможность на ней заработать.  Применяю этот индикатор для скальпинга. Рекомендую таймфреймы от 15 ти минутного(М15) до часового (Н1) периодов.  Красный кружок сигнал на продажу- Sell) Зелёный кружок  сигнал на покупку Buy) Чем меньше ваш таймфрейм тем меньше пунктов вы зарабатываете.   Важно выставлять стопы! !В
Good day! To your attention the ForexdivergencePS indicator may not be the newest in the trading strategy The Forex indicator detects and displays descending and ascending divergences on the chart. When a new pattern is formed, a pop-up window is triggered. An arrow is formed on the chart that shows the type of phenomenon and helps to open an order in the optimal direction. Friends of traders rate the effectiveness of the tool as above average. You can change settings, including the sensitiv
Skalping instant indicator. The signal to purchase or sale of the basement in conjunction with the value of the indicator arrow. A strong signal is considered when the arrow and the basement indicator that displays four timeframes coincide in the forecast. This indicator contains many algorithms and tasks that have been reduced to one result, which the Skalping instant indicator gives, namely, informs the trader about the direction of the market. Thus, he gives 1. Scalping signal (Figure 1)
FEATURES OF THE HELPTRADER TO ENTER THE MARKET INDICATOR ! four types of moving averages for building a channel; ! ability to select the width of the flat (Central MA) and the margin for the channel borders; ! four options for the display channel; ! three settings for the appearance of the arrow signal; !customizable notification system. The arrow channel indicator HelpTrader to Enter the Market, due to its variability, can become a fairly effective tool for trading in combination with other in
The Trend Change indicator allows you to use the moving average to indicate to the trader a change in the direction of the trend movement. This is a modified indicator, the advantage of which is the ability to keep up with rapid changes in price dynamics in the presence of excellent SMA smoothing over the period. I recommend the standard indicator settings. Apply on a timeframe not lower than M30 
Характеристики советника Платформа : MetaTrader 4 Версия : 1.0 Обновлён до : 1.1 Валютные пары : USDCHF и прочие инструменты с умеренной волатильностью Таймфрейм : Н1 Тип робота :  сеточник Время работы : не ограничено Принцип торговли Отличие  в том, что здесь лот при построении сетки ордер в( при желании можно не увеличивать) увеличивается не в геометрической, а в арифметической прогрессии. Это снижает нагрузку на депозит и позволяет переживать сильные тренды. В остальном ProPribl стандартный
Indicator without redrawing Divergent MAX The DivirgentMAX indicator is a modification based on the MACD. The tool detects divergence based on OsMA and sends signals to buy or sell (buy|sell), taking into account the type of discrepancies detected. Important!!!! In the DivirgentMAX indicator, the optimal entry points are drawn using arrows in the indicator's basement. Divergence is also displayed graphically. In this modification of the MACD, the lag problem characteristic of its predecessor i
This type of arrow indicator works without redrawing signals. The signal on the indicator is shown as arrows (in the direction of movement). It is very simple and effective to use in the Forex market. Type of trading: "Scalping" It is applicable and performs well in intraday trading, as well as long-term trading.  Сигнал на индикаторе показан в виде стрелок ( по направлению движения). Очень прост и эффективен в применении на рынке Форекс. Вид торговли: " Скальпинг"   Применим и хорошо себя по
The IndicatorPivot indicator is suitable for using forex trading strategies designed for intraday trading. "IndicatorPivot" displays on the price chart of a currency pair the Pivot level (average price for the current day) and the three closest support and resistance levels, calculated based on Fibonacci levels. The "Indicator Pivot" indicator uses Fibonacci levels to solve the problem of building support and resistance levels in Forex trading. This indicator is very easy to understand and to ap
The PatternMMB trading indicator finds the most common candlestick analysis patterns and provides trading recommendations based on them. The PatternMMB trading indicator is designed to search for candlestick patterns on the price chart and issue trading recommendations depending on the nature of the found candlestick pattern. It is also possible to send sound notifications when all or any of the selected patterns appear, with an explanation of the pattern and its interpretation. In addition, th
Script risk management, which calculates for you the potential profit, possible loss, risk percentage, on the entire account and for each instrument. Shows where stop-losses and take-profits are not set. Each line summarizes the number of open transactions for a specific instrument and calculates the percentage of loss from the total deposit. Beyond the line, the final calculation of the balance is summarized, if all transactions are triggered by stop loss; Potential loss, as the sum of all st
FREE
Multi Information Panel designed to give alot more precision to both trade entries and exits and provide an instant snapshot of a currency pair’s movement. Multi Information Panel works on any currency or timeframe (or it should) and displays the following in the bottom right corner of the chart.. A graph of Stochastic Oscillators on timeframes M1 up to D1. An indication of the market trend using EMA’s on timeframes M1 to D1. The direction of the MACD on the current chart, and crossing of the
Volume solution
Mikhail Bilan
5 (1)
Volume, momentum, and market strength are key indications that price is about to move in a certain direction. The Volume-solution indicator is one indicator which can help traders objectively classify a momentum type of trade setup as one having volume and strength or not. What is the Volume-solution Indicator? The Trading Volume indicator is a custom technical indicator which works somewhat like a market sentiment indicator. It indicates the strength of the bulls and the bears of the market. Wh
Good afternoon trader! A little about the advisor           ProInsta78AUTO. The         the EA has passed many tests on different time periods, different trading instruments.       And showed a confident and persistent indicator of       making successful deals.     This Expert Advisor is written on the basis of its own         indicator         Proinsta   78, which         perhaps you, as a trader, used to trade earlier. You will see the results of this work in the form of reports from the str
Description of ZiqScalping The ZiqScalping indicator is designed to trade both currencies with high volatility and trend-oriented currencies. Recommended time frame for scalping: М5, М15, М30. Recommended timeframe for intraday trading and above: H1, D1. Works on all pairs! Settings : See screenshots. Decision principle! The indicator is based on 2MA, MACDI,OSMA. Arrows with trend directions and 2MA lines are shown graphically. Calculations of volumes by positions are entered into the fo
Индикатор RSI MT5 - это индикатор Metatrader 5, и суть этого технического индикатора заключается в преобразовании накопленных исторических данных на основе индикатора RSI. Сигналы показаны разными цветами свечей. Смотрите настройки, тестируёте. Это очень полезный индикатор и он точно должен быть у вас . The RSI in candlelight MT5 indicator is a Metatrader 5 indicator, and the essence of this technical indicator is to transform the accumulated historical data based on the RSI indicator. Signals a
Описание индикатора будет крайне коротким. Индикатор Коридор тренда показывает трейдерам зону в которой находится валюта и даёт понимание по какому тренду движется рынок. Визуально очень хорошо воспринимается. Уровни взяты и просчитаны не просто. Полезный индикатор для арсенала индикаторов трейдера. The description of the indicator will be extremely short. The Trend Corridor indicator shows traders the zone in which the currency is located and gives an understanding of which trend the market is
This indicator uses a mathematical calculation algorithm . This algorithm calculates the remainder between the updated model and the actual values and produces the possible progress of the graph on the graph. It is not a super prophet in trading, but it is very good for the trader when entering the market and to analyze it before entering. Applicable for all currencies. Данный индикатор использует алгоритм математических вычислений . Данный алгоритм вычисляет остаток между обновленной моделью и
About the Proinsta78MT5 Indicator The dots show a strong direction of movement, if there are no dots, then the movement changes or there will be a trading corridor with an exit. The profit depends on the timeframe, the larger it is, the more you can earn on the movement. I close on average after every 150-200 points. I have shown the conditions for the signal in the form of screenshots in the screenshots 1-2photo section. Also in the third photo, the signals are visible and marked on the grap
Filtrele:
İnceleme yok
İncelemeye yanıt