Ajuste Diario Dolar e Indice
- Indicadores
- Versión: 1.1
- Actualizado: 30 septiembre 2020

Este indicador trazará dos líneas para representar el valor del ajuste, que puede utilizarse tanto en el Dólar como en el Índice.
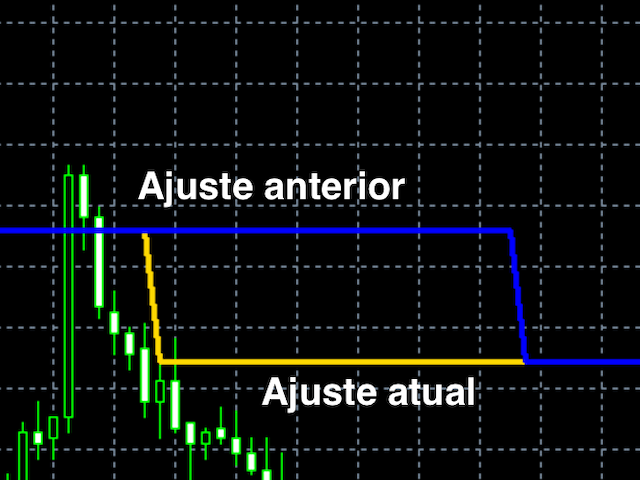
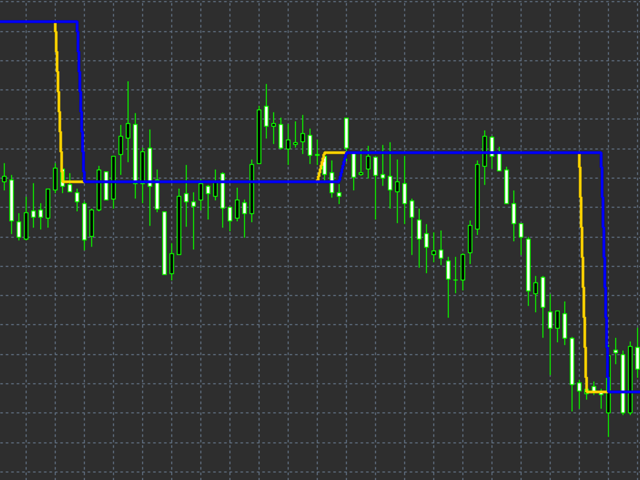
La principal ventaja de este indicador es que tiene dos líneas, una que representa el ajuste calculado a partir del día anterior y la otra que representa el ajuste calculado en el día actual. El cálculo del ajuste en el día actual es un gran diferencial, ya que será posible realizar operaciones para dormir comprado o vendido de acuerdo con el ajuste.
Não é necessário acesso externo, todo o cálculo é feito de acordo com as informações do próprio MetaTrader.
Fórmula para calcular el ajuste:
Según B3, para calcular el precio de ajuste basta con calcular una media ponderada (precio y volumen) de todas las operaciones realizadas durante el periodo según el activo.
_____________________________
La línea para el día en curso, comienza con el mismo valor que el día anterior, y recibirá el nuevo valor de ajuste justo después de la hora de ajuste.
Hora de cálculo del ajuste:
Dólar: 15:50 a 16:00
Índice: 17:00 a 17:15
______________________________
Este indicador sólo funciona con activos:
Dólar: DOL y WDO
Índice: IND y WIN
Dado que el cálculo del ajuste siempre se realiza sobre el activo completo, esto significa que incluso si está utilizando un mini contrato, el cálculo se basará en el contrato completo.
Si tiene alguna sugerencia sólo tiene que hacer un comentario.
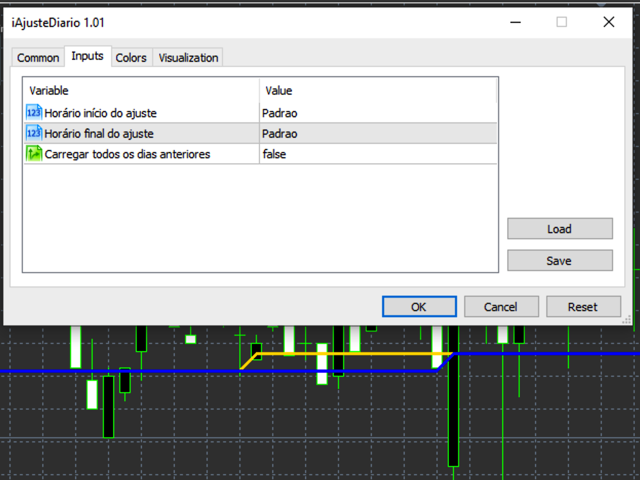


A maioria dos dias funciona, as vezes não: dá uma mensagem dizendo que não encontrou algo, mas daí carrego de novo e funciona. Pra mim está muito bom assim mesmo.