BeST Swing Strategy
- Indicadores
- Versión: 1.10
- Actualizado: 1 julio 2022
- Activaciones: 10

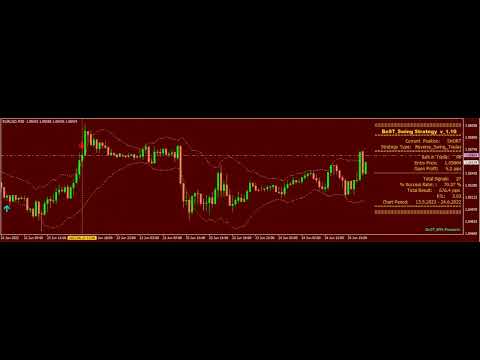
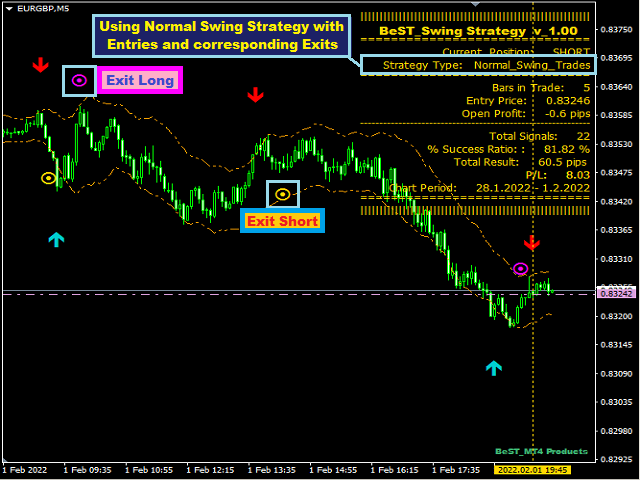
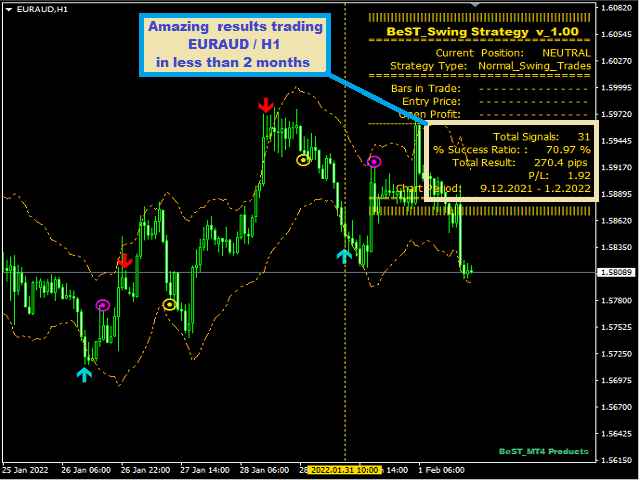
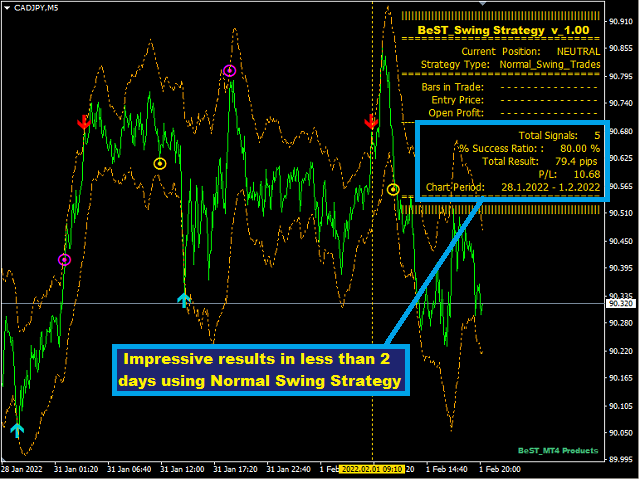
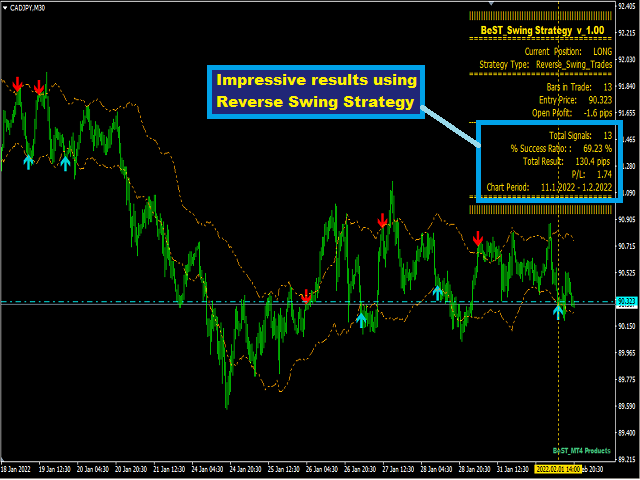
BeST Swing Strategy es un indicador de Metatrader basado en el trabajo de Jim Berg sobre volatilidad descrito en su artículo "The Truth About Volatility" (TASC 2/2005). El indicador consiste en 2 líneas de canal derivadas como (MA +/- veces el ATR) y puede ser usado como un sistema de trading independiente. Los precios atípicos del Mercado a partir de los valores del indicador pueden ser usados para producir Señales de Entrada y Salida.
Ventajas del indicador
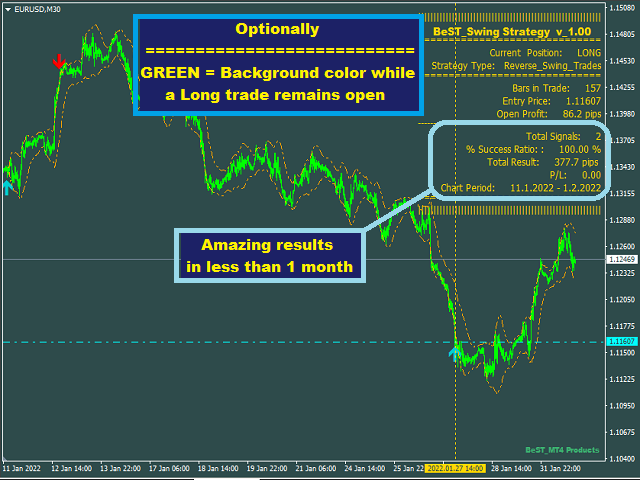
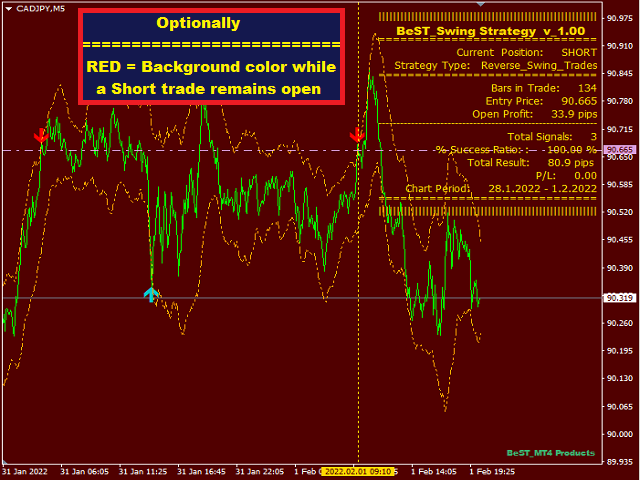
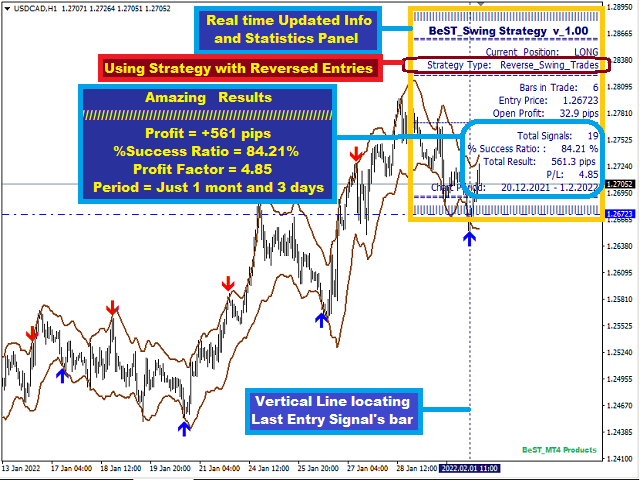
== Utiliza 2 Estrategias Swing (Normal e Inversa)
== Nunca repinta sus Señales
== Todas las Señales son siempre al "Cierre de la BARRA"
== Panel de Información y Estadísticas actualizado en tiempo real
== Viene con todos los temas de Alerta de MT4 (alerta sonora,email y notificación push
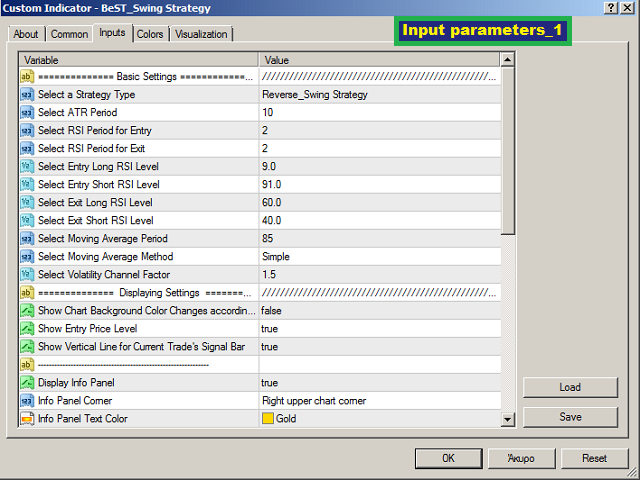
Parámetros de entrada
== Parámetros Básicos - para seleccionar los parámetros para calcular todas las características del indicador
== Parámetros de Visualización - para seleccionar que objetos del gráfico y características mostrar/activar
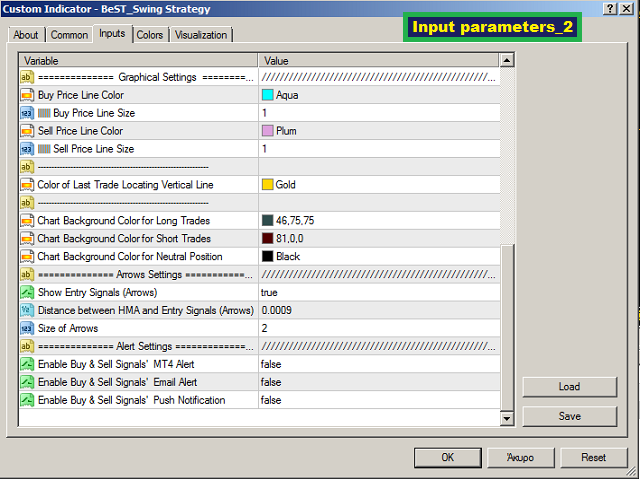
== Parámetros Gráficos - para seleccionar el color, tamaño y distancia de los objetos dibujados
== Parámetros de Flechas - para controlar las características de las Señales de Entrada y Salida
== Parámetros de Alerta - para controlar el uso de las Alertas de Entrada y Salida
Para desarrolladores de EAs
==Flecha de Compra y Flecha de Venta:Buffers = 3,4
== Salida Larga y Salida Corta: Buffers = 5,6