BeST Hull MAs Directional Strategy
- Indicadores
- Versión: 1.55
- Actualizado: 20 agosto 2022
- Activaciones: 10

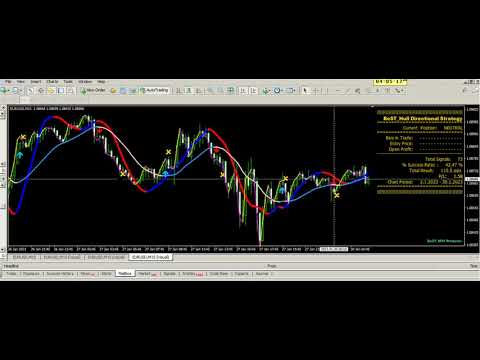
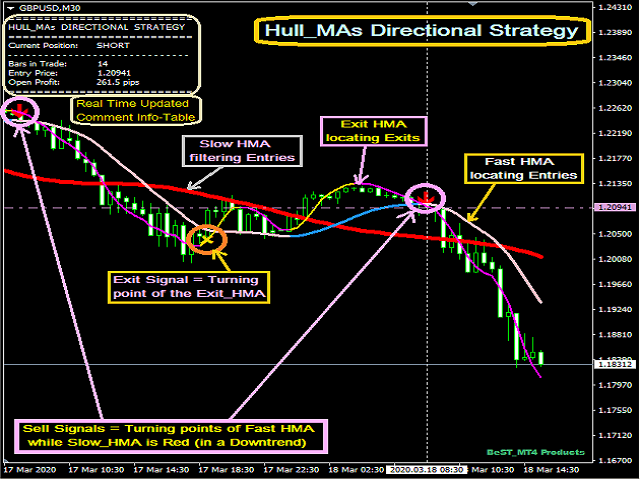
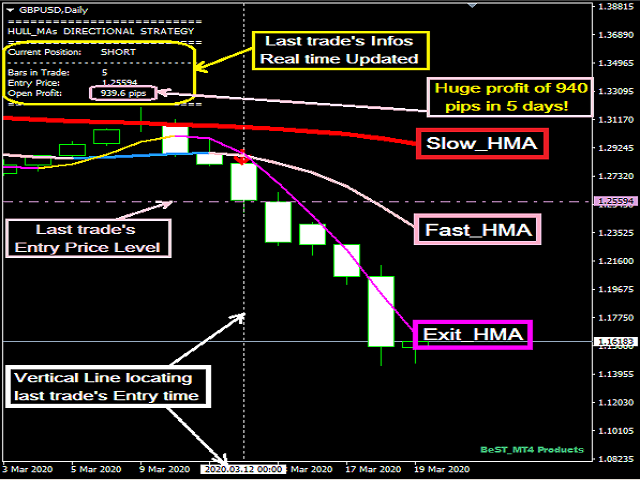
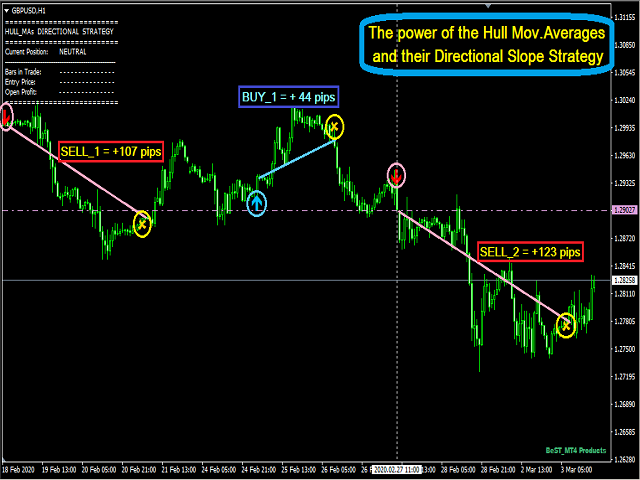
BeST_Hull MAs Directional Strategy es un indicador de Metatrader basado en la correspondiente Media Móvil Hull, que localiza oportunamente los puntos más probables para entrar en el mercado, así como los puntos de salida más adecuados, y puede utilizarse como un sistema de negociación independiente o como un complemento a cualquier sistema de negociación para encontrar/confirmar los puntos de entrada o salida más apropiados. Este indicador utiliza sólo la pendiente direccional y sus puntos de inflexión de Hull MAs para localizar los puntos de Entrada/Salida, mientras que también filtra las Entradas utilizando un Hull MA de Mayor LB_Period.
Consta de 3 Hull MAs (HMAs)
- Slow_HMA que funciona como filtro de Entrada
- Fast_HMA para localizar sus puntos de giro como puntos de Entrada
- Exit_HMA para localizar sus puntos de giro como las salidas correspondientes.
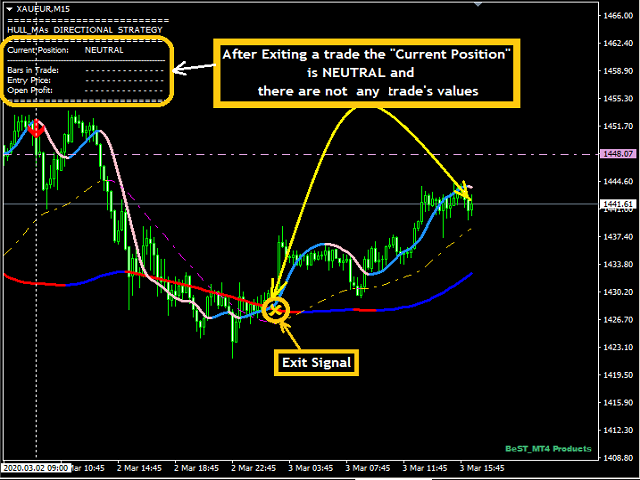
El indicador viene con un nuevo panel de información y estadísticas actualizado en tiempo real que puede mejorar su rendimiento general.
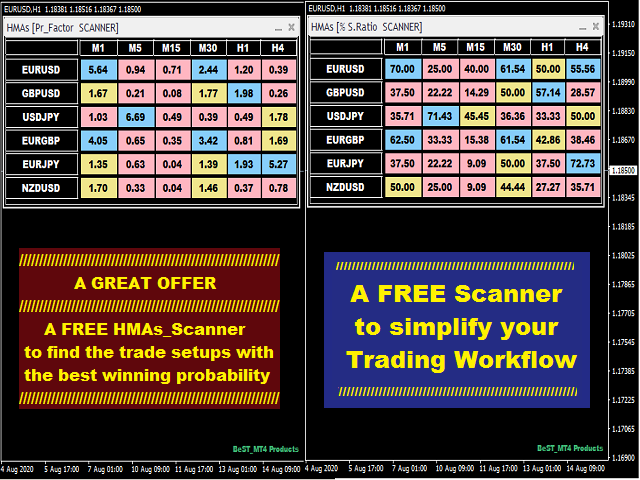
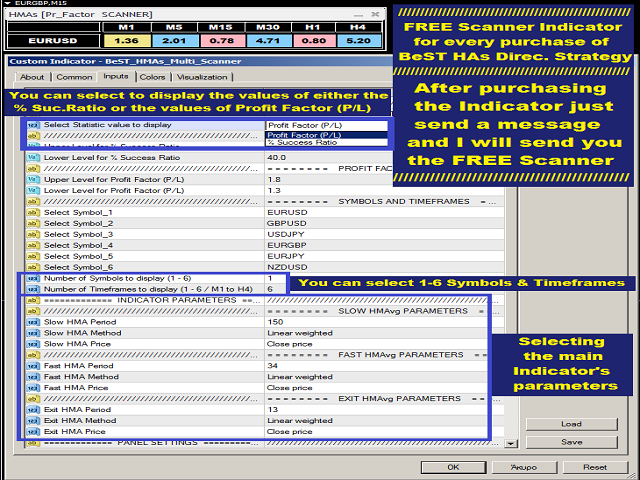
Usted puede maximizar su potencialidad mediante el uso de nuestra oferta gratuita para todos los que compró el producto que es un muy útil Indicador Multi-Escáner mostrando
% Ratio de Éxito y Factor de Beneficio (P/L) para encontrar las configuraciones de trading más prometedoras (Símbolos y Plazos).
El indicador de estrategia direccional BeST_Hull MAs:
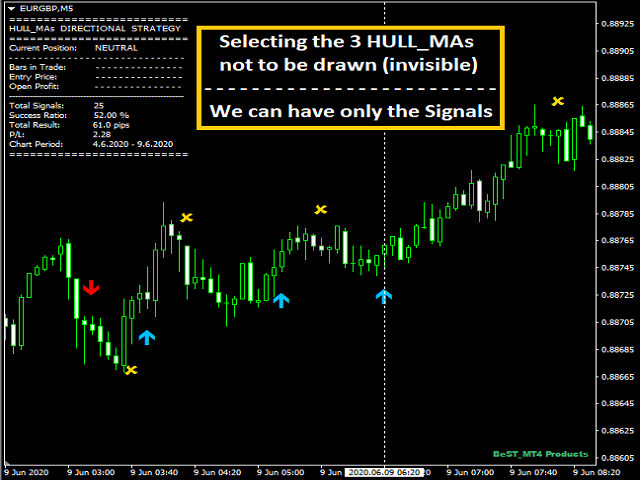
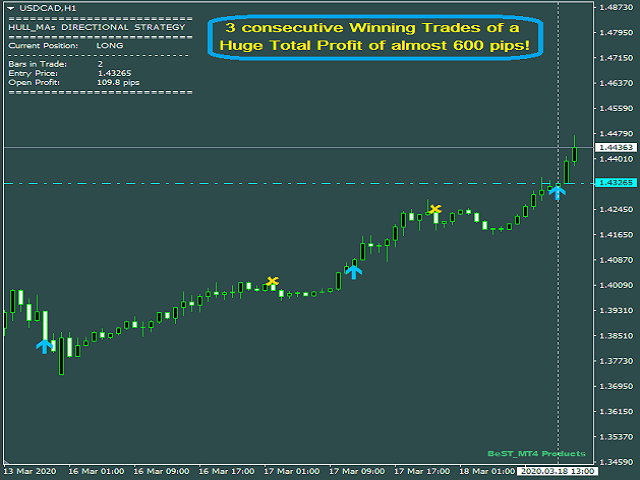
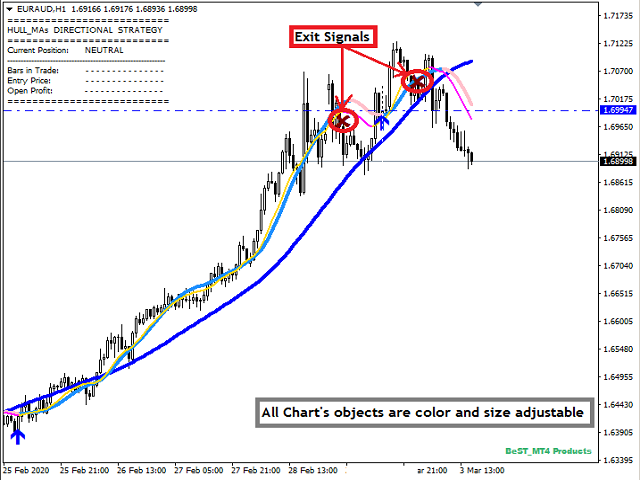
- Dibuja Flechas de Entrada Compra/Venta y Señales de Salida definidas.
- Dibuja siempre después del cierre de la barra, por lo que no repinta ni retropinta.
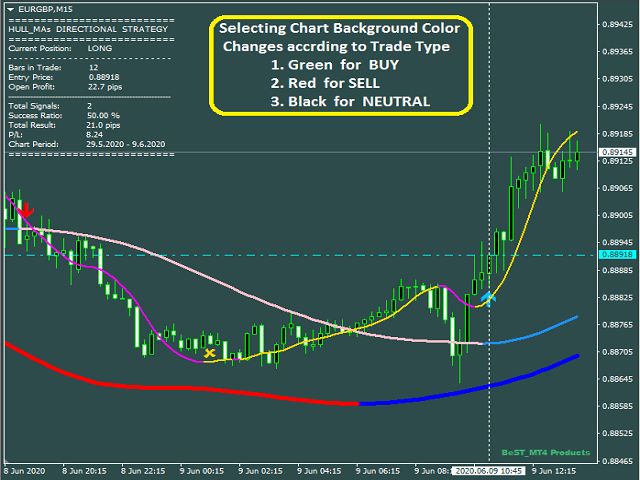
- Muestra un panel de información y estadísticas actualizado en tiempo real
- Funciona con todos los símbolos y marcos temporales
- Tiene colores, tamaños y distancias de todos los objetos gráficos totalmente personalizables
- Viene con sonido de alerta Metatrader, correo electrónico y notificación push
- Coopera con el desarrollo de Asesores Expertos
Entradas
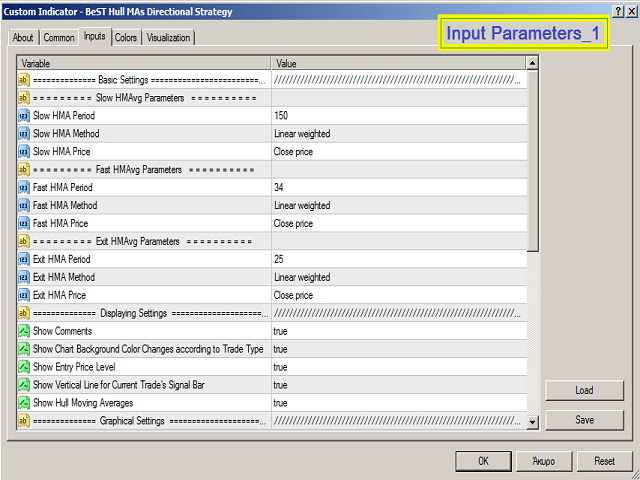
Configuración Básica
- Parámetros Slow_HMAvg - Periodo, Método y Precio
- Fast_HMAvg Parámetros - Periodo, Método y Precio
- Parámetros Exit_HMAvg- Periodo, Método y Precio
Nota: Es factibleutilizar el Fast_HMAvgy sus puntos de giro para localizar los puntos de Salida si utilizamos los valores de sus parámetros como entradas para el Exit_HMAvg.
Ajustes de visualización - para seleccionar qué objetos y características del gráfico mostrar/activar
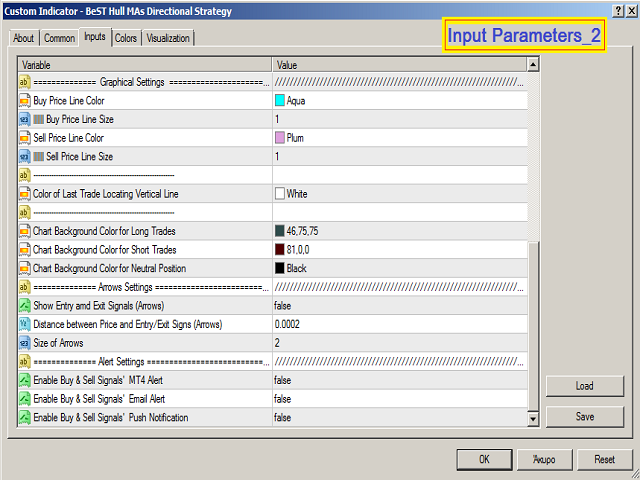
Ajustes Gráficos - para seleccionar el color, tamaño y distancias de los objetos dibujados
Configuración de Flechas - para controlar las características de las flechas de Entrada/Salida
Configuración de Alertas - para controlar el uso de las alertas MT4 de los puntos de Entrada y Salida
Para desarrolladores de EA
- Flechas de Compra: Buffer = 2
- Flechas de Venta: Buffer = 3
- Señales de Salida: Buffer = 4


This indicator is exactly what I need. It saves me time and works efficiently. Eleni also gave great support. Thank you