• Información general
  • Comentarios (7)
  • Discusión (22)

Bermaui RSI Candles

5

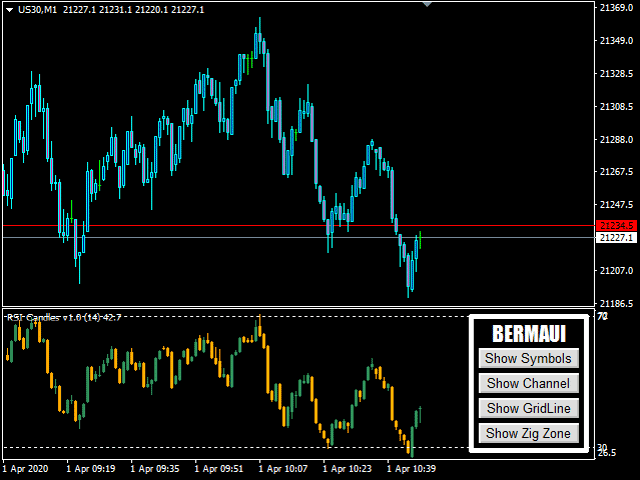
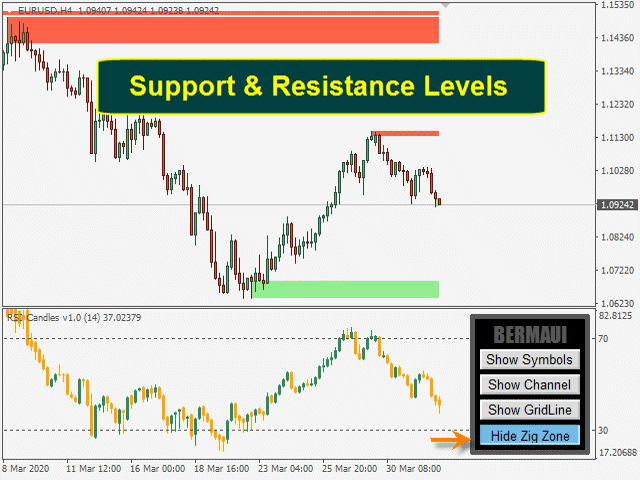
La idea de este indicador es dibujar RSI en forma de velas que se pueden comparar con gráficos de precios para generar señales de compra y venta. El indicador no es invención mía. Lo fundé en Internet hace varios años. Actualicé el código, agregué funciones de alerta, agregué el grupo de herramientas Bermaui Utilities.

El indicador calcula el RSI de todos los precios que se utilizan para dibujar velas (RSI de apertura, máximo, mínimo y cierre). Utiliza el más alto de ellos para dibujar la mecha alta de las velas RSI y el más bajo para dibujar la mecha baja de las velas RSI. El cuerpo de las velas RSI se encuentra entre sus máximos y mínimos. Si el RSI de la apertura es más bajo que el RSI del cierre, la vela RSI se considera alcista. Si el RSI de la apertura es más alto que el RSI del cierre, la vela RSI se considera bajista.

Cómo usarlo

  • Puede negociar la ruptura de las líneas de tendencia en el indicador RSI Candles, que liderará la tendencia en el gráfico de precios porque el impulso lidera el precio.
  • Puede dibujar cualquier forma de patrones de gráficos clásicos en el indicador RSI Candles e intercambiarlos exactamente como lo hace con el RSI original.
  • Se puede utilizar como RSI clásico. Si cruza la sobrecompra (70%), entonces vende y si cruza la sobreventa (30%), compra.
  • Puede utilizar la divergencia entre las velas RSI y los gráficos de precios para confirmar sus señales comerciales.

Características de las velas RSI

  • No repinta ni recalcula sus resultados.
  • Funciona en criptomonedas, acciones, índices, petróleo, oro y en todos los marcos de tiempo.
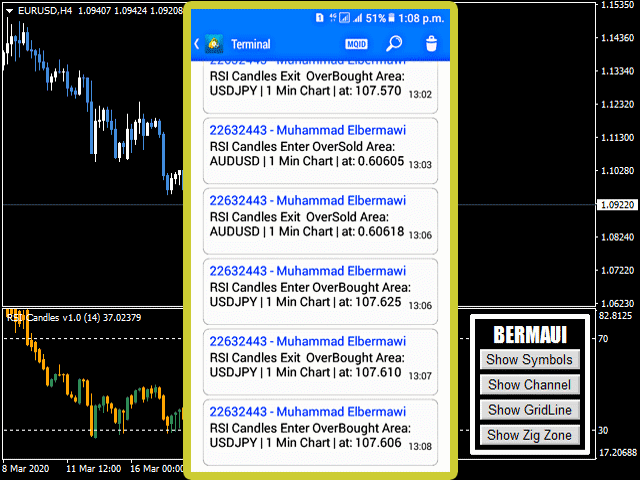
  • Sonido, alertas por correo electrónico y notificación móvil.
  • Líneas verticales que muestran señales de sobrecompra y sobreventa en el gráfico.
  • Parámetros bien diseñados para ayudar al usuario a navegar fácilmente entre ellos.
  • Búfer para construir sus propios asesores expertos.
  • Cuatro listas de colores diferentes para elegir.

Parámetros de velas RSI

(1) PARÁMETROS DEL INDICADOR

  • Periodo RSI.El valor predeterminado es 14.
  • Sobre el nivel vendido.El valor predeterminado es 30%.
  • Sobre el nivel de compra.El valor predeterminado es el 70%.

(2) LÍNEAS V Y ALERTAS

  • Mostrar línea vertical.Si es cierto, dibujará líneas verticales en el gráfico cuando las velas RSI crucen hacia / fuera de las áreas de sobrecompra o sobreventa. El valor predeterminado es falso.
  • Alerta sonora.El defecto es cierto.
  • Enviar correo electrónico.El valor predeterminado es falso.
  • Enviar notificación móvil.El valor predeterminado es falso.
(3) AJUSTES DE UTILIDADES
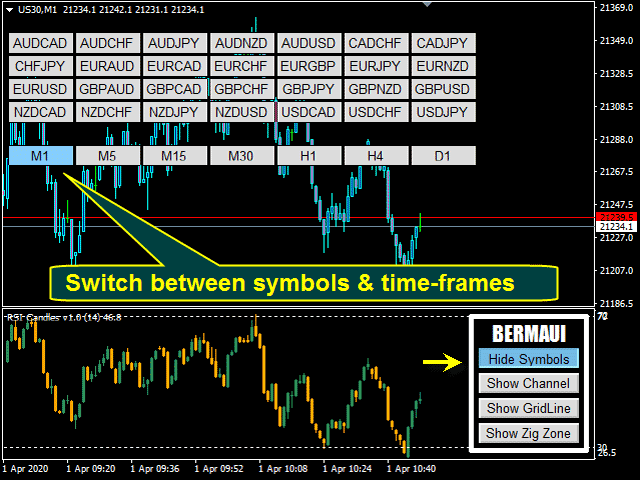
  • Fuente de símbolos.Obtenga símbolos de la Lista de símbolospersonalizada o de Market Watch.
  • Lista de símbolos (separados por ";")Si elige símbolos de una lista personalizada, separe los símbolos por ";".
  • Tamaño de fuente del botón. El valor predeterminado es diez.
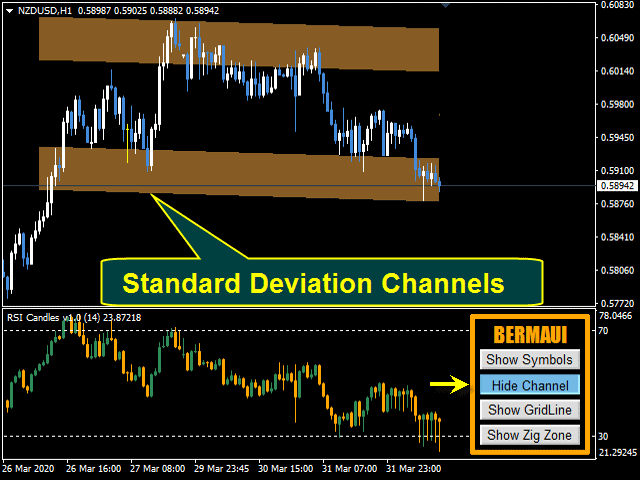
  • Longitud del canal [> 1]Número de velas utilizadas en el cálculo del canal. El valor predeterminado es 100.
  • Aparece el panel [Mayús + Letra]Letra para presionar más Mayús para que aparezca el panel. El valor predeterminado es "A"
  • Desaparecer panel [Mayús + Letra]Letra para presionar más Mayús para hacer que el panel desaparezca. El valor predeterminado es "D"
(4) ESTILO DE INDICADOR
  • Lista de colores del gráfico:el usuario puede elegir entre cuatro listas de colores diferentes para su gráfico o puede elegir (No hacer nada) si quiere usar su propia lista.


Si tiene alguna pregunta, por favor, contácteme a través de un mensaje privado o escríbala en la sección de comentarios.
Muhammad Al Bermaui, CMT
Comentarios 7
pornchai_p
340
pornchai_p 2023.06.04 04:21 
 

This is the best RSI indicator. HIghly recommnended. Please kindly send me the free Stochastic indicator. Thank you.

Hisham Ghoneim
296
Hisham Ghoneim 2022.08.18 10:39 
 

Great work as usual

Suvashish Halder
10690
Suvashish Halder 2022.04.07 05:58 
 

Best RSI indicator in this market and it's a real deal. Thank you for your work ❤

Productos recomendados
GeoWprPro
Georgij Komarov
WPR by Profile, or WPR for Professionals Geo_WprPro is one of the well-known currency profile indicators. It simultaneously displays two WPR indicators with different parameters in the matrix form on all timeframes of multiple currency pairs forming the currency profile . As follows from the description, " WPR is a leading indicator that often goes ahead of the price chart. The oscillator frequently reaches extreme values before the price reversal as if anticipating that event: it almost always
The principle of this indicator is very simple: detecting the trend with Moving Average, then monitoring the return point of graph by using the crossing of Stochastic Oscillator and finally predicting BUY and SELL signal with arrows, alerts and notifications. The parameters are fixed and automatically calculated on each time frame. Example: If you install indicator on EURUSD, timeframe M5: the indicator will detect the main trend with the Moving Average on this timeframe (for example the Moving
Binary Options Support Resistance Indicator This indicator is designed for binary options trading and effectively shows retracements from support and resistance levels. Signals appear on the current candle. A red arrow pointing downwards indicates a potential selling opportunity, while a blue arrow pointing upwards suggests buying opportunities. All that needs adjustment is the color of the signal arrows. It is recommended to use it on the M1-M5 timeframes as signals are frequent on these timef
MACD Divergence Finder es un Indicador que ayuda a encontrar divergencias entre los valores del MACD defindo y el precio del activo como potenciales puntos de cambio de la tendencia actual o pull backs para incrementar posiciones en favor a la tendencia actual. Se muestra el valor MACD, no el de Signal pues no es relevante para detectar este tipo de Divergencias Clásicas. En algunos equipos con microprocesador antiguo o baja RAM, al iniciar el indicador (añadirlo, cambiar valores, resetearlo o b
Indicator for binary options arrow is easy to use and does not require configuration works on all currency pairs, cryptocurrencies buy signal blue up arrow sell signal red down arrow tips do not trade during news and 15-30 minutes before their release, as the market is too volatile and there is a lot of noise it is worth entering trades one or two candles from the current period (recommended for 1 candle) timeframe up to m 15 recommended money management fixed lot or fixed percentage of the depo
Owl smart levels
Sergey Ermolov
4.62 (53)
Versión MT5  |   FAQ El   Indicador Owl Smart Levels   es un sistema comercial completo dentro de un indicador que incluye herramientas de análisis de mercado tan populares como   los fractales avanzados de Bill Williams , Valable ZigZag que construye   la estructura de onda correcta   del mercado y   los niveles de Fibonacci   que marcan los niveles exactos de entrada. en el mercado y lugares para tomar ganancias. Descripción detallada de la estrategia Instrucciones para trabajar con el indi
This indicator Master XR indicator.Indicator displays trend movement. Indicator calculates automatically line. Features FiltPer - displays indicator period. deviation - displays indicator deviation. deviation2 - displays indicator deviation. How to understand the status: If (Timeframe M1-H1) FiltPer = 100; If ( Timeframe H4-MN) FiltPer = 5-20; ////////////////////////////////////////////////////////////////////////////////////////////////////////////////////////////////////////////////////// /
Multi Trend Analyzer MT4 indicator provides signals from the following technical trading indicators: RSI, STOCH, STOCHRSI, MACD, ADX, Williams % R, ATR, Oscillator, ROC and Bull/Bear Power. It supports all time frames, from the 1 minute up to the monthly charts. You can change all indicator inputs. Indicator provide total trend summary. We can easily analysis and study market movement .
Trend PA
Mikhail Nazarenko
5 (3)
The Trend PA indicator uses   Price Action   and its own filtering algorithm to determine the trend. This approach helps to accurately determine entry points and the current trend on any timeframe. The indicator uses its own algorithm for analyzing price changes and Price Action. Which gives you the advantage of recognizing, without delay, a new nascent trend with fewer false positives. Trend filtering conditions can be selected in the settings individually for your trading style. The indicator
Strong Retracement Points Pro demo edition! SRP (Strong Retracement/Reversal Points) is a powerful and unique support and resistance indicator. It displays the closest important levels which we expect the price retracement/reversal! If all level are broken from one side, it recalculates and draws new support and resistance levels, so the levels might be valid for several days depending on the market! If you are still hesitating to start using this wonderful tool, you can check this link to see h
Apollo Price Action System es un indicador que se basa completamente en el principio Price Action. El indicador da una señal para comprar o vender tan pronto como se forman las condiciones para ingresar al mercado de acuerdo con el indicador de estrategia. El indicador se puede utilizar como un sistema comercial general o como una adición a su propio sistema comercial. Este indicador es muy fácil de usar. Sólo tienes que seguir las señales. El indicador muestra líneas de tendencia en el gráfico,
Market Structure Zig Zag
Lesedi Oliver Seilane
4.75 (20)
Free Market structure zig zag to assist in price action trading the screenshots describe how to use and how to spot patterns new version comes with alerts, email alert and  push notification alert can be used on all pairs  can be used on all timeframes  you can add additional confirmation indicators the indicator shows you your higher high and low highs as well as your lower lows and lower highs  the indication makes price action analysis easier to spot.
FREE
Indicador Forex HTF Ichimoku para MT4 El indicador Ichimoku es uno de los indicadores de tendencia más poderosos. HTF significa - Marco de tiempo más alto Este indicador es excelente para los operadores de tendencias, así como para combinarlo con entradas de acción del precio. El indicador HTF Ichimoku le permite adjuntar Ichimoku desde un período de tiempo superior a su gráfico actual. Tendencia ascendente: línea roja sobre la azul (y ambas líneas están sobre la nube) / Tendencia a la baja:
Easy Bands Mt4
Nikolay Kositsin
В основе индикатора EasyBands лежит тот же принцип, что и при построении Bollinger Band. Однако, данная модификация индикатора использует вместо стандартного отклонения средний торговый диапазон (Average True Range). Соответственно, с данным индикатором абсолютно аналогично можно использовать все стратегии, которые применяются с Bollinger Band. В данной версии индикатора используется двенадцать уровней и средняя линия (белый цвет). Индикация тренда выполнена в виде окраски свечей в зависимости
Deal Trading SPT
Sukunthakan Ngernbamrung
Deal Trading SPT (Super Trend) is an indicator, shows the market trend direction, entry position, take profit level, stop loss level and trend strength. Utility Help to further filter and develop strategy to trade Market overview on the chart Stop loss and take profit calculation with market volatility Resistance and support for trialing stop No repaint after the finished bar Works in any timeframe and financial instrument, including forex, CFD and crypto etc. Message pop-up, notification wi
ADX Pointer
Dominik Mandok
ADX Pointer is an indicator which is based on "Average Directional Index" and draws three numbers in chart window depending on the value of ADX. In ADX Pointer you can set "ADX_Period" which is of course period of Average Directional Index and you can also set 3 levels. When ADX value exceed first level ("ADX_Level1") in chart window appears number "1", when ADX exceed second level ("ADX_Level2") appears "2" and when ADX exceed third level ("ADX_Level3") appears "3". Simple. ADX Pointer works on
GG TrendBar Indicator
Biswarup Banerjee
5 (1)
GG TrendBar Indicator - Your Multitimeframe ADX Trading Solution Experience the power of multi-timeframe trading with the "GG TrendBar Indicator." This versatile tool, built upon the ADX indicator, offers precise insights by considering multiple timeframes, ensuring you make well-informed trading decisions. Basic Details : Indicator Type : GG TrendBar Indicator (Multi-Timeframe ADX) Key Metrics : Real-time ADX analysis across multiple timeframes. Customization : Enable or disable specific timefr
Forex Gump
Andrey Kozak
2.83 (6)
Forex Gump is a fully finished semi-automatic trading system. In the form of arrows, signals are displayed on the screen for opening and closing deals. All you need is to follow the instructions of the indicator. When the indicator shows a blue arrow, you need to open a buy order. When the indicator shows a red arrow, you need to open a sell order. Close orders when the indicator draws a yellow cross. In order to get the most effective result, we recommend using the timeframes H1, H4, D1. There
The indicator detects and displays Shark harmonic pattern (see the screenshot). The pattern is plotted by the extreme values of the ZigZag indicator (included in the resources, no need to install). After detecting the pattern, the indicator notifies of that by a pop-up window, a mobile notification and an email. The indicator highlights the process of the pattern formation and not just the complete pattern. In the former case, it is displayed in the contour triangles. After the pattern is comple
Noize Absorption Index MT4
Ekaterina Saltykova
5 (1)
Noize Absorption Index - is the manual trading system that measures the difference of pressure between bears forces and bulls forces. Green line - is a noize free index that showing curent situation. Zero value of index shows totally choppy/flat market.Values above zero level shows how powerfull bullish wave is and values below zero measures bearish forces.Up arrow appears on bearish market when it's ready to reverse, dn arrow appears on weak bullish market, as a result of reverse expectation. S
ZhiBiCCI MT4
Qiuyang Zheng
5 (1)
Los indicadores [ZhiBiCCI] son ​​adecuados para todos los ciclos de uso y también son adecuados para todas las variedades de mercado. [ZhiBiCCI] La línea verde sólida es una reversión de la divergencia alcista. La línea de puntos verde es una divergencia alcista clásica. [ZhiBiCCI] La línea continua hacia el rojo es una divergencia bajista inversa. La línea roja punteada es una divergencia bajista clásica. [ZhiBiCCI] puede configurarse en los parámetros (Alerta, Enviar correo, Enviar notif
The Four Moving Averages Message indicator ( please see the description and video ), a version of Four Moving Averages , concurrently displays four Moving Averages with default settings in the main chart window: Green and Red ones represent a short-term trend, Red and Blue ones - mid-term trend, while Blue and Yellow ones - long-term trend. You can change the moving average settings and colors. However, these parameters have been configured so that to allow trading on all time frames. The built-
Indicador Forex "RSI y 2 medias móviles" para MT4 Este indicador es excelente para los sistemas comerciales Momentum. El indicador "RSI y 2 MA" le permite ver los promedios móviles rápidos y lentos del propio RSI El indicador brinda oportunidades para ver el cambio de tendencia muy temprano "RSI y 2 MA" se pueden utilizar para captar el impulso en la dirección de la tendencia. Es muy fácil configurar este indicador a través de parámetros (ver imagen) El indicador se puede utilizar en cualquie
VR Cub
Vladimir Pastushak
VR Cub es un indicador para obtener puntos de entrada de alta calidad. El indicador fue desarrollado para facilitar los cálculos matemáticos y simplificar la búsqueda de puntos de entrada a una posición. La estrategia comercial para la cual se diseñó el indicador ha demostrado su eficacia durante muchos años. La simplicidad de la estrategia comercial es su gran ventaja, que permite que incluso los operadores novatos negocien con éxito con ella. VR Cub calcula los puntos de apertura de posiciones
Rainbow Ribbon
Pierce Vallieres
Rainbow Ribbon - Rainbow MA bands - Useful for spotting trend changes - Useful for spotting trend slopes - Useful for spotting trend acceleration - Ability to choose ribbon colors, moving averages, and distances - Provides colorful rainbow ribbons to show an array of moving averages Rainbow Ribbon is an extremely useful indicator, it has been designed to make it easy to spot the trend and also changes within the trend before they occur. It can be used many different ways and provides the abil
The Vortex Indicator was inspired by the work of an Austrian inventor, Viktor Schauberger, who studied the flow of water in rivers and turbines. Etienne Botes and Douglas Siepman developed the idea that movements and flows within financial markets are similar to the vortex motions found in water. The Vortex Indicator was also partly inspired by J. Welles Wilder's concept of directional movement, which assumes the relationship between price bars gives clues as to the direction of a market. This i
Scalping Modulator is a scalping trading system. The indicator consists of several analytical modules. It automatically analyzes the market and shows the trader all the necessary information for trading. Scalping Modulator draws two trend lines on the chart. One line shows the long-term direction of the price, the second line shows the medium-term direction of the price. The indicator also draws red and blue dots on the chart. They indicate a likely change in price movement. In order to open a
Trend Flasher Trend is your friend is the age old saying quote in trading arena, there are though many ways to gauge the trend and its direction, more scientific measure and logically meaningful will be an ATR break outs to identify and spot the trend and its acceleration, so we created this easy to use trend identification panel and optimized super trend based multi time frame panel entry system to aid and help the traders to make their trading decision. Unique Features of Trend Flasher 1
Trend Ray
Andriy Sydoruk
The indicator shows the potential trend direction by cyclical-wave dependence. Thus, all the rays of the intersection will be optimal rays, in the direction of which the price is expected to move, taking into account the indicator period. Rays can be used as a direction for potential market movement. But we must not forget that the approach must be comprehensive, the indicator signals require additional information to enter the market.
Sidus
Iurii Tokman
Sidus   El indicador es una estrategia comercial. Basado en 3 indicadores estándar: dos promedios móviles (MA) y un índice relativo a la fuerza (RSI). Las señales del indicador son el cruce de las medias móviles y el posicionamiento simultáneo del indicador RSI con respecto al nivel 50. Si la media móvil rápida está por encima de la media móvil lenta y el indicador RSI está por encima del nivel 50, se asumen compras. Si el promedio de movimiento rápido está por debajo del promedio de movimiento
Los compradores de este producto también adquieren
Gann Made Easy
Oleg Rodin
5 (32)
Gann Made Easy es un sistema de comercio de Forex profesional y fácil de usar que se basa en los mejores principios de comercio utilizando la teoría del Sr. W. D. Gann. El indicador proporciona señales precisas de COMPRA y VENTA, incluidos los niveles de Stop Loss y Take Profit. Puede comerciar incluso sobre la marcha utilizando notificaciones PUSH. ¡Por favor, póngase en contacto conmigo después de la compra! ¡Compartiré mis consejos comerciales con usted y excelentes indicadores de bonificació
¡Actualmente 20% OFF ! ¡La mejor solución para cualquier novato o trader experto! Este software funciona con 28 pares de divisas. Se basa en 2 de nuestros principales indicadores (Advanced Currency Strength 28 y Advanced Currency Impulse). Proporciona una gran visión general de todo el mercado de divisas. Muestra los valores de Advanced Currency Strength, la velocidad de movimiento de las divisas y las señales para 28 pares de divisas en todos los (9) marcos temporales. Imagine cómo mejorar
TrendMaestro
Stefano Frisetti
5 (2)
note: this indicator is for METATRADER4, if you want the version for METATRADER5 this is the link: TRENDMAESTRO recognizes a new TREND in the bud, he never makes mistakes. The certainty of identifying a new TREND is priceless. DESCRIPTION TRENDMAESTRO identifies a new TREND in the bud, this indicator examines the volatility, volumes and momentum to identify the moment in which there is an explosion of one or more of these data and therefore the moment in which prices have strong probability of f
TPSpro RFI Levels
Roman Podpora
5 (13)
Reversal First Impulse levels (RFI) - are the maximum volume levels/areas that turn the market around, so they play a critical role in future trading decisions. The logic behind the movement of any chart is that the price moves from the first impulse level (RFI) to the first impulse level (RFI) of the past trend. The first impulse level (RFI) is the most powerful level during a trend reversal, which forms a reversal zone. The first impulse level from the reversal of the previous movement is also
Introduciendo       Indicador Quantum Trend Sniper   , el innovador indicador MQL5 que está transformando la forma en que identificas y negocias los cambios de tendencia. Desarrollado por un equipo de comerciantes experimentados con experiencia comercial de más de 13 años,       Indicador de francotirador de tendencia cuántica       está diseñado para impulsar su viaje comercial a nuevas alturas con su forma innovadora de identificar cambios de tendencia con una precisión extremadamente alta.
Trend Screener
STE S.S.COMPANY
4.83 (86)
Indicador de tendencia, solución única e innovadora para el comercio y filtrado de tendencias con todas las funciones de tendencias importantes integradas en una sola herramienta. Es un indicador 100% sin repintar de marcos temporales y monedas múltiples que se puede usar en todos los símbolos/instrumentos: divisas, materias primas, criptomonedas, índices y acciones. Trend Screener es un indicador de seguimiento de tendencia eficiente que proporciona señales de tendencia de flecha con puntos en
Atomic Analyst
Issam Kassas
5 (2)
First of all Its worth emphasizing here that this Trading Indicator is   Non-Repainting ,   Non-Redrawing   and   Non-Lagging   Indicator, Which makes it ideal from both manual and robot trading.  The Atomic Analyst  is a PA Price Action Indicator that uses Strength and Momentum of the price to find a better edge in the market. Equipped with Advanced filters which help remove noises and false signals, and Increase Trading Potential. Using Multiple layers of complex Indicators, the Atomic Anal
ACTUALMENTE 26% DE DESCUENTO ¡La mejor solución para cualquier operador novato o experto! Este indicador es una herramienta única, de alta calidad y asequible porque hemos incorporado una serie de características propias y una nueva fórmula. ¡Con sólo UN gráfico puede leer la Fuerza de la Divisa para 28 pares de Divisas! Imagínese cómo mejorará su operativa porque podrá señalar el punto exacto de activación de una nueva tendencia o de una oportunidad de scalping. Manual del usuario: haga
TPSproTREND PrO
Roman Podpora
5 (15)
TPSpro TRENDPRO  - is a trend indicator that automatically analyzes the market and provides information about the trend and each of its changes, as well as giving signals for entering trades without redrawing! The indicator uses each candle, analyzing them separately. referring to different impulses - up or down impulse. Exact entry points into transactions for currencies, crypto, metals, stocks, indices!  - To maximize the potential and learn how to trade using this indicator, read the full des
Quantum Breakout Indicator PRO
Bogdan Ion Puscasu
4.96 (25)
Introduciendo       Quantum Breakout PRO   , el innovador indicador MQL5 que está transformando la forma en que comercia con Breakout Zones. Desarrollado por un equipo de operadores experimentados con experiencia comercial de más de 13 años,   Quantum Breakout PRO   está diseñado para impulsar su viaje comercial a nuevas alturas con su innovadora y dinámica estrategia de zona de ruptura. El indicador de ruptura cuántica le dará flechas de señal en las zonas de ruptura con 5 zonas objetivo de
Currency Strength Wizard es un indicador muy poderoso que le proporciona una solución todo en uno para operar con éxito. El indicador calcula el poder de este o aquel par de divisas utilizando los datos de todas las monedas en múltiples marcos de tiempo. Estos datos se representan en forma de índice de moneda fácil de usar y líneas eléctricas de moneda que puede usar para ver el poder de esta o aquella moneda. Todo lo que necesita es adjuntar el indicador al gráfico que desea operar y el indicad
Gann Swing Structure
Kirill Borovskii
5 (1)
This indicator is based on the mathematics of the great trader W.D. Ganna. With its help, you can easily find strong levels by analyzing swings to find the optimal entry point. The indicator works on all instruments and all timeframes. The indicator is fully manual and has control buttons. All you need to do is press the NEW button, a segment will appear, which you can place on any movement, swing or even 1 candle that you want to analyze. By placing the segment, press the OK button. A grid (th
El sistema PRO Renko es un sistema de trading de alta precisión especialmente diseñado para operar gráficos RENKO. Se trata de un sistema universal que se puede aplicar a diversos instrumentos de negociación. El sistema neutraliza eficazmente el llamado ruido de mercado, lo que le brinda acceso a señales de reversión precisas. El indicador es muy fácil de usar y solo tiene un parámetro responsable de la generación de señales. Puede adaptar fácilmente la herramienta a cualquier instrumento com
Conviértase en un Breaker Trader y obtenga beneficios de los cambios en la estructura del mercado a medida que se invierte el precio. El indicador de ruptura de bloque de órdenes identifica cuándo una tendencia o movimiento de precio se acerca al agotamiento y está listo para revertirse. Le alerta sobre cambios en la estructura del mercado que generalmente ocurren cuando una reversión o un retroceso importante están a punto de suceder. El indicador utiliza un cálculo patentado que identific
Scalper Vault
Oleg Rodin
5 (26)
Scalper Vault es un sistema profesional de reventa que le brinda todo lo que necesita para una reventa exitosa. Este indicador es un sistema comercial completo que puede ser utilizado por operadores de divisas y opciones binarias. El marco de tiempo recomendado es M5. El sistema le proporciona señales de flecha precisas en la dirección de la tendencia. También le proporciona señales superiores e inferiores y niveles de mercado de Gann. Los indicadores proporcionan todo tipo de alertas, incluidas
Advanced Supply Demand
Bernhard Schweigert
4.92 (309)
¡Actualmente con 33% de descuento! ¡La mejor solución para cualquier tráder principiante o experto! Este indicador es una herramienta comercial única, de alta calidad y asequible, porque incorpora una serie de características patentadas y una nueva fórmula. Con esta actualización, podrá mostrar zonas de doble marco temporal. No solo podrá mostrar un marco temporal más alto, sino también mostrar ambos, el marco temporal del gráfico MÁS el marco temporal más alto: MOSTRANDO ZONAS ANIDADAS. A todos
Weis Wave with Alert
Trade The Volume Waves Single Member P.C.
4.79 (19)
Rental/Lifetime Package Options and Privileges' * For optimum results the yearly or lifetime package is suggested due to live training and Discord  channel trading with the  creator! Rent Monthly Six Months   Yearly/Lifetime Weis Wave with Speed with Alert+Speed Index x x x Manual  x x x Quick Set up Video x x x Blog x x x Lifetime Updates x x x Setup and Training Material x x Free Rectangle Break Alert Tool      x Discord Access Channel "The SI traders" x 2-hour live methodology traini
FX Power MT4 NG
Daniel Stein
5 (7)
Obtenga su actualización diaria del mercado con detalles y capturas de pantalla a través de nuestro Morning Briefing aquí en mql5 y en Telegram ! FX Power MT4 NG es la nueva generación de nuestro popular medidor de fuerza de divisas, FX Power. ¿Y qué ofrece este medidor de fuerza de nueva generación? Todo lo que le encantaba del FX Power original PLUS Análisis de fuerza de ORO/XAU Resultados de cálculo aún más precisos Períodos de análisis configurables individualmente Límite de cálculo persona
El indicador de reversión de ADR le muestra de un vistazo dónde se cotiza actualmente el precio en relación con su rango diario promedio normal. Recibirá alertas instantáneas a través de una ventana emergente, correo electrónico o push cuando el precio exceda su rango promedio y los niveles por encima de su elección para que pueda saltar rápidamente a retrocesos y reversiones. El indicador dibuja líneas horizontales en el gráfico en los extremos del rango promedio diario y también extensiones p
IX Power MT4
Daniel Stein
5 (5)
IX Power lleva por fin la insuperable precisión de FX Power a los símbolos que no son de Forex. Determina con exactitud la intensidad de las tendencias a corto, medio y largo plazo de tus índices, acciones, materias primas, ETF e incluso criptodivisas favoritas. Puede analizar todo lo que su terminal le ofrece. Pruébalo y experimenta cómo tu timing mejora significativamente a la hora de operar. Características principales de IX Power Resultados de cálculo 100% precisos y sin repintado -
Italo Levels Indicator
Italo Santana Gomes
5 (7)
BUY INDICATOR AND GET EA FOR FREE AS A BONUS + SOME OTHER GIFTS! ITALO LEVELS INDICATOR  is the best levels indicator ever created, and why is that? Using high volume zones on the market and Fibonacci the Indicator works on all time-frames and assets, indicator built after 7 years of experience on forex and many other markets. You know many levels indicators around the internet are not complete, does not help, and it's difficult to trade, but the   Italo Levels Indicator is different , the Ital
The indicator is designed to work on any trading platform. The program is based on proprietary algorithms and W.D.Ganna's mathematics, allowing you to calculate target levels of price movement based on three points with the highest degree of certainty. It is a great tool for stock trading. The indicator has three buttons: NEW - call up a triangle for calculation. DEL - delete the selected triangle. DELS - completely remove all constructions. The probability of achieving the goals is more than 80
Ultimate Sniper Dashboard
Hispraise Chinedum Abraham
4.68 (25)
¡Descuento de 299 $! ¡Los precios pueden aumentar en el futuro! ¡Lea la descripción a continuación! Mejor Sistema de Entrada para Ultimate Sniper Dashboard: ULTIMATE DYNAMIC LEVELS. (Por favor, compruebe mis productos) El Ultimate Sniper Dashboard SÓLO funciona en mercados en vivo debido a los límites de prueba multidivisa de MT4. ¡Presentamos el Ultimate Sniper Dashboard! Nuestro mejor que contiene tanto HA-Sniper, MA-Sniper. y muchos modos especiales. ¡El Ultimate Sniper Dashboard es
TrendLine PRO MT4
Evgenii Aksenov
4.88 (248)
El indicador Trend Line PRO es una estrategia comercial independiente. Muestra el cambio de tendencia, el punto de entrada a la transacción, así como calcula automáticamente tres niveles de Take Profit y la protección contra la pérdida de Stop Loss Trend Line PRO es perfecto para todos los símbolos de Meta Trader: monedas, metales, criptomonedas, acciones e índices Ventajas de Trend Line PRO: Nunca vuelve a dibujar sus señales Posibilidad de utilizar como estrategia independiente Tiene tres niv
Scalper Inside PRO
Alexey Minkov
4.74 (54)
GET 10% OFF NOW! Last 2 copies at current price! An exclusive indicator that utilizes an innovative algorithm to swiftly and accurately determine the market trend. The indicator automatically calculates opening, closing, and profit levels, providing detailed trading statistics. With these features, you can choose the most appropriate trading instrument for the current market conditions. Additionally, you can easily integrate your own arrow indicators into Scalper Inside Pro to quickly evaluate t
M1 Arrow
Oleg Rodin
5 (13)
Una estrategia intradía basada en dos principios fundamentales del mercado. El algoritmo se basa en el análisis de volúmenes y ondas de precios utilizando filtros adicionales. El algoritmo inteligente del indicador da una señal solo cuando dos factores de mercado se combinan en uno. El indicador calcula ondas de cierto rango en el gráfico M1 utilizando los datos del marco de tiempo más alto. Y para confirmar la onda, el indicador utiliza el análisis por volumen. Este indicador es un sistema come
First of all Its worth emphasizing here that this Trading Tool is Non-Repainting Non-Redrawing and Non-Lagging Indicator Which makes it ideal for professional trading . The Smart Price Action Concepts Indicator is a very powerful tool for both new and experienced traders . It packs more than 20 useful indicators into one combining advanced trading ideas like Inner Circle Trader Analysis and Smart Money Concepts Trading Strategies . This indicator focuses on Smart Money Concepts providing in
Presentamos ON Trade Waves Patterns Harmonic Elliot Wolfe, un indicador avanzado diseñado para detectar diversas formas de patrones en el mercado mediante métodos tanto manuales como automáticos. A continuación, te explicamos cómo funciona: Patrones Armónicos: Este indicador puede identificar patrones armónicos que aparecen en tu gráfico. Estos patrones son esenciales para los traders que practican la teoría del trading armónico, tal como se popularizó en el libro de Scott Carney "Harmonic Tradi
The breakout algorithm is a technique based on price, price features, to shape a breakout strategy. The strategy in this indicator will not be redrawn (none-repaint indicator), it is suitable for short or long term traders In the screenshot is the EURUSD pair, these currency pairs, commodities or stocks, it have similar strength *Non-Repainting (not redrawn) *For Metatrader4 Only *Great For Scalping *Great For Swing Trading *Arrow Entry, Green is Long, Red is Short *Works On Any Timeframe *Work
Este tablero es una herramienta de alerta para usar con el indicador de reversión de la estructura del mercado. Su propósito principal es alertarlo sobre oportunidades de reversión en marcos de tiempo específicos y también para volver a probar las alertas (confirmación) como lo hace el indicador. El tablero está diseñado para ubicarse en un gráfico por sí solo y funcionar en segundo plano para enviarle alertas sobre los pares y marcos de tiempo elegidos. Fue desarrollado después de que muchas p
Otros productos de este autor
Bermaui Deviation Percent
Muhammad Elbermawi
4.94 (128)
O (BD%), que es un índice de volatilidad que mide la volatilidad en porcentaje en lugar de puntos. La idea de BD% es hacer un índice en función de la Desviación Estándar Clásica (CSD) que se mueva entre 0 y 100 por ciento. Puede utilizar BD% para comparar la volatilidad de la misma seguridad en diferentes períodos de tiempo o diferentes marcos de tiempo. Además, puede usar BD% para comparar la volatilidad entre diferentes valores en diferentes mercados en términos de porcentaje en lugar de pu
True Direction Oscillator
Muhammad Elbermawi
4.9 (490)
O (TDO), que es un índice que mide la tasa de cambio de precios utilizando el principio de " Pure Momentum ". Cuando el precio de un valor aumenta de 10 a 15, la tasa de cambio del precio es del 150%, pero cuando baja de 15 a 10, la tasa de cambio del precio es solo del 33,3%. Es por eso que los indicadores de análisis técnico como "Tasa de cambio de precio" (ROC) o "Momentum" dan lecturas más altas para los movimientos de precios ascendentes que las dadas para los descendentes. TDO soluciona e
Bermaui Bands
Muhammad Elbermawi
4.94 (89)
Bermaui Bands (BB) es una herramienta de análisis técnico que ayuda a filtrar entre los movimientos de precios de rango y tendencia. La idea detrás de este indicador se puede explicar en los siguientes pasos: Calcule la desviación estándar como un oscilador que se mueve entre 0 y 100. Lo llamaré porcentaje de desviación de Bermaui (BD%). Si "BD%" está cerca de cero, la volatilidad está en su punto máximo. Además, si "BD%" está cerca de 100, la volatilidad es muy baja. Una alta volatilidad signif
Bermaui Pin Bars
Muhammad Elbermawi
5 (22)
Barras de pasador Bermaui O (BPB) es un indicador que encuentra el patrón de acción del precio de Pin Bars en el gráfico. Pin Bars es un atajo para "Pinocchio Bars", que es un patrón de barra clásico alternativo a los candelabros japoneses con sombras altas o inferiores y cuerpos muy pequeños como Hammer, Inverted-Hammer, Hanging Man, Shooting Star, Dragon Fly Doji o Grave Stone Doji . El indicador Bermaui Pin Bars encuentra este patrón en función de una fórmula que se puede explicar en los
Classic Keltner Channel
Muhammad Elbermawi
4.9 (40)
O CKC. Este indicador funciona según la regla clásica de la media móvil de diez días descrita por Chester W. Keltner (1909-1998). Todos los parámetros están configurados en la versión clásica del sistema Keltner por defecto, mientras que el usuario puede cambiarlos si lo desea. Información importante Lea el manual de CKC: https://www.mql5.com/en/blogs/post/736577 Ejemplo de asesor experto de CKC: https://www.mql5.com/en/blogs/post/734150 Acerca de la fórmula del canal Keltner 1. Calcule la
MASR Bands
Muhammad Elbermawi
5 (9)
O bandas M Oving Un verage S poyo R esistencia. El indicador MASR Bands es un promedio móvil rodeado por dos bandas que funcionan juntas como niveles de soporte y resistencia. Estadísticamente, las bandas MASR contienen velas de precios el 93% del tiempo. Así es como se calcula en pasos: 1. El primer paso es calcular el máximo más alto (HHV) y el mínimo más bajo (LLV) durante un período de tiempo X. 2. El segundo paso es dividir HHV por LLV para obtener el ancho de la distancia entre ello
BACD Cloud
Muhammad Elbermawi
4.57 (7)
O B ermaui Un verage C onvergence D ivergence la nube, que es un oscilador que muestra la dirección de tendencia y las medidas de su fuerza en porcentaje. El cálculo de BACD Cloud es el siguiente: 1- Calcula dos medias móviles exponenciales. Uno de ellos es más rápido que el otro. Llamaré al primero (Rápido) y al segundo (Lento) 2- Encuentra el centro entre ellos, donde: Centro MA = (Rápido + Lento) / 2 3- Calcule la línea BACD de la siguiente manera: BACD = 100 * (Fast / Center MA) 4-
Moving Average Cloud
Muhammad Elbermawi
4.93 (14)
O "MAC". Este es un indicador diseñado para ayudarlo a capturar e intercambiar la tendencia. La idea detrás de este indicador se puede explicar en los siguientes pasos: Dibuja una envolvente promedio de rápido movimiento. Dibuja una Envolvente promedio de movimiento lento. La banda superior de MAC es el valor más alto entre el máximo de ambas envolventes. La banda inferior de MAC es el valor más bajo entre el mínimo de ambas envolventes. La nube de histograma MAC llena la distancia entre dos
Or DBD%. The indicator consists of colored tape that shows trading signals depending on two Bermaui Deviation Oscillator (BD%) and two moving averages. Bermaui Deviation Percent is a volatility index that measures volatility in percent rather than points. The idea of BD% is to make an index depending on Classic Standard Deviation (CSD) that moves between 0 and 100 percent. Important Information DBD% expert advisor example:  https://www.mql5.com/en/blogs/post/731145 If you want to know mor
Bermaui Channel
Muhammad Elbermawi
5 (27)
This is a price channel that shows five important price levels on the chart. Those levels are: 1. The Highest High (HH) of the previous x bars. 2. The Highest Low (HL) of the previous x bars. 3. The Center Line. 4. The Lowest High (LH) of the previous x bars. 5. The Lowest Low (LL) of the previous x bars. How does Bermaui Channels Captures Overbought  area Think of the distance between HH and HL levels as an overbought area. When the price candles or bars crosses the HL to the upside this
Bermaui Manual EA
Muhammad Elbermawi
5 (9)
Este es un asesor experto semiautomático que comercia con el sistema de red. La idea es tomar gradualmente diferentes posiciones en el mercado y luego calcular el nivel de equilibrio para ellas. Cuando los precios superan este punto de equilibrio por una distancia predeterminada, todas las órdenes abiertas se cierran. Información importante Aquí está la guía del usuario:   https://www.mql5.com/en/blogs/post/730567 Puede probar este EA con cualquiera de mis otros productos, aquí: https://www.
Horus EA
Muhammad Elbermawi
3.67 (3)
Horus EA para MT4 Hace miles de años, los antiguos egipcios inventaron un sistema de conteo que usaban para medir sus tierras y pesar sus mercancías. Este sistema fue conocido como el " Ojo de Horus ". El Ojo de Horus se asoció con el mito del dios Osiris y se convirtió en uno de los símbolos sagrados de los faraones. Usé las ecuaciones matemáticas en el Ojo de Horus con la secuencia de Fibonacci para construir un sistema de administración de dinero de progresión negativa que es un 89% más se
Filtro:
pornchai_p
340
pornchai_p 2023.06.04 04:21 
 

This is the best RSI indicator. HIghly recommnended. Please kindly send me the free Stochastic indicator. Thank you.

Hisham Ghoneim
296
Hisham Ghoneim 2022.08.18 10:39 
 

Great work as usual

Suvashish Halder
10690
Suvashish Halder 2022.04.07 05:58 
 

Best RSI indicator in this market and it's a real deal. Thank you for your work ❤

Muhammad Elbermawi
52201
Respuesta del desarrollador Muhammad Elbermawi 2022.04.07 08:20
You are welcome. Suvashish 🙏
faithdefender
1666
faithdefender 2022.02.12 21:05 
 

This man is just plain honest! I own three of his indicators and I cant complain. Bermaui Bands, TDO and now RSI Candles. I may not be making money, but the indicators do what he says they would do. And the price is fair especially in the light of 1000 activations compared to many of the sleazy Vendors who only give 5. And then they (other Vendors) turn around and lie to you saying "we are following the rules set by MQL and are prohibited from giving more than 5. Apparently, Mr. Elbimawri didnt get the memo. Nevertheless, why the lengthy review? I just purchased a different RSI indicator (because it was 10 bucks cheaper) and I have nothing but regrets. It is called "RSI As Bar". I sent the complaint to the Vendor the first hour, , but he never responded. Not only that, but he has pulled his indicator. If I go to the page, I now have a note that says "Unfortunately, "RSI as Bar" is unavailable." He will probably repackage it with a new name and sell it again to the public. Why? Because he can do it and get away with it since there is no accountability on this platform. MQL loves the vendors because it brings people to this venue, but to think of the people who have been ripped off! I hope Mr Elbermawi continues to come up with new ideas. And thank you for your honesty in value and indicators.

Muhammad Elbermawi
52201
Respuesta del desarrollador Muhammad Elbermawi 2022.02.13 12:27
Thanks a lot for all the great words 🙏
cvdestyfx
2702
cvdestyfx 2021.03.09 17:33 
 

The best RSI indicator!

Muhammad Elbermawi
52201
Respuesta del desarrollador Muhammad Elbermawi 2021.03.10 12:09
Thanks a lot, cvdestyfx 🤗
Livio Yves Chathuant
873
Livio Yves Chathuant 2020.12.26 04:44 
 

Hi really happy with my purchase this indicator reveals to us and confirms the future price movements, I have this very complete tool for swing trading.thank you M. Muhammad

Baboloki Mathabe
605
Baboloki Mathabe 2020.10.31 14:31 
 

Author Mr Albermawi provides quality products this is an addition to the other tools got from him

Muhammad Elbermawi
52201
Respuesta del desarrollador Muhammad Elbermawi 2020.10.31 18:14
Thanks a lot, Baboloki Mathabe 🤗
Respuesta al comentario