TRIXe
- Indicadores
- Versión: 1.0

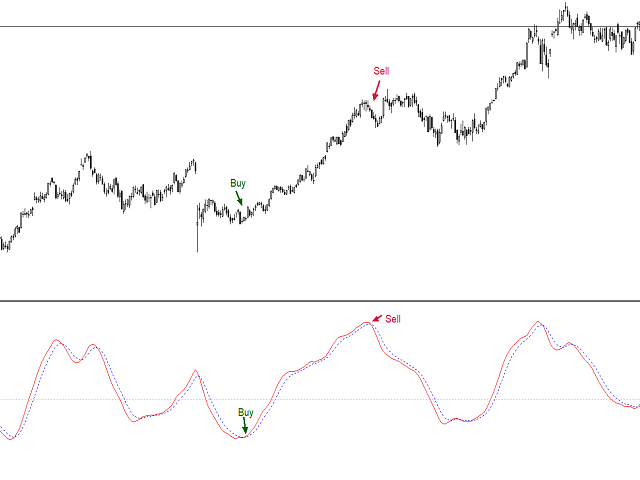
El indicador TRIXe es la combinación del indicador TRIX (Media Móvil Exponencial Triple) con el añadido de una señal EMA (Media Móvil Exponencial). Proporciona señales de continuidad de tendencia y de inicio de una nueva tendencia.
Los puntos de entrada y salida de las operaciones se producen cuando se cruzan las curvas del indicador.
Funciona mejor cuando se combina con otros indicadores.


Gostei muito! Estou usando e dando certo! Parabéns e mais sucesso ao desenvolvedor!