YY PP Price Channel
- Indicadores
- Versión: 1.0
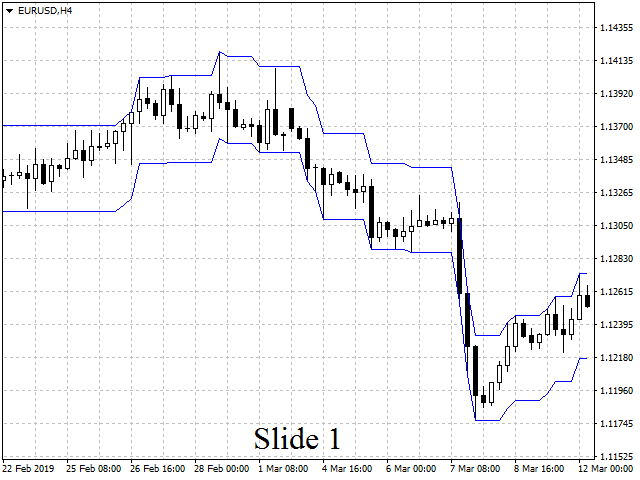
El indicador Point-Percent Price Channel (PPPC o PP Price Channel) está diseñado para mostrar en el gráfico un canal cuya anchura se especifica tanto en porcentaje del precio actual como en puntos. Su aspecto se presenta en la diapositiva 1.
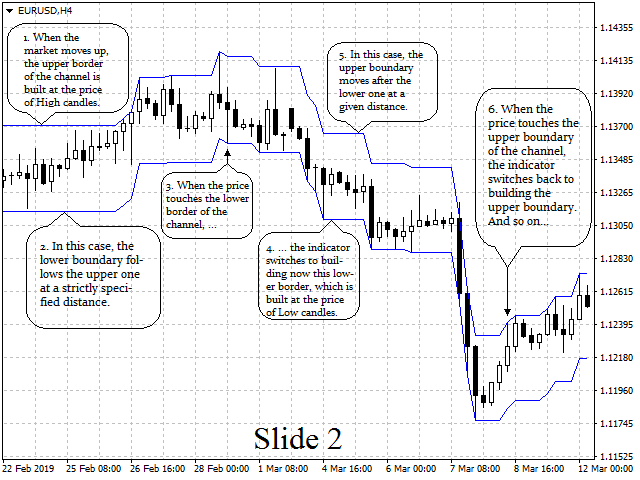
Cuando el mercado se mueve al alza, el límite superior del canal se construye en el precio de las velas altas. En este caso, el límite inferior sigue al superior a una distancia estrictamente especificada. Cuando el precio toca el borde inferior del canal, el indicador pasa a construir ahora este borde inferior, que se construye en el precio de las velas Low. En este caso, el límite superior se mueve después del inferior a una distancia determinada. Cuando el precio toca el límite superior del canal, el indicador vuelve a construir el límite superior. Y así sucesivamente... Ver diapositiva 2.
Parámetros
- Anchura del canal en puntos - anchura del canal en puntos;
- Channel Width in Percents - anchura del canal en porcentajes.
Para establecer el ancho del canal sólo en puntos, necesita especificar un valor cero en el segundo parámetro, y en puntos en el primer parámetro. Para establecer el ancho del canal sólo en porcentaje, necesita especificar un valor cero en el primer parámetro, y en porcentaje en el segundo parámetro. Si se establecen valores distintos de cero en ambos parámetros, entonces el ancho del canal se calculará como la suma de dos números (valor como porcentaje del precio actual más el valor especificado en puntos).
Utilización del indicador en el trading
El primer método de negociación se basa en la ruptura de uno de los bordes del canal.
Por ejemplo, si el precio subió, cuando se invierta (es decir, cuando toque el límite inferior del canal), debe realizar una venta (Sell). A continuación, debe permanecer en una posición corta hasta que el precio suba (es decir, hasta que el precio toque el límite superior del canal).
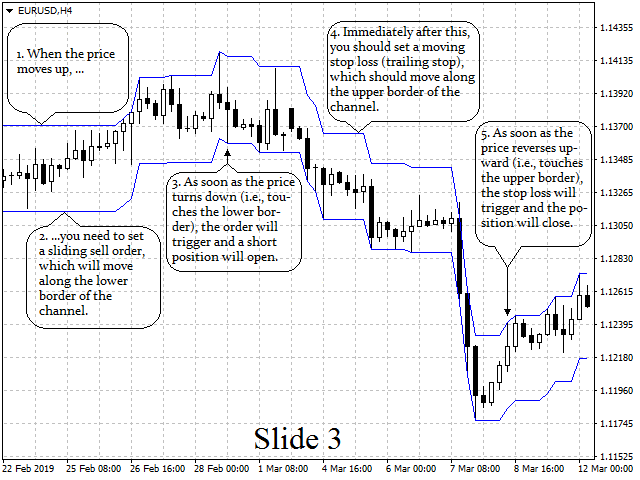
Cabe señalar que la aplicación de una estrategia de negociación de este tipo es bastante sencilla. Para ello, cuando el precio suba, debe establecer una orden de venta deslizante, que se moverá a lo largo del borde inferior del canal. En cuanto el precio baje (es decir, toque el borde inferior), la orden se activará y se abrirá una posición corta. Inmediatamente después, deberá establecer un stop loss móvil (trailing stop), que deberá moverse a lo largo del borde superior del canal. En cuanto el precio revierta al alza (es decir, toque el borde superior), se activará el stop loss y se cerrará la posición. Véase la diapositiva 3.
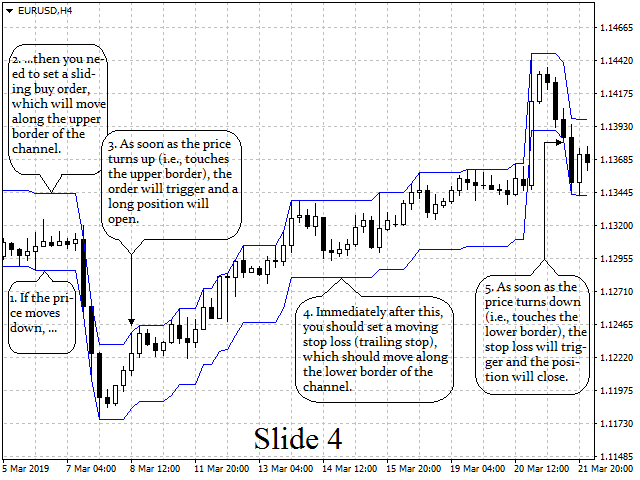
Para implementar la entrada en una posición larga (Comprar), debe realizar acciones similares de espejo opuesto. Véase la diapositiva 4.
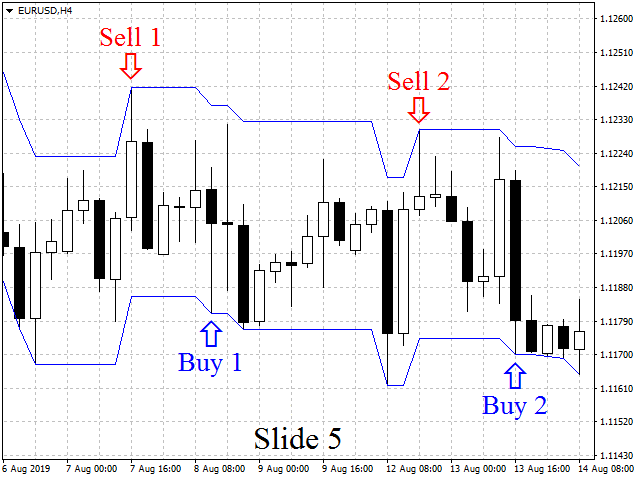
El segundo método de negociación se basa en el rebote del precio desde ambos bordes del canal.
Por ejemplo, cuando el precio toca el borde inferior del canal, debe Comprar, y cuando el precio toca el borde superior, debe Vender. Véase la diapositiva 5.
Utilización del indicador en el trabajo de otros indicadores
Este indicador se puede utilizar en el trabajo de otros indicadores. En particular, se utiliza para construir ondas mono en el indicador YY Mono Waves, que se puede descargar de forma gratuita en el Mercado.