YY PP Price Channel
- Indicateurs
- Version: 1.0
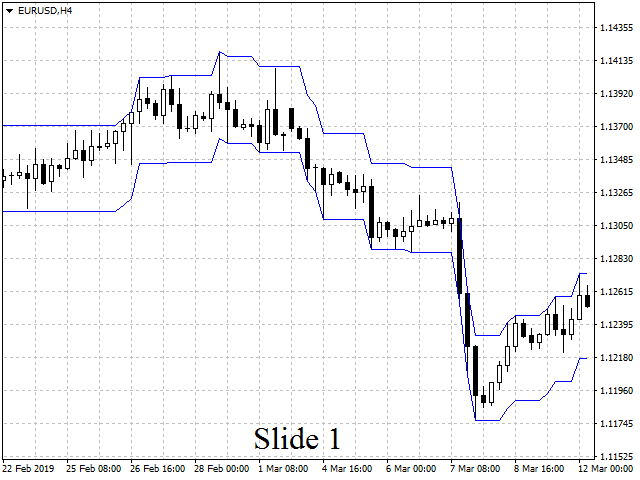
The Point-Percent Price Channel (PPPC or PP Price Channel) indicator is designed to display on the chart a channel whose width is specified both as a percentage of the current price and in points. Its appearance is presented on slide 1.
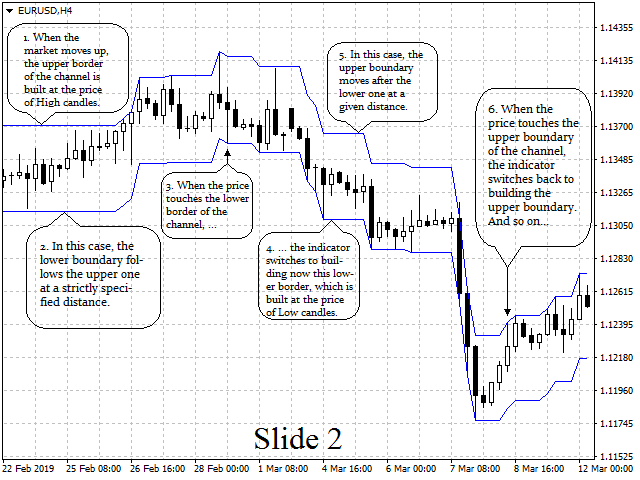
When the market moves up, the upper border of the channel is built at the price of High candles. In this case, the lower boundary follows the upper one at a strictly specified distance. When the price touches the lower border of the channel, the indicator switches to building now this lower border, which is built at the price of Low candles. In this case, the upper boundary moves after the lower one at a given distance. When the price touches the upper boundary of the channel, the indicator switches back to building the upper boundary. And so on... See slide 2.
Parameters
- Channel Width in Points – channel width in points;
- Channel Width in Percents – channel width in percents.
To set the channel width only in points, you need to specify a zero value in the second parameter, and in points in the first parameter. In order to set the channel width only in percent, you need to specify a zero value in the first parameter, and in percent in the second parameter. If non-zero values are set in both parameters, then the channel width will be calculated as the sum of two numbers (value as a percentage of the current price plus the specified value in points).
Using the indicator in trading
The first method of trading is based on breaking through one of the borders of the channel.
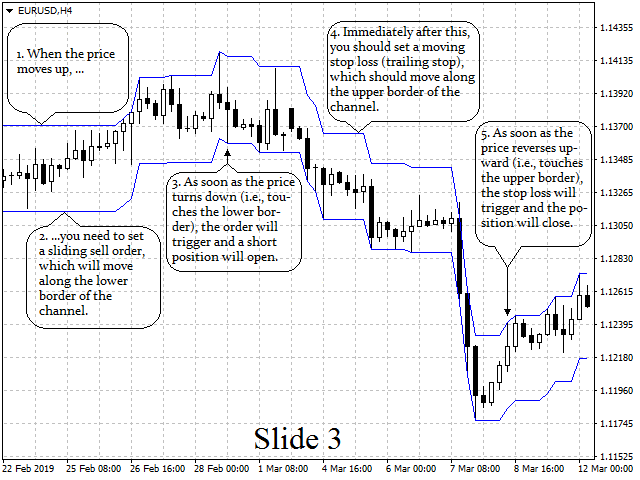
For example, if the price moved up, then when it is reversed (i.e., when touching the lower boundary of the channel), you should perform a sale (Sell). Next, you should remain in a short position until the price turns up (i.e. until the price touches the upper border of the channel).
It should be noted that implementing such a trading strategy is quite simple. To do this, when the price moves up, you need to set a sliding sell order, which will move along the lower border of the channel. As soon as the price turns down (i.e., touches the lower border), the order will trigger and a short position will open. Immediately after this, you should set a moving stop loss (trailing stop), which should move along the upper border of the channel. As soon as the price reverses upward (i.e., touches the upper border), the stop loss will trigger and the position will close. See slide 3.
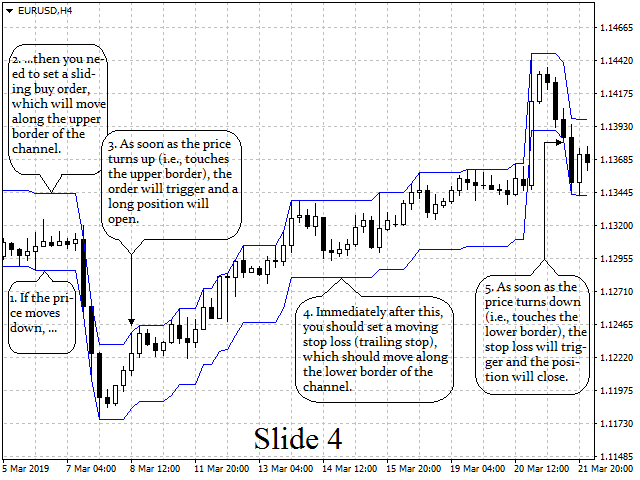
To implement the entry into a long position (Buy), you should perform similar mirror-opposite actions. See slide 4.
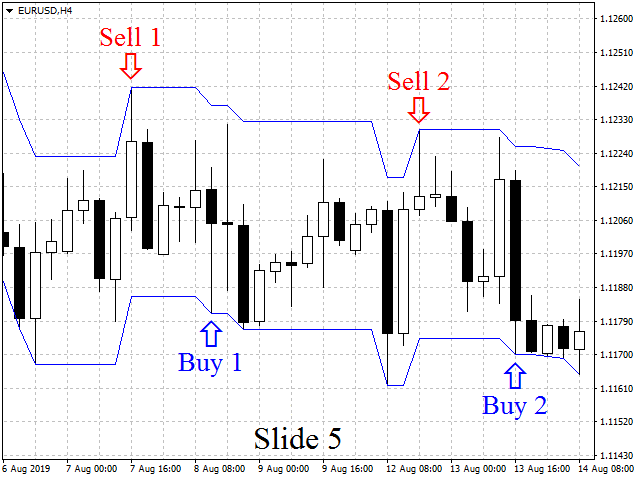
The second method of trading is based on the rebound of the price from both borders of the channel.
For example, when the price touches the lower border of the channel, you should Buy, and when the price touches the upper border, you should Sell. See slide 5.
Using the indicator in the work of other indicators
This indicator can be used in the work of other indicators. In particular, it is used to build monowaves in the YY Mono Waves indicator, which can be downloaded for free in the Market.