Adaptive RSI
- Indicadores
- Versión: 3.22
- Actualizado: 23 marzo 2020
- Activaciones: 10

El Índice de Fuerza Relativa (RSI) es uno de los osciladores más populares y precisos ampliamente utilizado por los operadores para capturar las zonas de sobrecompra y sobreventa de la acción del precio. Aunque el indicador RSI funciona bien durante un período de mercado, no logra generar señales rentables cuando la condición del mercado cambia, y por lo tanto produce señales erróneas que resultan en grandes pérdidas.
¿Ha pensado alguna vez en un indicador RSI adaptativo que adapte su periodo de cálculo en función de las condiciones del mercado? El indicador presentado implementa un algoritmo de optimización que identifica el mejor periodo para el cálculo del RSI basado en la maximización del beneficio sobre N barras pasadas. Usted puede imaginar que el proceso de optimización del probador de estrategias de MetaTrader se ejecuta continuamente en gráficos en vivo para encontrar el mejor período de RSI, basado en que el beneficio de la negociación en las señales de RSI se maximizará. Los valores de este indicador, similares a los del indicador RSI, se muestran entre 0 y 100.
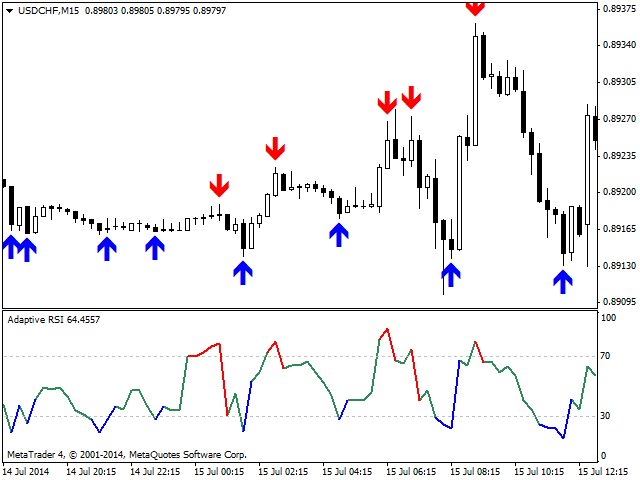
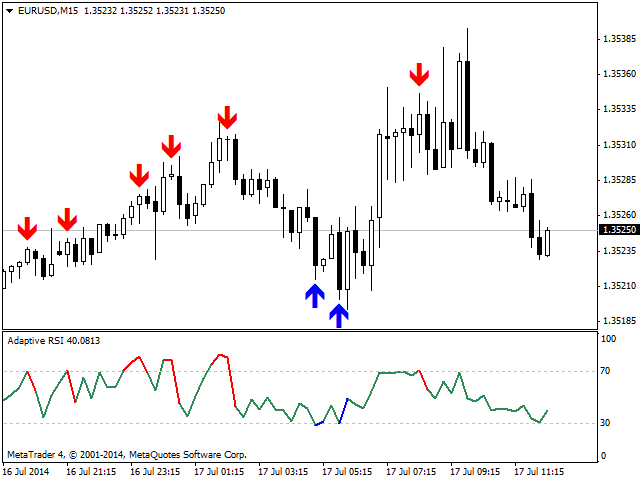
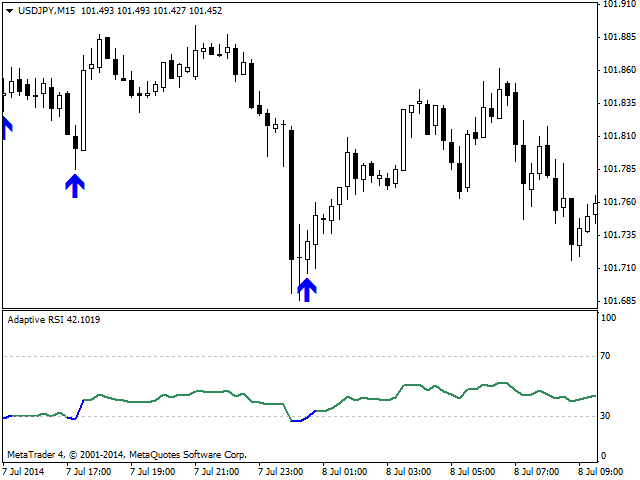
- Un valor de RSI que cae en la región de 70 a 100 de la escala se considera sobrecomprado (es decir, es el momento más probable para abrir una posición corta).
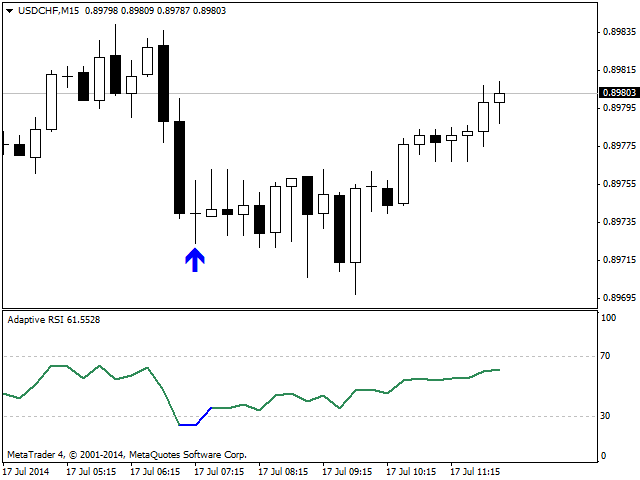
- Un valor del RSI que caiga en la región de 0 a 30 se considera sobrevendido (es decir, es el momento más probable para abrir una posición larga).
Características
- Determina automáticamente el mejor periodo del RSI para adaptarse a las condiciones actuales del mercado.
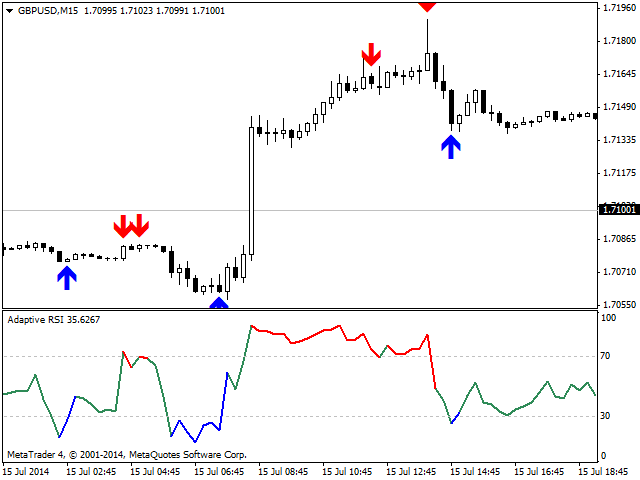
- Identifica las zonas de sobrecompra y sobreventa con mayor precisión que el indicador RSI original.
- Muestra flechas de señal de COMPRA/VENTA en el gráfico de barras. (debe estar habilitado en la configuración de entrada del indicador)
- Genera alertas para las señales.
- Resalta las áreas de sobrecompra y sobreventa con diferentes colores para facilitar su reconocimiento.
- Genera señales fiables de COMPRA/VENTA en zonas de sobreventa/sobrecompra.
- Funciona con brokers de 4 y 5 dígitos.
- Máximo de Barras a Mirar Atrás: Un número entero positivo que indica el máximo de barras pasadas, sobre las cuales los valores RSI adaptativos serán computados.
- Máximo de Barras Pasadas para Optimización: Un número entero positivo que indica el máximo de barras pasadas, sobre las cuales se realizará la optimización (para encontrar el mejor periodo RSI).
- Periodo RSI mínimo para la optimización: Un número entero positivo (mayor que cero) que indica el periodo RSI mínimo a tener en cuenta en la optimización.
- Periodo RSI máximo para la optimización: Un número entero positivo que indica el periodo RSI máximo a tener en cuenta en la optimización.
- Paso del periodo RSI para la optimización: Un número entero positivo (mayor que cero) que indica el paso incremental del periodo RSI a tener en cuenta en la optimización.
- Activar/desactivar alerta: si es verdadero, se activarán las alertas para las señales de COMPRA/VENTA.
- ¿Notificación por correo electrónico? Si se establece en true, cuando se reconozca un patrón, se enviará un email a la dirección establecida en las opciones de MetaTrader 4.
- Notificación por móvil: Si se establece en true, cuando un patrón es reconocido, el usuario recibirá una notificación push en su teléfono móvil.
- ¿Mostrar flechas de señal?: si está en true, se mostrarán flechas de COMPRA/VENTA en el gráfico de barras.
- Color de sobrecompra: El color para resaltar las zonas de sobrecompra.
- Color de Sobreventa: El color para resaltar las áreas de sobreventa.
- Ancho de línea de sobrecompra y sobreventa: Grosor de la línea para resaltar las zonas de sobrecompra y sobreventa.
- Precio aplicado: Tipo de precio aplicado para calcular el RSI (por defecto es Cerrar).
- Mostrar Periodo RSI Actual: Si es verdadero, muestra el valor optimizado actual del periodo RSI.


nice work