Three CCI and BandSqueeze for MT5
- Indicadores
- Versión: 1.1
- Activaciones: 5
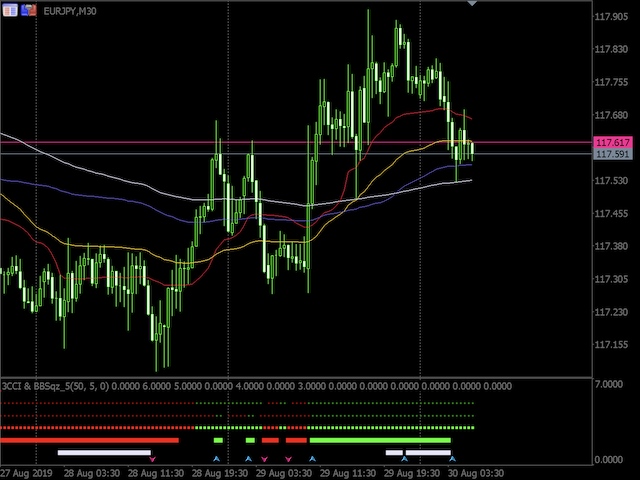
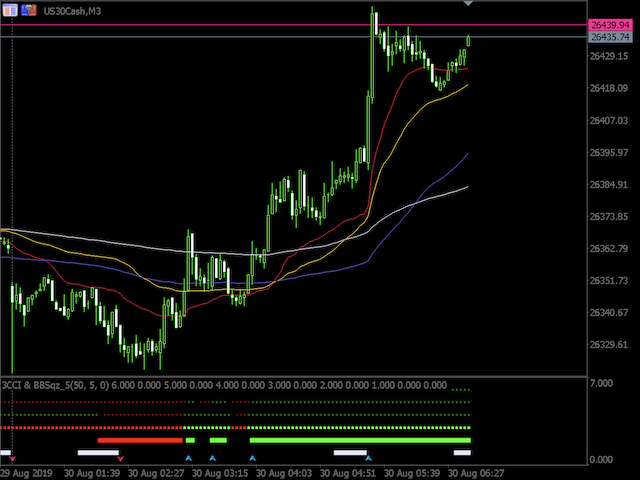
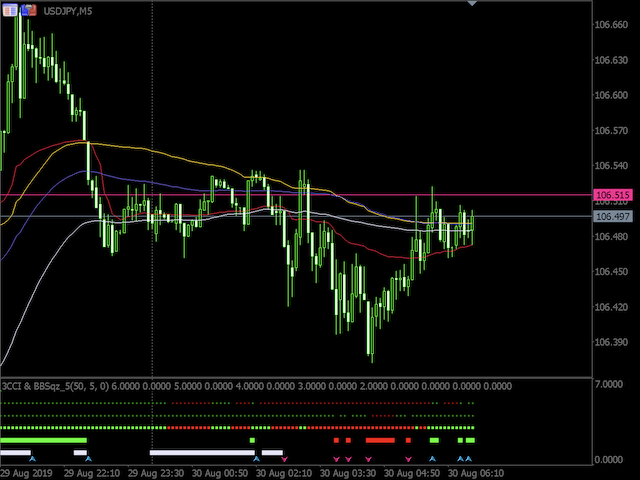
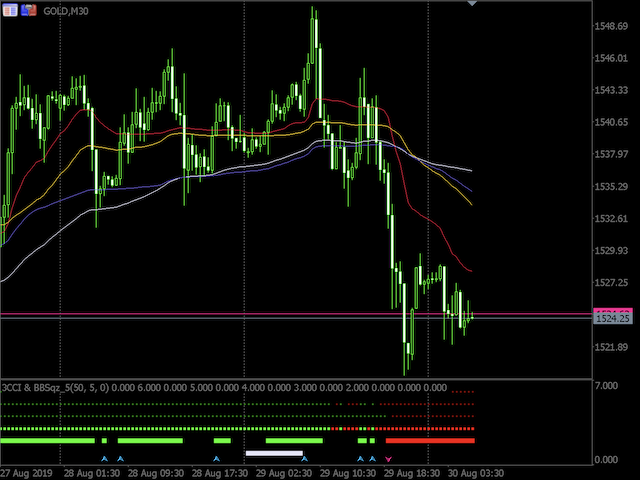
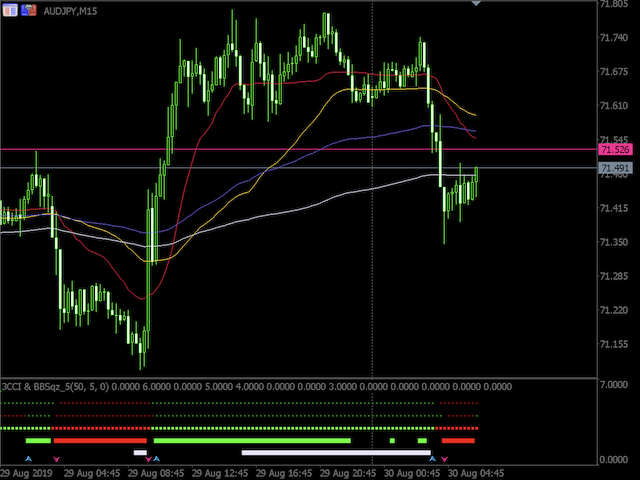
La subida y la bajada actuales se juzgan a partir del índice del canal de materias primas (CCI) de los tres ciclos y se muestran en un panel mediante un código de colores.
El segundo y el tercero de los tres ciclos se modifican en función del factor de corrección multiplicado por el primer ciclo (ciclo mínimo).
Además, cada CCI se muestra con el ATR (Average True Range) corregido por la variación.
Cuando dos de los tres CCI están completos, se muestra Trend_1.
Cuando los tres están completos, se muestra la Tendencia_2.
// ---
Squeeze se muestra cuando el ancho de las Bandas de Bollinger se vuelve extremadamente estrecho.
Ajustando el periodo de las Bandas y BandsDeviation (desviación), y las desviaciones permitidas en el pasado máximo y mínimo del ancho de banda,
Puede cambiar la visualización de la intensidad de Squeeze.
// ---
La flecha hacia arriba y la flecha hacia abajo no se muestran cuando se está produciendo Squeeze.
Se muestran de acuerdo con el estado Trend_1 al final de Squeeze y el estado Trend_2 .