Niubility RSI Fibo For MT5
- Indicadores
- Versión: 1.0
- Activaciones: 5

Niubilidad RSI y Fibo
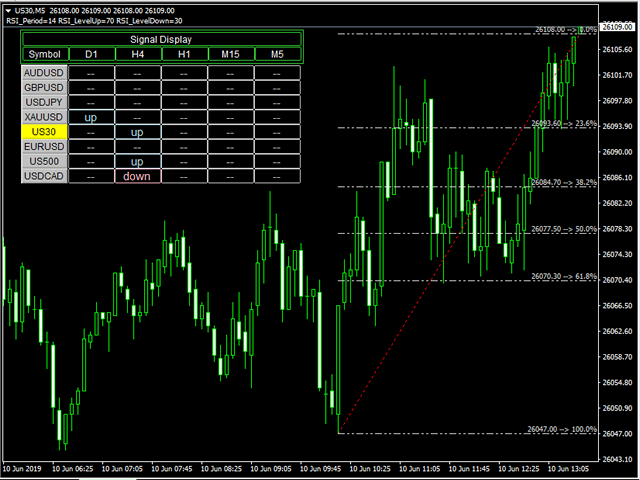
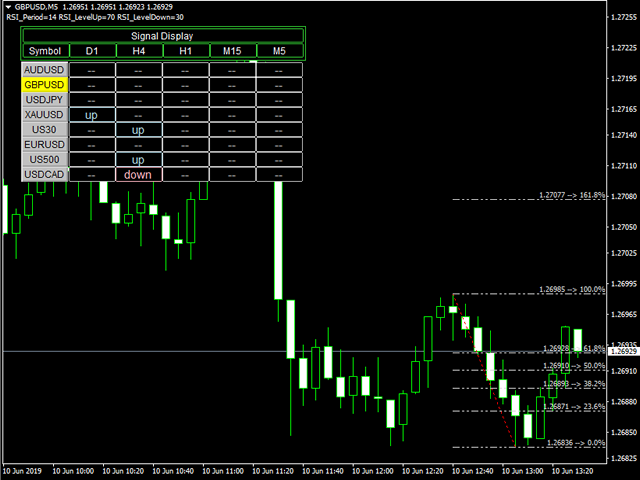
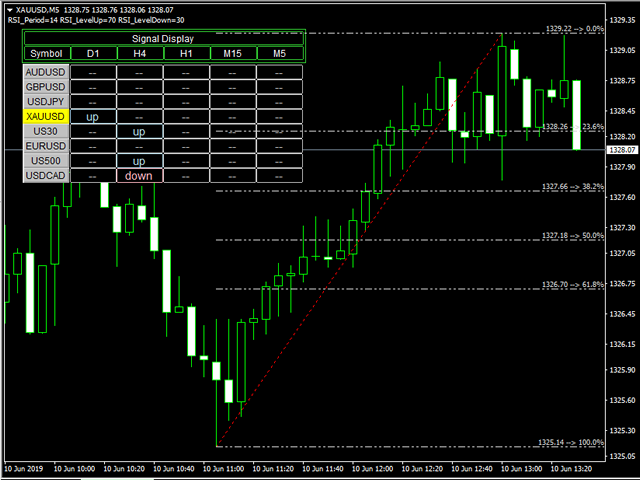
El RSI enviará una alerta cuando el valor RSI del precio llegue al nivel especificado en los ajustes.
La entrada del indicador puede permitir el cambio de período de RSI, sobrecompra y sobreventa.
El RSI funcionará para múltiples marcos de tiempo.
El RSI explorará diferentes pares.
Este Fibo está diseñado para dibujar un retroceso de Fibonacci, utilizando como base el indicador ZigZag.
Descripción:
La palabra 'up' significa tendencia alcista.
La palabra 'down' significa tendencia bajista.
La palabra "--" significa que no hay tendencia.
La palabra "ruptura roja" significa ruptura NivelAbajo.
La palabra "breakout azul" significa "breakout LevelUp".
Parámetros:
TimeFrame1: primer timeframe, por defecto D1.
TimeFrame2: segundo timeframe, por defecto H4.
TimeFrame3: tercer timeframe, valor por defecto es H1.
TimeFrame4: cuarto timeframe, por defecto M15.
TimeFrame5: quinto timeframe, por defecto M5.
Periodo_RSI: Periodo RSI.
RSI_LevelUp: Valor de RSI sobrecomprado.
RSI_LevelDown: valor RSI de sobreventa.
ShowFibo: mostrar o no mostrar Fibo.
FiboSearchBars: barras de búsqueda de fibo, el valor por defecto es 24.
LelelColor: color de la línea de nivel de fibo.