Niubility RSI Fibo For MT5
- インディケータ
- バージョン: 1.0
- アクティベーション: 5

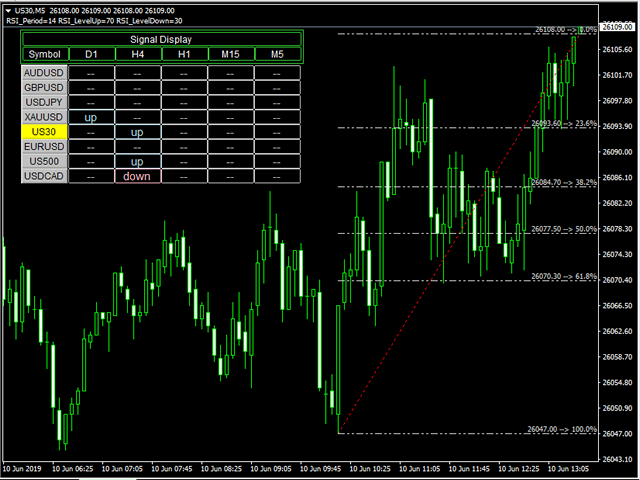
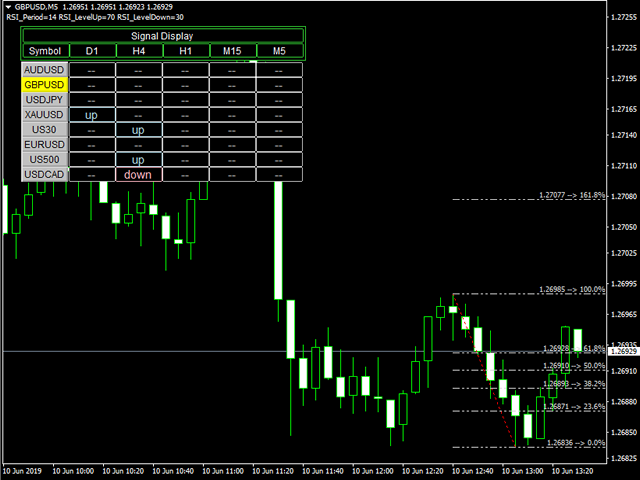
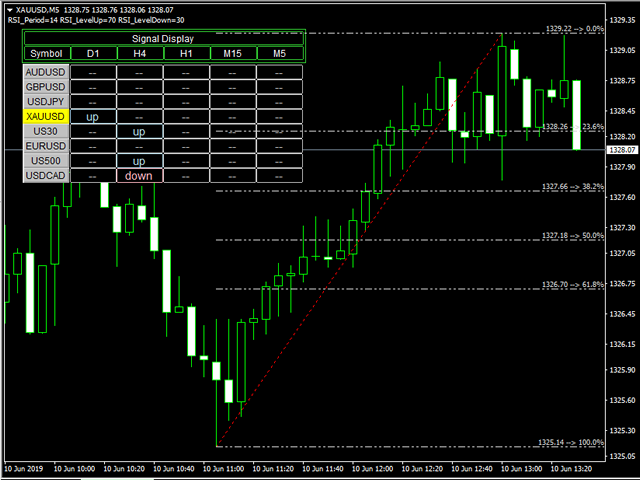
Niubility RSI and Fibo
The RSI will send an alert when the RSI value of the price gets to the level specified in the settings.
The input of the indicator can allow for change of RSI period, overbought and oversold.
The RSI will work for multi timeframe.
The RSI will scan different pairs.
This Fibo is designed to draw a Fibonacci retracement, using as a basis the ZigZag indicator.
Description:
'up' word means up trend.
'down' word means down trend.
' -- ' word means no trend.
'red breakout' words means breakout LevelDown.
'blue breakout' words means breakout LevelUp.
Parameter:
TimeFrame1: first timeframe, default value is D1.
TimeFrame2: second timeframe, default value is H4.
TimeFrame3: third timeframe, default value is H1.
TimeFrame4: fourth timeframe, default value is M15.
TimeFrame5: fifth timeframe, default value is M5.
RSI_Period: RSI period.
RSI_LevelUp: RSI value overbought.
RSI_LevelDown:RSI value oversold.
ShowFibo: show or not show Fibo.
FiboSearchBars: fibo search bars, default value is 24.
LelelColor: fibo level line color.