Heiken Ashi Levels
- Indicadores
- Versión: 1.25
- Actualizado: 24 julio 2024
- Activaciones: 7

Descripción
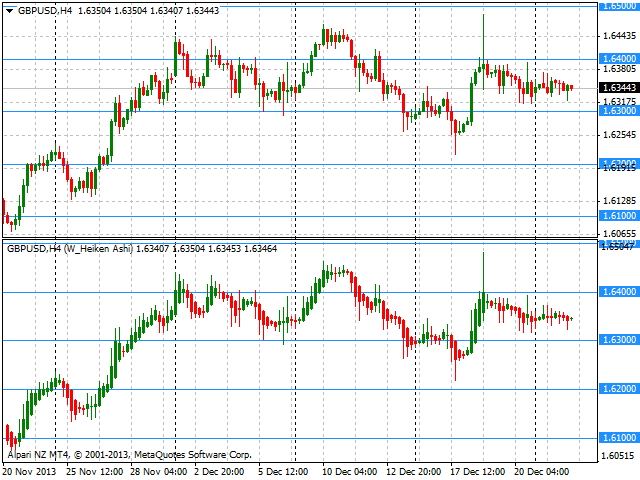
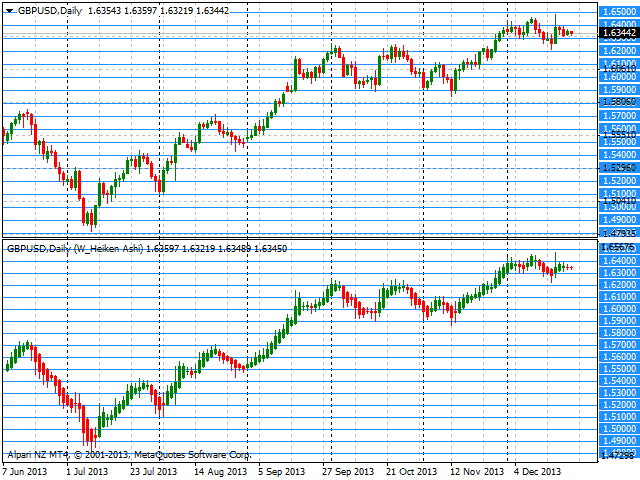
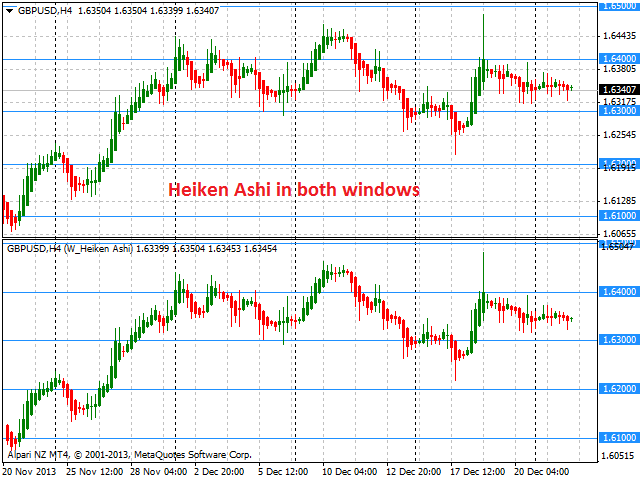
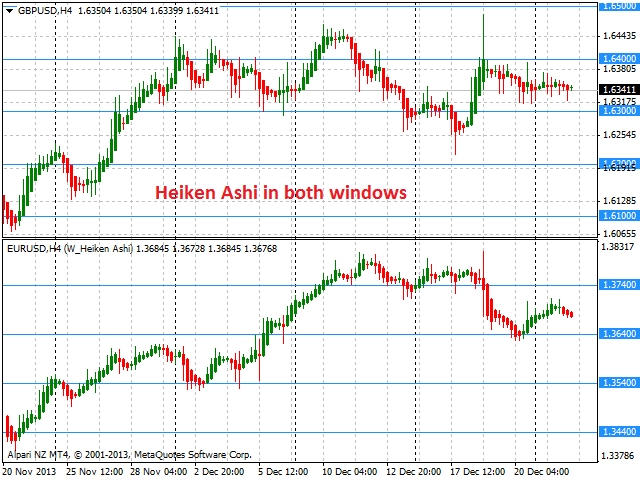
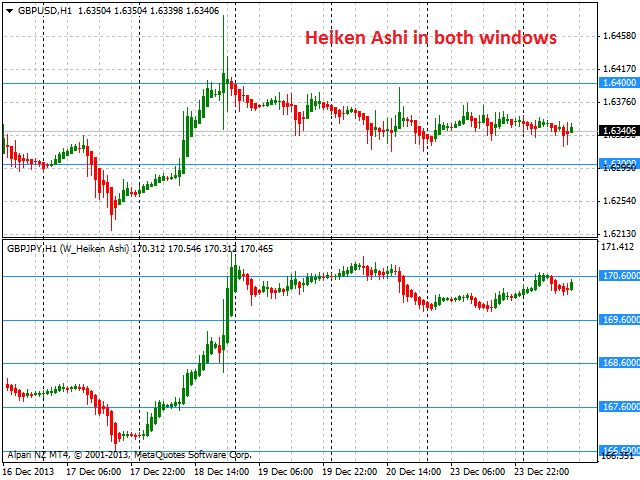
El indicador sirve para etiquetar el gráfico utilizando niveles horizontales y/o precios de media vuelta en el gráfico Heiken Ashi en una ventana separada.
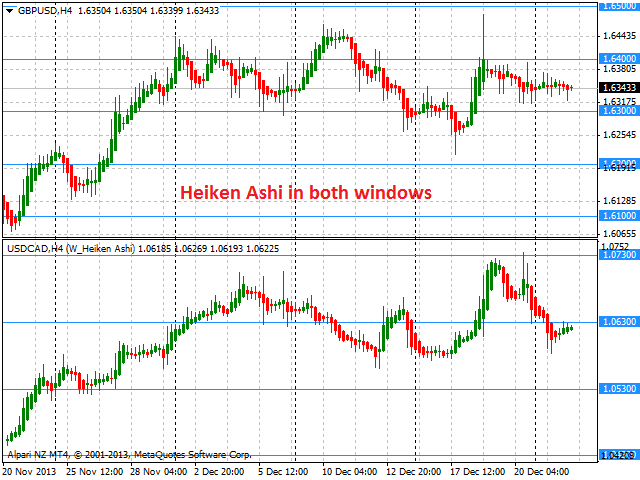
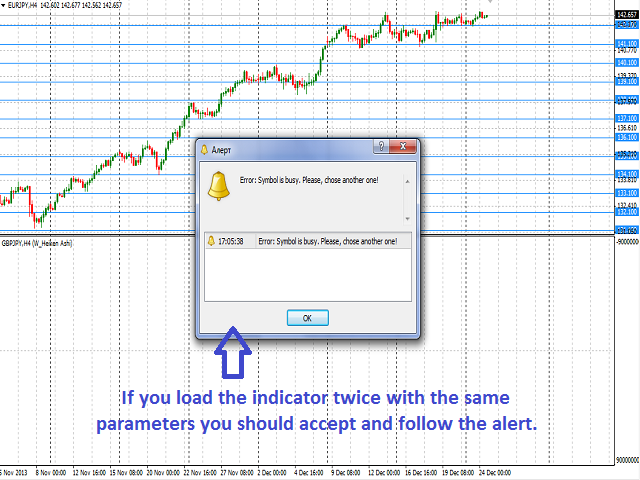
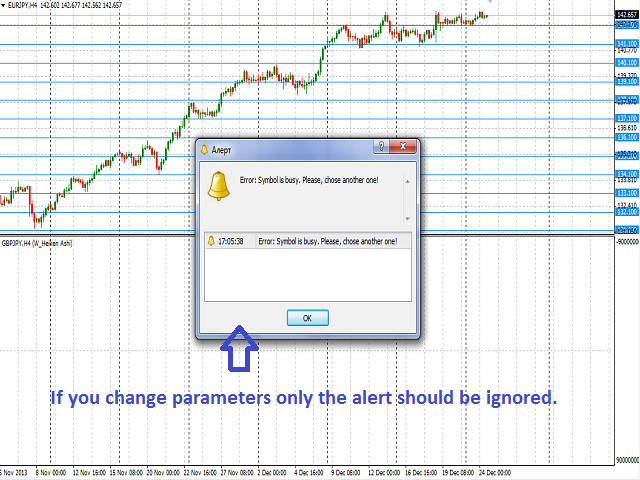
El indicador se puede utilizar con cualquier broker, independientemente del nombre del instrumento financiero, ya que es necesario introducir manualmente el nombre como parámetro de entrada. Si introduce un nombre inexistente o incorrecto de un instrumento financiero, recibirá un mensaje de error que indica que este instrumento financiero es desconocido (no existe).
El usuario puede elegir colores para las líneas del indicador.
Parámetros de entrada
- Currency_Name - nombre del instrumento financiero
- Calc_Method - método de cálculo de las líneas:
- niveles de precios redondos.
- niveles de precios de media vuelta.
- Digits_Accepted - bandera para calcular los niveles por el número de caracteres en la cotización del símbolo:
- true - considerando la importancia del número de caracteres.
- false - sin considerar la importancia del número de caracteres.
- Level_Color - color de las líneas mostradas.
- Bars_Number - número de barras para mostrar en una ventana separada.
- Bid_Line_Color - color de la línea Bid.
- Bars_Flag - indicador que permite mostrar el número de barras establecido en el parámetro Bars_Number:
- true - según Bars_Number
- false - número máximo disponible de barras en el historial
- Bulls_Color - color de la vela alcista
- Bears_Color - color de la vela bajista
Por defecto, el sistema calcula y traza los niveles de precios de media vuelta teniendo en cuenta la importancia del número de caracteres de una cotización.
Propósito
El indicador se puede utilizar para el comercio manual o automatizado dentro de un Asesor Experto. Para el trading automatizado, utilice cualquier tampón de indicador del tipo doble:
- PreciosHeiken Ashi: Low o High - buffer 2. Si el valor del buffer 2 > buffer 3, entonces el buffer 2 contiene el precio Alto, de lo contrario, el buffer 2 es igual al precio Bajo.
- PreciosHeiken Ashi: Alto o Bajo - buffer 3.
- PreciosHeiken Ashi: Apertura - buffer 4.
- PreciosHeiken Ashi: Cierre - buffer 5.
- Nivel más alto - buffer 6.
- Nivel más bajo - buffer 7.
Los niveles intermedios deben calcularse utilizando un paso que corresponda a una media vuelta o redondear los valores de los precios considerando el parámetro Digits_Accepted aceptado, así como considerando los niveles más alto y más bajo obtenidos examinando los valores de los buffers de los indicadores en la barra correspondiente.
Limitaciones
Para que el indicador funcione, debe haber al menos diez barras disponibles para el instrumento financiero. En caso contrario, mostrará un mensaje de error sugiriendo actualizar la base de datos del historial de precios.