Heiken Ashi Levels
- Indicateurs
- Version: 1.25
- Mise à jour: 24 juillet 2024
- Activations: 7

Description
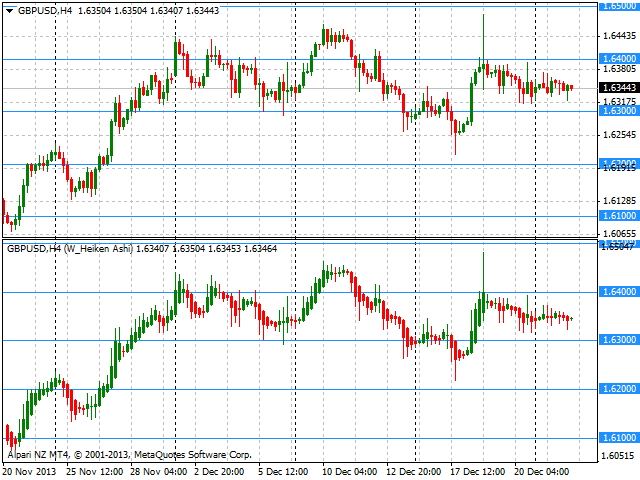
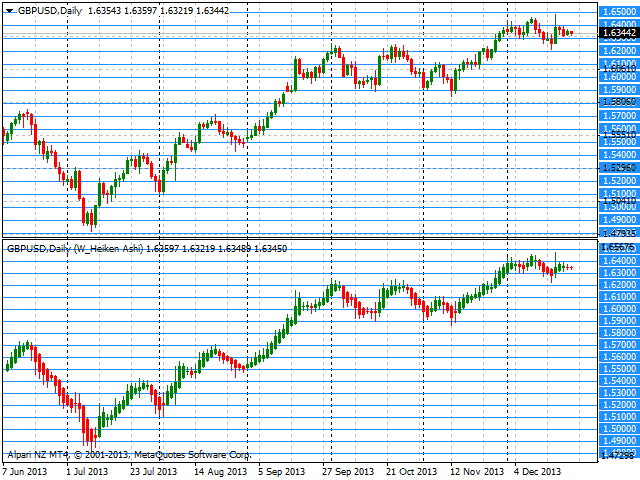
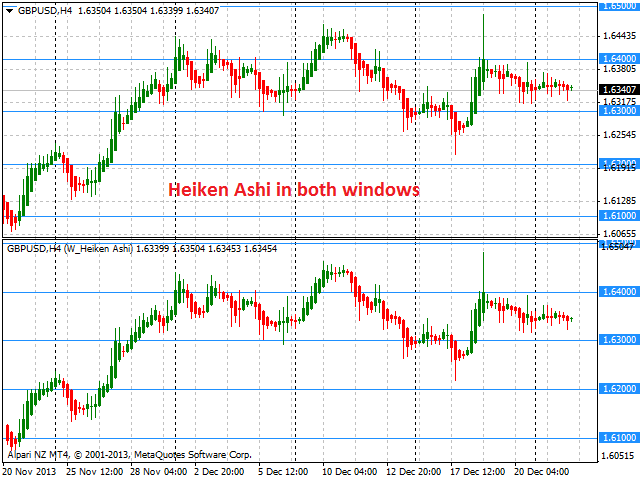
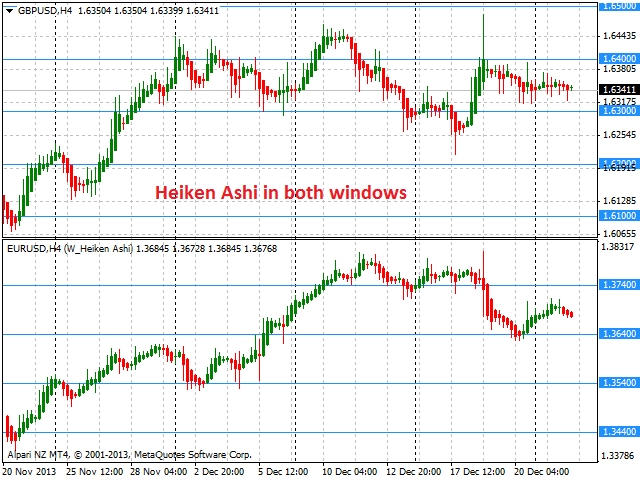
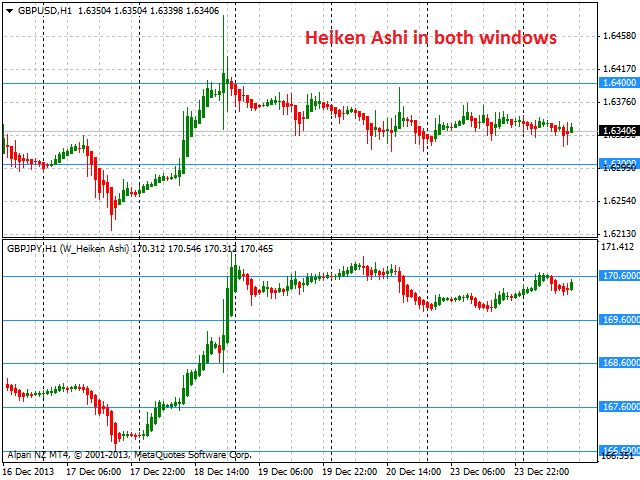
The indicator is intended for labeling the chart using horizontal levels and/or half-round prices on Heiken Ashi chart in a separate window.
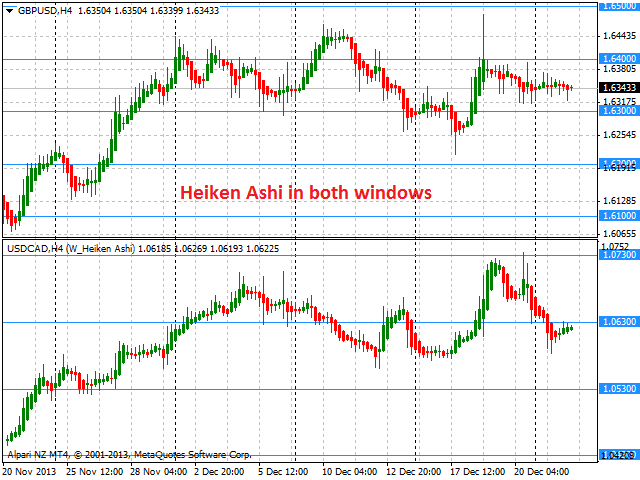
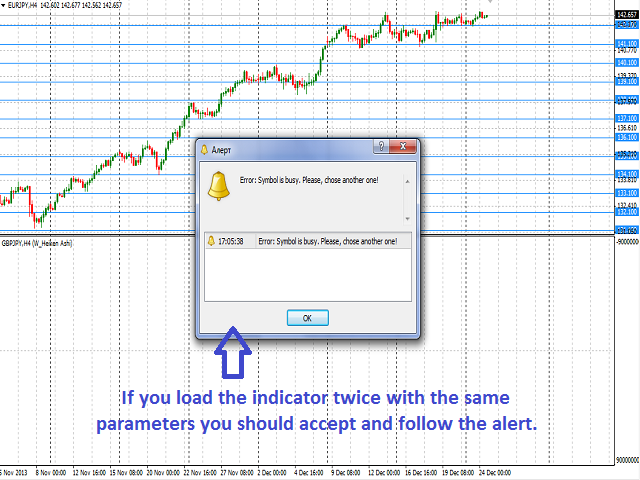
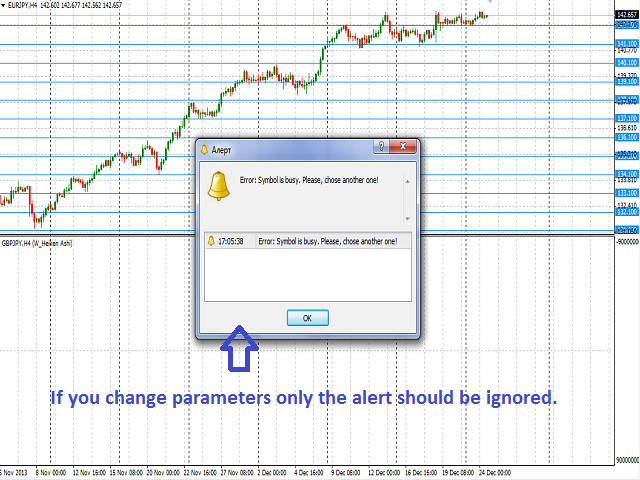
The indicator may be used with any broker, irrespective of the name of the financial instrument since it is necessary to manually enter the name as an input parameter. If you enter a non-existent or incorrect name of a financial instrument, you will receive an error message that this financial instrument is unknown (does not exist).
A user can choose colors for the indicator lines.
Input Parameters
- Currency_Name - name of the financial instrument
- Calc_Method - method of calculation of the lines:
- levels of round prices.
- levels of half-round prices.
- Digits_Accepted - flag for calculating the levels by the number of characters in the symbol's quote:
- true - considering the importance of the number of characters.
- false - without considering the importance of the number of characters.
- Level_Color - color of the lines displayed.
- Bars_Number - number of bars for displaying in a separate window.
- Bid_Line_Color - color of the Bid line.
- Bars_Flag - flag allowing display of the number of bars set in Bars_Number parameter:
- true - according to Bars_Number
- false - maximum available number of bars in history
- Bulls_Color - bullish candle color
- Bears_Color - bearish candle color
On default, the system calculates and plots the levels of half-round prices considering the importance of the number of characters in a quote.
Purpose
The indicator can be used for manual or automated trading within an Expert Advisor. For automated trading, use any indicator buffer of the double type:
- Heiken Ashi prices: Low or High - buffer 2. If the value of buffer 2 > buffer 3, then buffer 2 contains High price, otherwise, buffer 2 is equal to Low price.
- Heiken Ashi prices: High or Low - buffer 3.
- Heiken Ashi prices: Open - buffer 4.
- Heiken Ashi prices: Close - buffer 5.
- Highest level - buffer 6.
- Lowest level - buffer 7.
Intermediate levels should be calculated using a step that corresponds to a half round or round price values considering the accepted Digits_Accepted parameter, as well as considering the highest and lowest levels obtained by examining the values of the indicator buffers on the corresponding bar.
Limitations
For the indicator to work, there should be at least ten bars available for the financial instrument. Otherwise, it will show an error message suggesting to update the price history data base.