Divergence MACD
- Indicadores
- Versión: 1.3
- Actualizado: 1 diciembre 2021
- Activaciones: 7

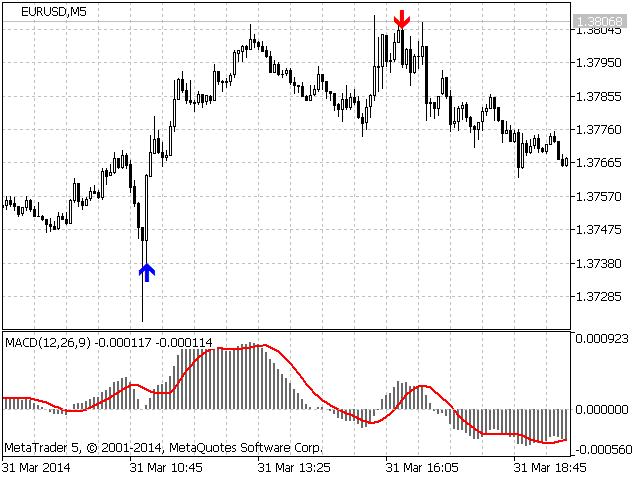
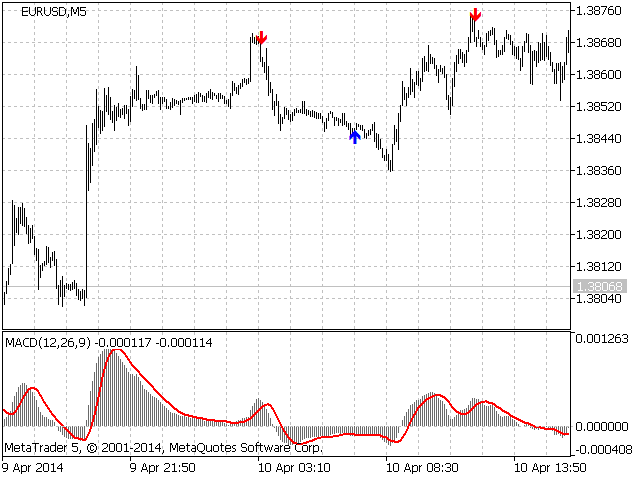
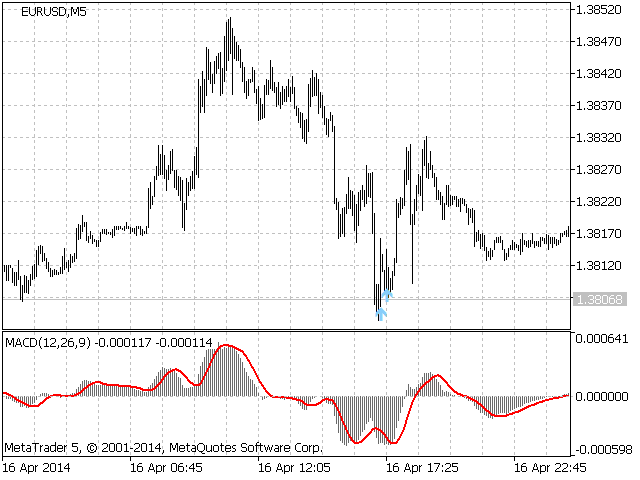
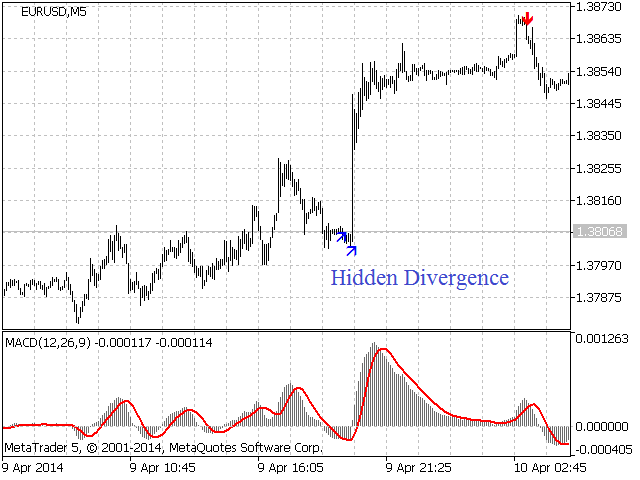
El indicadorDivergencia MACD muestra la divergencia entre el precio y el indicador MACD. ¡El indicador no se redibuja! El algoritmo de detección de los extremos del precio y del MACD ha sido equilibrado para la entrada más temprana permitiéndole utilizar la orden SL más pequeña posible.
El indicador muestra todos los tipos de divergencias, incluyendo la oculta, mientras que tiene el número mínimo de ajustes.
Más información sobre los tipos de divergencia en la pestaña Comentarios.
Ajustes de lanzamiento:
- Max Bars - número de barras calculadas en el gráfico.
- Indent Arrow - flecha de indentación.
- Signal Alert - utilizar alertas.
- Show Hidden Divergence - mostrar señales de divergencia ocultas.
- Set MACD - configuración de los parámetros del indicador MACD.
- MACD F - valor de la EMA rápida del MACD.
- MACD S - Valor de la EMA lenta del MACD.
- Price MACD - tipo de precio MACD.
- Set for comparison vertices - ajustes para definir los vértices que son iguales por nivel.
- Max deviation for similar vertices Price - la tolerancia, dentro de la cual los vértices del gráfico se consideran iguales.
- Desviación máxima para vértices similares MACD - la tolerancia, dentro de la cual los vértices del indicador se consideran iguales.
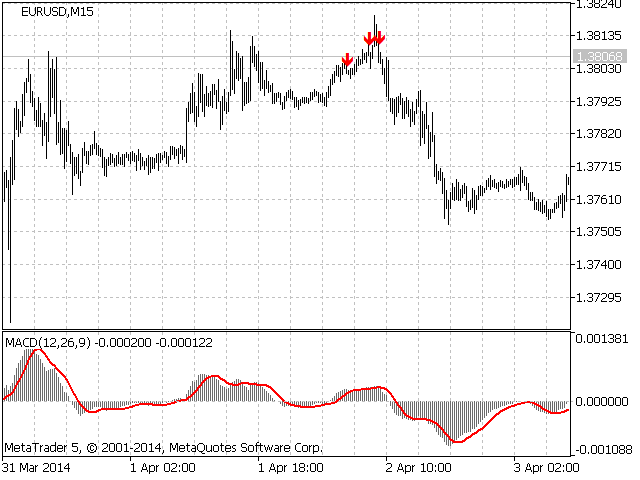
Por defecto, las tolerancias Desviación máxima para vértices similares Precio y Desviación máxima para vértices similares MACD han sido optimizadas para el marco temporal M5. Es posible que tenga que aumentar ligeramente las tolerancias para marcos temporales más grandes.