Divergence MACD
- Indikatoren
- Version: 1.3
- Aktualisiert: 1 Dezember 2021
- Aktivierungen: 7

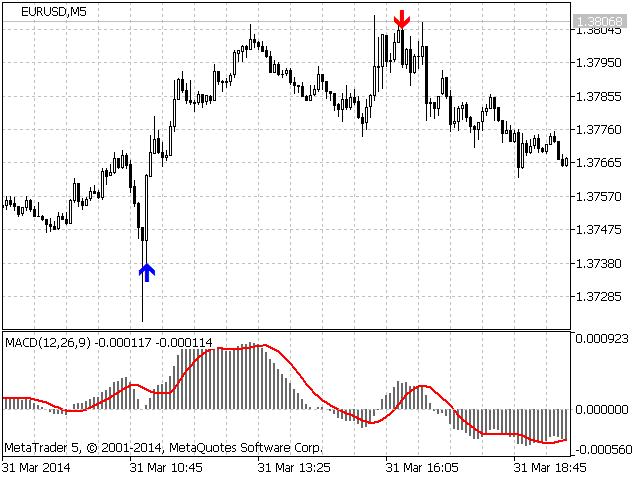
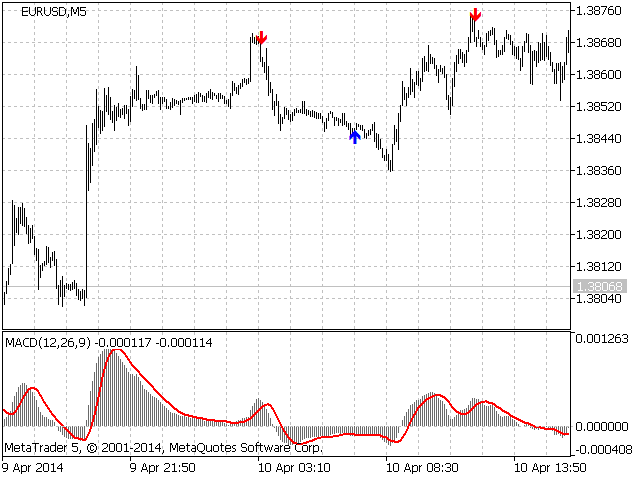
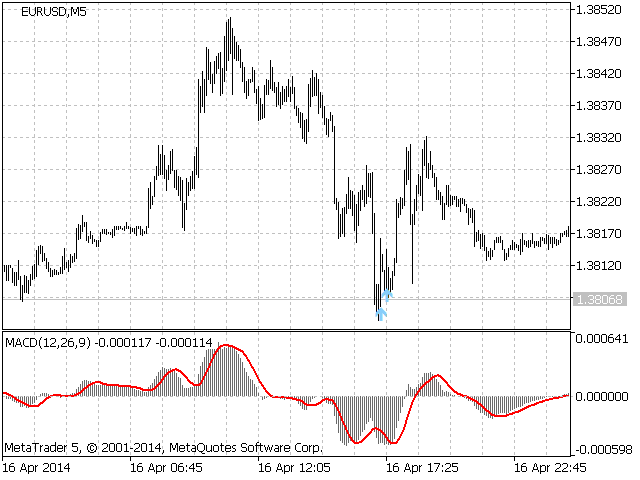
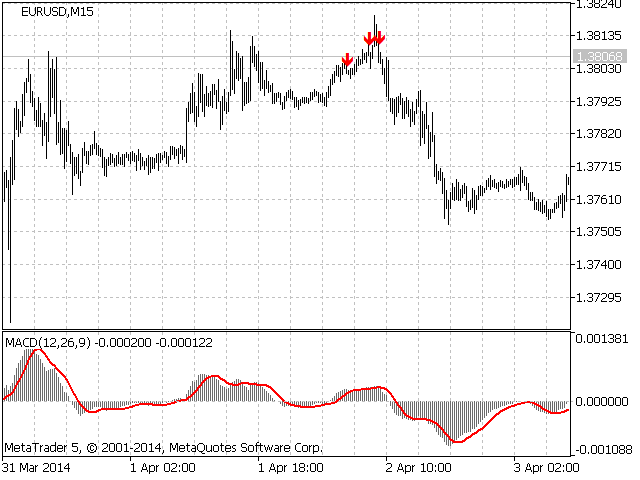
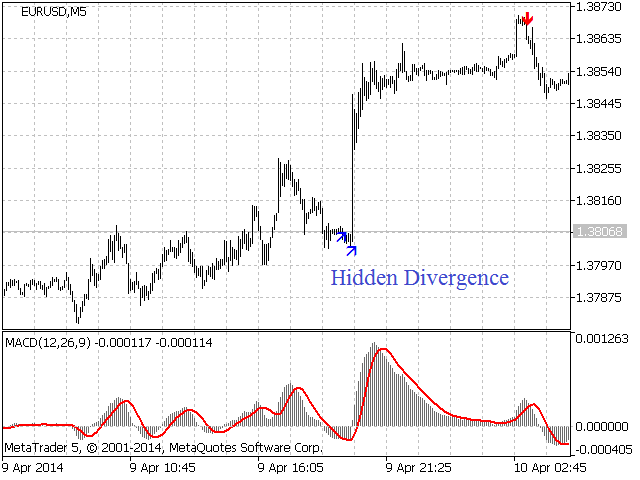
DerDivergenz-MACD-Indikator zeigt die Divergenz zwischen Preis und MACD-Indikator an. Der Indikator wird nicht neu gezeichnet! Der Algorithmus zur Erkennung von Preis- und MACD-Extremen wurde für den frühestmöglichen Einstieg ausgeglichen, so dass Sie die kleinstmögliche SL-Order verwenden können.
Der Indikator zeigt alle Arten von Divergenzen an, einschließlich der versteckten Divergenzen, und benötigt dabei nur eine minimale Anzahl von Einstellungen.
Weitere Informationen zu den Divergenztypen finden Sie auf der Registerkarte Kommentare.
Start-Einstellungen:
- Max Bars - Anzahl der Bars, die auf dem Chart berechnet werden.
- Pfeil einrücken - Pfeil einrücken.
- Signal Alert - Alarme verwenden.
- Versteckte Divergenz anzeigen - zeigt versteckte Divergenzsignale an.
- MACD einstellen - Einstellung der Parameter des MACD-Indikators.
- MACD F - MACD schneller EMA-Wert.
- MACD S - MACD langsamer EMA-Wert.
- MACD Preis - MACD Preistyp.
- Set for comparison vertices - Einstellungen für die Definition der Scheitelpunkte, die durch das Niveau gleich sind.
- Maximale Abweichung für ähnliche Scheitelpunkte Preis - die Toleranz, innerhalb derer die Chart-Scheitelpunkte als gleich angesehen werden.
- Maximale Abweichung für ähnliche Scheitelpunkte MACD - die Toleranz, innerhalb derer die Indikator-Scheitelpunkte als gleich angesehen werden.
Standardmäßig wurden die Toleranzen für die maximale Abweichung für ähnliche Scheitelpunkte Preis und die maximale Abweichung für ähnliche Scheitelpunkte MACD für den M5-Zeitrahmen optimiert. Möglicherweise müssen Sie die Toleranzen für größere Zeitrahmen leicht erhöhen.