Divergence MACD

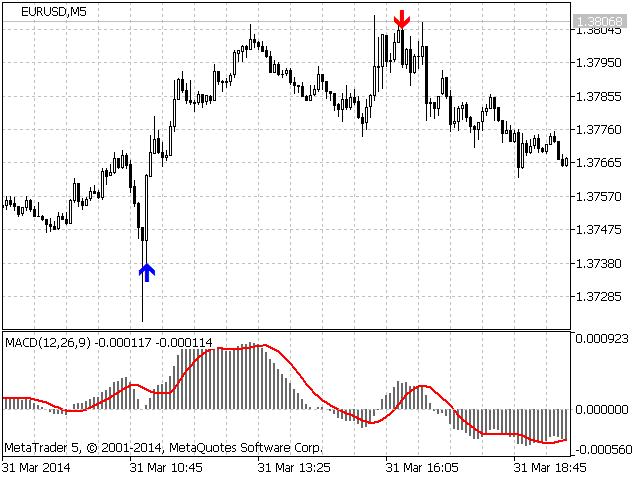
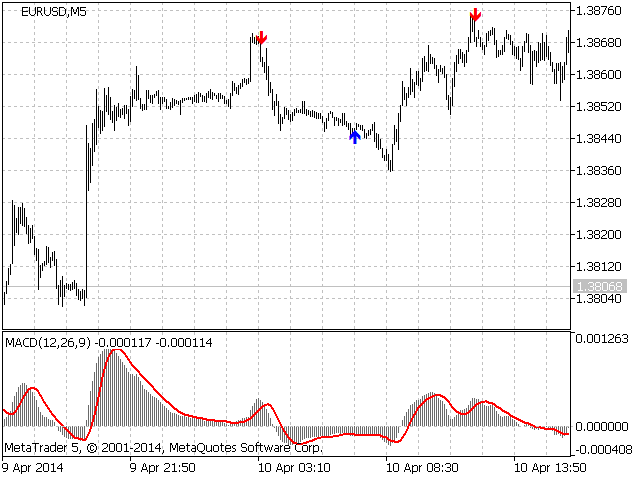
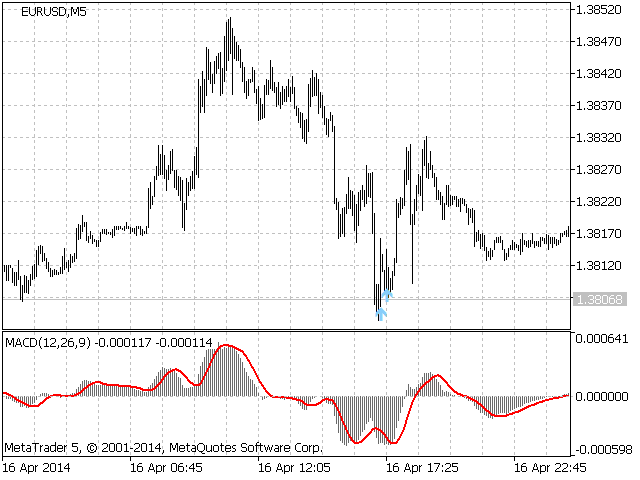
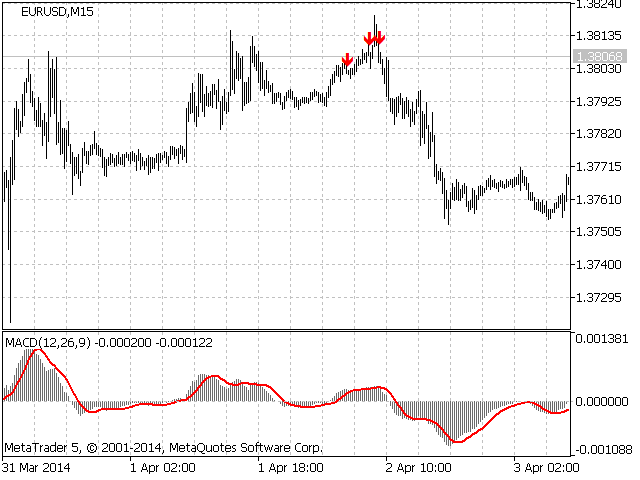
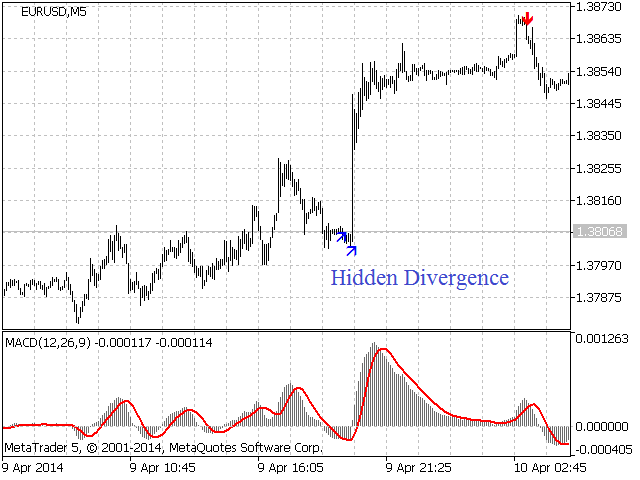
Divergence MACD indicator shows price and MACD indicator divergence. The indicator is not redrawn! The algorithm for detection of price and MACD extremums has been balanced for the earliest entry allowing you to use the smallest SL order possible.

The indicator displays all types of divergences including the hidden one, while having the minimum number of settings.

Find out more about the divergence types in Comments tab.

Launch settings:

  • Max Bars - number of bars calculated on the chart.
  • Indent Arrow - arrow indent.
  • Signal Alert - use alerts.
  • Show Hidden Divergence - show hidden divergence signals.
  • Set MACD - MACD indicator parameters settings.
  • MACD F - MACD fast EMA value.
  • MACD S - MACD slow EMA value.
  • Price MACD - MACD price type.
  • Set for comparison vertices - settings for defining the vertices that are equal by level.
  • Max deviation for similar vertices Price - the tolerance, within which the chart vertices are considered to be the same.
  • Max deviation for similar vertices MACD - the tolerance, within which the indicator vertices are considered to be the same.
By default, Max deviation for similar vertices Price and Max deviation for similar vertices MACD tolerances have been optimized for M5 timeframe. You may need to slightly increase the tolerances for larger timeframes.
추천 제품
The indicator detects and displays М. Gartley's Butterfly pattern. The pattern is plotted by the extreme values of the ZigZag indicator (included in the resources, no need to install). After detecting the pattern, the indicator notifies of that by the pop-up window, a mobile notification and an email. The pattern and wave parameters are displayed on the screenshots. The default parameters are used for demonstration purposes only in order to increase the amount of detected patterns. Parameters z
Trend Lines Scalper
Magdalena Estefania Colonna
TREND LINES Scalper Professional Indicator OVERVIEW Trend Lines Scalper is a highly accurate, advanced indicator designed specifically for professional traders looking to maximize their scalping opportunities by automatically detecting trend lines and high-probability signals. This powerful algorithm combines classic technical analysis with modern technology, automatically identifying price patterns and generating accurate, real-time signals for successful scalping trades. MAIN FEATURES
The   Trendlines Oscillator   helps traders identify trends and momentum based on the normalized distances between the current price and the most recently detected bullish and bearish trend lines. The indicator features bullish and bearish momentum, a signal line with crossings, and multiple smoothing options. USAGE The   Trendlines Oscillator   works by systematically: Identifying pivot highs and lows. Connecting pivots to form bullish (support) and bearish (resistance) trendlines. Measuring
JAC Trend Color Candle
Eduardo Da Costa Custodio Santos
The indicator "JAC Trend Color Candle" for Meta Trader 5, was created to visually facilitate the trend for the trader. It is based on three parameters, which identifies the uptrend, downtrend and non-trending market. The colors are trader-configurable, and the average trader-configurable as well. trend parameters cannot be configured as they are the indicator's differential.
SMMA Bands Indicator
Elie Baptiste Granger
The SMMA Bands indicator is an advanced volatility-based trading tool that creates 6 dynamic support and resistance levels around an envelope formed by two Smoothed Moving Averages (SMMA).  This indicator combines the reliability of SMMA trend identification with the precision of standard deviation-based volatility bands, making it suitable for both trend-following and mean-reversion strategies. Every band has its own buffer for use in EA. feel free to make suggestions and add reviews , i will
Follow The Line MT5
Oliver Gideon Amofa Appiah
4.6 (35)
This indicator obeys the popular maxim that: "THE TREND IS YOUR FRIEND" It paints a GREEN line for BUY and also paints a RED line for SELL. (you can change the colors). It gives alarms and alerts of all kinds. IT DOES NOT REPAINT and can be used for all currency pairs and timeframes. Yes, as easy and simple as that. Even a newbie can use it to make great and reliable trades. NB: For best results, get my other premium indicators for more powerful and reliable signals. Get them here: https://www.m
FREE
The Zero-Lag MA Trend Levels indicator combines a Zero-Lag Moving Average (ZLMA) with a standard Exponential Moving Average (EMA) to provide a dynamic view of the market trend. This indicator automatically plots the EMA and ZLMA lines on the chart. The colors of the lines represent the market trend. With EMA: ++ green (uptrend) when EMA > zlma ++ red (downtrend) when EMA < zlma With ZLMA: ++ green (uptrend) when the line is trending up ++ red (downtrend) when the line is trending down When th
Order Book, known also as Market Book, market depth, Level 2, - is a dynamically updated table with current volumes of orders to buy and to sell specific financial instument at price levels near Bid and Ask. MetaTrader 5 provides the means for receiving market book from your broker, but in real time only, without access to its history. The indicator OrderBook Cumulative Indicator accumulates market book data online and visualizes them on the chart. In addition, the indicator can show the market
FOTSI Indicator
Leonardo Daniel Isaia
1 (1)
FOTSI – 외환 진정 강도 지수 개요 각 통화의 진정한 강도를 발견하고 우위를 가지고 거래하세요. FOTSI 지표 는 모든 주요 통화(USD, EUR, GBP, JPY, CHF, AUD, CAD, NZD)의 실제 모멘텀을 모든 통화쌍에서 측정하는 다중 통화 오실레이터 입니다. 단일 차트를 분석하는 대신, FOTSI는 여러 통화쌍의 데이터를 결합하고 움직임을 평활화하며, True Strength Index (TSI) 알고리즘을 적용하여 각 통화의 상대적 강도를 명확하고 안정적이며 지연 없이 제공합니다. 주요 특징 다중 통화 오실레이터: 각 통화의 강도를 독립적으로 측정합니다. 과매수 및 과매도 수준: +50 → 통화 과매수 (조정 확률 높음). –50 → 통화 과매도. ±25 → 중립 영역. 간단한 해석: 0 이상/이하 곡선 = 강도/약점. 리페인트 없음: 모든 계산은 실시간으로 수행되며 안정적입니다. 모든 통화쌍과 시간 프레임에서 호환: 신뢰성을 위해 H1, H4, D1 권장.
All about time and price by ICT. This indicator provides a comprehensive view of ICT killzones, Silver Bullet times, and ICT Macros, enhancing your trading experience.  In those time windows price either seeks liquidity or imbalances and you often find the most energetic price moves and turning points. Features: Automatic Adaptation: The ICT killzones intelligently adapt to the specific chart you are using. For Forex charts, it follows the ICT Forex times: In EST timezone: Session: Asia: 20h00-0
Combined
Ahmed Alaaeldin Abdulrahman Ahmed Elherzawi
5 (1)
Welcome to Investment Castle products This product is exclusively available in the MQL5 market and is not available and will not be available anywehere else. The Combined indicator is a multi-time frame indicator and it is built using 3 indicators: Bands indicator which draws the support and resistance key levels using up to 5 different time frames Patterns indicator which draws the chart patterns using up to 6 different time frames Spots indicator which shows the common candlestick patterns Yo
Donchian Channel DC
Renato Takahashi
Donchian Channel DC is the indicator of Donchian Channels, that plots maximum and minimum values of a specific period, besides mean value line. It´s possible to configure simple period for analysis and the indicator will plot all three values. You can trade with this indicator as trend or reversal, according to each strategy. Do not let to test others indicators as soon as others expert advisors.
LT Rainbow Trend
Thiago Duarte
5 (1)
Do you, like me, like to trade with the trend? Then this indicator will help you! Rainbow Trend is a trend indicator, which uses several Moving Averages on the chart. It measures different trend strenght zones for different periods: very long term, long term, mid term, short term and very short term. Each zone has its color, and it is possible to have sound alert when the prices leaves a zone and enters another. Its configuration is very simple. If you find any bug or have any suggestions, conta
HMA Color with Alerts MT5
Pavel Zamoshnikov
4.75 (56)
Hull Moving Average (HMA) is well-deservedly popular among traders because of the effective averaging of market noise and a relatively small delay. The current MetaTrader 5 version changes its color when the movement direction changes. Sound and text signals are available. It also supports sending email and push messages. It is possible to trigger a signal on the current incomplete bar, although such a signal may be canceled before completion if conditions are no longer appropriate. One of the p
FREE
Renko System
Marco Montemari
This indicator can be considered as a trading system. It offers a different view to see the currency pair: full timeless indicator, can be used for manual trading or for automatized trading with some expert advisor. When the price reaches a threshold a new block is created according to the set mode. The indicator beside the Renko bars, shows also 3 moving averages. Features renko mode median renko custom median renko 3 moving averages wicks datetime indicator for each block custom notification
All Power In One MT5
Ashkan Hazegh Nikrou
*제품의 현재 가격은 한정된 시간 동안 49$, All Power In One 의 다음 가격은 99$입니다.* All Power In One (APIO) 지표 All Power In One (APIO) 지표는 USD, EUR, GBP 등 주요 통화의 강도를 평가하기 위해 설계된 강력한 도구입니다. APIO는 선택 가능한 다양한 시간 프레임에서 여러 통화쌍의 움직임과 방향을 분석하여 트레이더에게 통화 강도와 잠재적인 거래 기회에 대한 명확한 통찰을 제공합니다. APIO의 MT4 버전이 제공됩니다. 아래 링크를 통해 MT4 버전을 확인하십시오 :  https://www.mql5.com/en/market/product/129225 이 지표를 사용하여 얻는 것은 무엇인가요?  각 통화의 실시간 강도 :  USD, EUR, GBP 등 각 통화의 실시간 강도를 모니터링합니다. 최고의 매수 기회 목록 :     매수 측에서 거래를 진행할 수 있는 최고의 기회를 제공하는 통화쌍 목록입니다. 최고
This indicator is a zero-lag indicator and displays  strength of trend change . True Trend  Oscillator Pro works best in combination with True Trend Moving Average Pro that displays exact trend as is. Oscillator value is exact price change in given direction of the trend. True Trend Moving Average Pro: https://www.mql5.com/en/market/product/103586 If you set PERIOD input parameter to 1 this indicator becomes a sharpshooter for binary options. Developers can use True Trend Oscillator in Exper
FREE
Important Lines
Terence Gronowski
4.87 (23)
This indicator displays Pivot-Lines, preday high and low, preday close and the minimum and maximum of the previous hour. You just have to put this single indicator to the chart to have all these important lines, no need to setup many single indicators. Why certain lines are important Preday high and low : These are watched by traders who trade in a daily chart. Very often, if price climbs over or falls under a preday low/high there is an acceleration in buying/selling. It is a breakout out of a
FREE
Индикатор iVeles_Perfect_Oscilator является опережающим и одним из самых лучших осциляторов на сегодняшний день,  использует специализированный расчет текущих цен графика.  Очень качественно и своевременно показывает смену направления, очень точный подход к уровням перекупленности и перепроданности, что позволяет своевременно принять решение по сделке.  Работает качественно на любом ТФ и с любым инструментом. Параметры: Period - период расчетов Average  - усреднение  МА Method - применяемый мето
Silver Zebra Trading System
AL MOOSAWI ABDULLAH JAFFER BAQER
Silver Zebra Trading System - Uncover Market Momentum Unlock a powerful new way to visualize market trends and momentum with the Silver Zebra Trading System. This unique MetaTrader 5 indicator is designed to give you a clear and immediate understanding of market dynamics, helping you make more informed trading decisions. For just $30, you can add this indispensable tool to your trading arsenal. What is the Silver Zebra Trading System? The Silver Zebra Trading System is a sophisticated indicator
Rainbow Collection
Minh Truong Pham
Slopes are an increasingly key concept in Technical Analysis. The most basic type is to calculate them on the prices, but also on technical indicators such as moving averages and the RSI. In technical analysis, you generally use the RSI to detect imminent reversal moves within a range. In the case of the Blue indicator, we are calculating the slope of the market price and then calculating the RSI of that slope in order to detect instances of reversal. The Blue indicator is therefore used as
SlopeChannelB MT5
MIKHAIL VINOGRADOV
SlopeChannelB – 경사진 가격 이동 채널을 구축하는 기술 분석 도구로, 시장 현황을 평가하고 거래 신호를 찾는 데 독특한 기회를 제공합니다. 지표의 주요 특징: 경사진 가격 이동 채널 : 이 지표는 지지와 저항 수준을 시각화하는 데 도움을 주며, 이는 추세의 반전 또는 지속 가능성을 나타낼 수 있습니다. 다양한 선 색상 및 배경 강조 : 경사진 지지 및 저항 수준은 다양한 색상으로 표시되며, 채널 자체는 배경이 추가로 강조되어 차트의 시각적 분석을 단순화합니다. 선 계산을 위한 세 가지 옵션 : 지표는 회귀 분석을 사용하여 채널 라인을 구성합니다. 세 가지 방법 중 하나를 선택할 수 있습니다: Robust (기본값) – 이상치에 강한 방법입니다. OLS (최소제곱법) . Median (중앙값 계산) . 최적의 모델 선택 : SlopeChannelB는 다섯 가지 품질 기준의 분석을 기반으로 가장 적합한 채널 라인 변형을 자동으로 선택합니다. 품질 매개변수는 차트에
Ichimoku Aiko MTF
Michael Jonah Randriamampionontsoa
Ichimoku Aiko MTF is a collection of technical indicators that show support and resistance levels, as well as momentum and trend direction. It is a multi-timeframe indicator so you don't need to change the chart timeframe when you want to see the ichimoku clouds on a higher timeframe.  eg. The chart timeframe is M15 and you want to see on the M15 timeframe chart the H1 ichimoku indicators (the ichimoku in Metatrader can't do that) that's why you need to use Ichimoku Aiko MTF.
Ichimoku MTF
Hoang Ngoc Thach
MTF Ichimoku is a MetaTrader 5 indicator based on well known Ichimoku. In MetaTrader 5 we have Ichimoku already included as a standard technical indicator. However it can be used only for the current timeframe. When we are looking for a trend, it is very desirable to have Ichimokuis showing higher timeframes. MTF Ichimoku presented here has additional parameter - TimeFrame. You can use it to set up higher timeframe from which Ichimokuis will calculate its values. Other basic parameters are not c
Gino Renko
Stephane, Andr Valette
1 (1)
Another renko-based indicator. It returns different usable values ​​for an EA, and is directly displayed on the main chart. Its setting is very simple: The size of the renko The number of bars taken into account The falling color The color on the rise Returned values: Buffer 0 : Value of the middle Buffer 1 : Value of the Top Buffer 2 : Value of the Bottom Buffer 3 : Direction of renko (0.0 for top ; 1.0 for bottom) Buffer 4 : Ratio of the renko, for example, if it is twice, 3 times, ro more of
Hi Low Last Day
Igor Vishnevskii
The Hi Low Last Day ( Hi Lo Last Day ) indicator shows the high and low of the last trading day and the second trading day, as well as the minimum and maximum of last week . There are many trading strategies on the daily levels. This indicator is indispensable when using such trading strategies. In fact, everything is simple in trading, you just need to understand and accept it for yourself. There is only price!!! What is price? This is the level on the chart. The level is the price that the buy
Multi-timeframe trend indicator based on the ADX / ADXWilder indicator with Fibonacci levels The indicator shows trend areas using ADX or ADXWilder indicator data from multiple timeframes. The impulse mode of the indicator allows you to catch the beginning of a trend, and several "Screens" with different timeframes allow you to filter out market noise. Fibonacci levels are added to the price chart, which have flexible settings. How the indicator works: if PDI is greater than NDI, then   it`s
FREE
Owl Smart Levels MT5
Sergey Ermolov
4.03 (32)
MT4 버전  |  FAQ Owl Smart Levels Indicator 는 Bill Williams 의 고급 프랙탈, 시장의 올바른 파동 구조를 구축하는 Valable ZigZag, 정확한 진입 수준을 표시하는 피보나치 수준과 같은 인기 있는 시장 분석 도구를 포함하는 하나의 지표 내에서 완전한 거래 시스템입니다. 시장과 이익을 취하는 장소로. 전략에 대한 자세한 설명 표시기 작업에 대한 지침 고문-거래 올빼미 도우미의 조수 개인 사용자 채팅 ->구입 후 나에게 쓰기,나는 개인 채팅에 당신을 추가하고 거기에 모든 보너스를 다운로드 할 수 있습니다 힘은 단순함에 있습니다! Owl Smart Levels 거래 시스템은 사용하기 매우 쉽기 때문에 전문가와 이제 막 시장을 연구하고 스스로 거래 전략을 선택하기 시작한 사람들 모두에게 적합합니다. 전략 및 지표에는 눈에 보이지 않는 비밀 공식 및 계산 방법이 없으며 모든 전략 지표는 공개되어 있습니다. Owl Smart Levels를 사
Flex Channel MT5
Aleksandrs Butrims
Flex channel - indicator plots channel using Hodrick-Prescott filter. Hodrick-Prescott filter is the method of avreaging time series to remove its cycling componets and shows trend. Settings HP Fast Period - number of bars to calculate fast moving average HP Slow Period - number of bars to calculate slow moving average Additional information in the indicator Channel width - channel width in pips at first bar MA position - fast moving average position in the channel in persentage Close position -
Size Bars
Viktor Loginov
Size Bars – индикатор отображает на графике максимальный, минимальный, текущий и средний размер баров (свечей) за выбранный период. Отображаемые параметры индикатора Size Bars: 1)       Текущий размер бара в писах (по максимум/минимум, тело бара). 2)       Максимальный, минимальный и средний размер свечей BUY . 3)       Максимальный, минимальный, средний размер свечей SELL . 4)       Количество свечей BUY и количество свечей SELL . 5)       Среднее количество свечей подряд BUY и SELL . 6)     
이 제품의 구매자들이 또한 구매함
이 지표를 구매하면 제 프로페셔널 트레이드 매니저를 무료로 드립니다. 우선 이 거래 시스템이 리페인팅, 리드로잉 및 레이그 인디케이터가 아니라는 점을 강조하는 것이 중요합니다. 이는 수동 및 로봇 거래 모두에 이상적인 것으로 만듭니다. 온라인 강좌, 설명서 및 프리셋 다운로드. "스마트 트렌드 트레이딩 시스템 MT5"은 새로운 및 경험이 풍부한 트레이더를 위해 맞춤형으로 제작된 종합적인 거래 솔루션입니다. 10개 이상의 프리미엄 인디케이터를 결합하고 7개 이상의 견고한 거래 전략을 특징으로 하여 다양한 시장 조건에 대한 다목적 선택이 가능합니다. 트렌드 추종 전략: 효과적인 트렌드 추이를 타기 위한 정확한 진입 및 손절 관리를 제공합니다. 반전 전략: 잠재적인 트렌드 반전을 식별하여 트레이더가 범위 시장을 활용할 수 있게 합니다. 스캘핑 전략: 빠르고 정확한 데이 트레이딩 및 단기 거래를 위해 설계되었습니다. 안정성: 모든 인디케이터가 리페인팅, 리드로잉 및 레이그가 아니므로 신뢰
Divergence Bomber
Ihor Otkydach
4.96 (78)
이 지표를 구매하신 분께는 다음과 같은 혜택이 무료로 제공됩니다: 각 거래를 자동으로 관리하고, 손절/익절 수준을 설정하며, 전략 규칙에 따라 거래를 종료하는 전용 도우미 툴 "Bomber Utility" 다양한 자산에 맞게 지표를 설정할 수 있는 셋업 파일(Set Files) "최소 위험", "균형 잡힌 위험", "관망 전략" 모드로 설정 가능한 Bomber Utility의 셋업 파일 이 전략을 빠르게 설치, 설정, 시작할 수 있도록 돕는 단계별 영상 매뉴얼 주의: 위의 모든 보너스를 받기 위해서는 MQL5 개인 메시지 시스템을 통해 판매자에게 연락해 주세요. 독창적인 커스텀 지표인 “Divergence Bomber(다이버전스 봄버)”를 소개합니다. 이 지표는 MACD 다이버전스(괴리) 전략을 기반으로 한 올인원(All-in-One) 거래 시스템입니다. 이 기술 지표의 주요 목적은 가격과 MACD 지표 간의 다이버전스를 감지하고, **향후 가격이 어느 방향으로 움직일지를 알려주는
ARICoins
Temirlan Kdyrkhan
ARICoin is a powerful trading companion designed to generate high-probability entry signals with dynamic TP/SL/DP levels based on volatility. Built-in performance tracking shows win/loss stats, PP1/PP2 hits, and success rates all updated live. Key Features: Buy/Sell signals with adaptive volatility bands Real-time TP/SL/DP levels based on ATR Built-in MA Filter with optional ATR/StdDev volatility Performance stats panel (Success, Profit/Loss, PP1/PP2) Alerts via popup, sound, push, or email Cust
AriX
Temirlan Kdyrkhan
1 (4)
AriX Indicator for MT5 A powerful trend-following and signal-evaluation tool AriX is a custom MT5 indicator that combines Moving Averages and ATR-based risk/reward logic to generate clear buy/sell signals. It visualizes dynamic SL/TP levels, evaluates past trade outcomes, and displays win/loss statistics in a clean on-chart panel. Key features include: Buy/Sell signals based on MA crossovers ATR-based SL/TP1/TP2/TP3 levels with visual lines and labels Signal outcome tracking with real-time stat
Entry In The Zone and SMC Multi Timeframe 은 Smart Money Concepts(SMC)를 기반으로 개발된 실시간 시장 분석 도구입니다. 이 시스템은 트레이더가 시장 구조를 체계적으로 분석하고 전체적인 시장 방향을 더욱 명확하게 파악할 수 있도록 설계되었습니다. 시스템은 여러 시간대에서 반전 포인트(Reversal Points), 핵심 구역(Key Zones), 그리고 시장 구조(Market Structure)를 자동으로 분석하며, POI(Point of Interest), 노 리페인트(No Repaint) 신호, 자동 피보나치 레벨(Auto Fibonacci Levels)을 표시하여 되돌림(Pullback)과 반전 포인트를 정확하게 탐지할 수 있도록 돕습니다. 또한 실시간 신호와 알림을 통해 가격이 핵심 구역에 진입하거나 해당 구역에서 반전 신호가 발생하는 순간을 놓치지 않도록 보조합니다. 더불어 이 시스템은 인디케이터와 신호 시스템을 하나로
Azimuth Pro
Ottaviano De Cicco
5 (1)
LAUNCH PROMO Azimuth Pro price is initially set at 299$ for the first 100 buyers. Final price will be 499$ . THE DIFFERENCE BETWEEN RETAIL AND INSTITUTIONAL ENTRIES ISN'T THE INDICATOR — IT'S THE LOCATION. Most traders enter at arbitrary price levels, chasing momentum or reacting to lagging signals. Institutions wait for price to reach structured levels where supply and demand actually shift. Azimuth Pro maps these levels automatically: swing-anchored VWAP, multi-timeframe structure lines, an
Atomic Analyst MT5
Issam Kassas
4.19 (27)
우선적으로 언급할 점은이 거래 지표가 다시 그리지 않고 지연되지 않으며 이를 통해 수동 및 로봇 거래 모두에 이상적이라는 점입니다. 사용자 매뉴얼: 설정, 입력 및 전략. Atomic Analyst는 가격의 강도와 모멘텀을 활용하여 시장에서 더 나은 이점을 찾는 PA Price Action Indicator입니다. 고급 필터를 장착하여 잡음과 거짓 신호를 제거하고 거래 잠재력을 높이는 데 도움이 됩니다. 복잡한 지표의 다중 레이어를 사용하여 Atomic Analyst는 차트를 스캔하고 복잡한 수학적 계산을 간단한 신호와 색상으로 변환하여 초보 트레이더가 이해하고 일관된 거래 결정을 내릴 수 있도록합니다. "Atomic Analyst"는 새로운 및 경험이 풍부한 트레이더를위한 종합적인 거래 솔루션입니다. 프리미엄 지표와 최고 수준의 기능을 하나의 거래 전략에 결합하여 모든 종류의 트레이더에 대한 다재다능한 선택지가되었습니다. 인트라데이 거래 및 스캘핑 전략 : 빠르고 정확한 일일
ARIScalping
Temirlan Kdyrkhan
ARIScalp is a powerful trading companion designed to generate high-probability entry signals with dynamic TP/SL/DP levels based on volatility. Built-in performance tracking shows win/loss stats, PP1/PP2 hits, and success rates all updated live. Key Features: Buy/Sell signals with adaptive volatility bands Real-time TP/SL/DP levels based on ATR Built-in MA Filter with optional ATR/StdDev volatility Performance stats panel (Success, Profit/Loss, PP1/PP2) Alerts via popup, sound, push, or email Cus
FX Power MT5 NG
Daniel Stein
5 (28)
FX Power: 통화 강세 분석으로 더 스마트한 거래 결정을 개요 FX Power 는 어떤 시장 상황에서도 주요 통화와 금의 실제 강세를 이해하기 위한 필수 도구입니다. 강한 통화를 매수하고 약한 통화를 매도함으로써 FX Power 는 거래 결정을 단순화하고 높은 확률의 기회를 발견합니다. 트렌드를 따르거나 극단적인 델타 값을 사용해 반전을 예측하고자 한다면, 이 도구는 귀하의 거래 스타일에 완벽히 적응합니다. 단순히 거래하지 말고, FX Power 로 더 스마트하게 거래하세요. 1. FX Power가 거래자에게 매우 유용한 이유 통화와 금의 실시간 강세 분석 • FX Power 는 주요 통화와 금의 상대적 강세를 계산하고 표시하여 시장 역학에 대한 명확한 통찰력을 제공합니다. • 어떤 자산이 앞서고 있고 어떤 자산이 뒤처지는지 모니터링하여 보다 현명한 거래 결정을 내릴 수 있습니다. 포괄적인 멀티 타임프레임 뷰 • 단기, 중기 및 장기 타임프레임에서 통화와 금의 강세를
Gold Sniper Scalper Pro
Ich Khiem Nguyen
3.29 (7)
Gold Sniper Scalper Pro는 MetaTrader 5용 전문 지표로, 트레이더가 진입 지점을 식별하고 리스크를 효과적으로 관리할 수 있도록 지원하기 위해 설계되었습니다. 이 지표는 시그널 감지 시스템, 자동 Entry/SL/TP 관리, 거래량 분석 및 실시간 성과 통계를 포함하는 포괄적인 분석 도구 세트를 제공합니다. 시스템 이해를 위한 사용자 가이드   |   기타 언어 사용자 가이드 주요 기능 시그널 감지 시스템 지표는 Price Action 분석 및 시장 구조를 기반으로 잠재적 진입 지점을 자동으로 감지합니다. 거래 기회 감지 시: - BUY 화살표(녹색) 또는 SELL 화살표(빨간색)가 차트에 표시됩니다 - 캔들이 색상으로 표시되어 시그널 영역을 식별합니다 - Entry/SL/TP 레벨이 자동으로 계산됩니다 시그널은 가격이 Entry 레벨에 도달할 때만 활성화되어, 시장에서 확인되지 않은 시그널을 필터링합니다. 지능형 Entry/SL/TP 관리 - Ent
Trend Screener Pro MT5
STE S.S.COMPANY
4.84 (99)
트렌드 표시기, 트렌드 트레이딩 및 필터링을 위한 획기적인 고유 솔루션, 하나의 도구 안에 내장된 모든 중요한 트렌드 기능! Forex, 상품, 암호 화폐, 지수 및 주식과 같은 모든 기호/도구에 사용할 수 있는 100% 다시 칠하지 않는 다중 시간 프레임 및 다중 통화 표시기입니다. Trend Screener는 차트에 점이 있는 화살표 추세 신호를 제공하는 효율적인 지표 추세 추종 지표입니다. 추세 분석기 표시기에서 사용할 수 있는 기능: 1. 트렌드 스캐너. 2. 최대 이익 분석이 있는 추세선. 3. 추세 통화 강도 측정기. 4. 경고가 있는 추세 반전 점. 5. 경고가 있는 강력한 추세 점. 6. 추세 화살표 Trend Screener Indicator가 있는 일일 분석 예, 일일 신호 성능...등은 여기에서 찾을 수 있습니다. 여기를 클릭하십시오. LIMITED TIME OFFER : Trend Screener Indicator는 50$ 및 평생 동안만 사용할 수 있습니다.
Weis Wave with Alert MT5
Trade The Volume Waves Single Member P.C.
4.94 (17)
Rental/Lifetime Package Options and Privileges  Rent Monthly Six Months   Yearly/Lifetime Weis Wave with Speed with Alert+Speed Index x x x Manual  x x x Quick Set up Video x x x Blog x x x Lifetime Updates x x x Setup and Training Material x x Discord Access Channel "The SI traders"          x Rectangle Break Alert Tool      x How to trade with it:    http://www.tradethevolumewaves.com   ** If you purchase please contact me to setup your  : Training Room and  complete manual access.  Wei
우선적으로, 이 거래 도구는 전문적인 거래에 이상적인 비-다시 그리기 및 지연되지 않는 지표입니다.  온라인 강좌, 사용자 매뉴얼 및 데모. 스마트 가격 액션 컨셉트 인디케이터는 신규 및 경험 많은 트레이더 모두에게 매우 강력한 도구입니다. Inner Circle Trader Analysis 및 Smart Money Concepts Trading Strategies와 같은 고급 거래 아이디어를 결합하여 20가지 이상의 유용한 지표를 하나로 결합합니다. 이 인디케이터는 스마트 머니 컨셉트에 중점을 두어 대형 기관의 거래 방식을 제공하고 이동을 예측하는 데 도움을 줍니다.  특히 유동성 분석에 뛰어나 기관이 어떻게 거래하는지 이해하는 데 도움을 줍니다. 시장 트렌드를 예측하고 가격 변동을 신중하게 분석하는 데 탁월합니다. 귀하의 거래를 기관 전략에 맞추어 시장의 동향에 대해 더 정확한 예측을 할 수 있습니다. 이 인디케이터는 시장 구조를 분석하고 중요한 주문 블록을 식별하고 다양
Trend indicator AI mt5
Ramil Minniakhmetov
5 (13)
트렌드 인공 지능 지표는 실행 가능한 진입 점 및 반전 경고와 추세 식별을 결합하여 상인의 시장 분석을 향상시킬 훌륭한 도구입니다. 이 표시기는 사용자가 자신감과 정밀도로 외환 시장의 복잡성을 탐색 할 수 있도록 지원합니다 기본 신호 외에도 트렌드 인공 지능 지표는 풀백 또는 되돌림 중에 발생하는 2 차 진입 점을 식별하여 거래자가 기존 트렌드 내에서 가격 수정을 활용할 수 있도록합니다. 중요한 장점: ·작동 4 및 5 *명확한 구매 또는 판매 신호 *다시 칠하지 않습니다 *모든 자산에서 작동 나는 전보 사기에 개 또는 세트를 판매하지 않도록주의. 모든 설정은 블로그에 여기에 무료.  중요! 지침 및 보너스를 얻기 위해 구입 후 즉시 저에게 연락! 진짜 가동 감시는 뿐 아니라 나의 다른 제품 여기에서 찾아낼 수 있습니다: https://www.mql5.com/en/users/mechanic/seller&nbsp ; 설정 및 입력: 모든 자산에 대해 기본 설정을 권
Advanced Supply Demand MT5
Bernhard Schweigert
4.5 (14)
현재 33% 할인! 초보자나 전문 트레이더를 위한 최고의 솔루션! 이 보조지표는 우리가 다수의 독창적 기능과 새로운 공식을 통합한 독특하고 고품질이며 저렴한 거래 도구입니다. 이 업데이트를 통해 이중 시간대를 표시할 수 있습니다. 더 높은 TF를 표시할 수 있을 뿐만 아니라 차트 TF와 더 높은 TF 모두를 표시할 수 있습니다: 중첩 영역 표시. 모든 Supply Demand 트레이더들이 좋아할 것입니다. :) 중요한 정보 공개 Advanced Supply Demand의 잠재력을 극대화하려면 다음을 방문하십시오. https://www.mql5.com/ko/blogs/post/720245   진입 또는 목표의 명확한 트리거 포인트를 정확히 찾아냄으로 해서 거래가 어떻게 개선될지 상상해 보십시오. 새로운 알고리즘을 기반으로 매수자와 매도자 간의 잠재적인 불균형을 훨씬 더 쉽게 분간할 수 있습니다. 왜냐하면 가장 강한 공급영역과 가장 강한 수요 영역과 과거에 어떻게 진행 되었는지를(이전
Berma Bands
Muhammad Elbermawi
5 (7)
Berma Bands(BBs) 지표는 시장 동향을 파악하고 이를 활용하려는 트레이더에게 귀중한 도구입니다. 가격과 BBs 간의 관계를 분석함으로써 트레이더는 시장이 추세 단계인지 범위 단계인지를 분별할 수 있습니다. 자세한 내용을 알아보려면 [ Berma Home Blog ]를 방문하세요. 버마 밴드는 세 개의 뚜렷한 선으로 구성되어 있습니다. 어퍼 버마 밴드, 미들 버마 밴드, 로어 버마 밴드입니다. 이 선들은 가격 주위에 그려져 전체 추세에 대한 가격 움직임을 시각적으로 표현합니다. 이 밴드들 사이의 거리는 변동성과 잠재적인 추세 반전에 대한 통찰력을 제공할 수 있습니다. 버마 밴드 라인이 각각에서 분리될 때, 그것은 종종 시장이 횡보 또는 범위 이동 기간에 접어들고 있음을 시사합니다. 이는 명확한 방향 편향이 없음을 나타냅니다. 트레이더는 이러한 기간 동안 추세를 파악하기 어려울 수 있으며 더 명확한 추세가 나타날 때까지 기다릴 수 있습니다. 버마 밴드 라인이 단일 라인으로
Grabber System MT5
Ihor Otkydach
4.81 (21)
탁월한 기술적 지표인 Grabber를 소개합니다. 이 도구는 즉시 사용 가능한 “올인원(All-Inclusive)” 트레이딩 전략으로 작동합니다. 하나의 코드 안에 강력한 시장 기술 분석 도구, 매매 신호(화살표), 알림 기능, 푸시 알림이 통합되어 있습니다. 이 인디케이터를 구매하신 모든 분들께는 다음의 항목이 무료로 제공됩니다: Grabber 유틸리티: 오픈 포지션을 자동으로 관리하는 도구 단계별 영상 매뉴얼: 설치, 설정, 그리고 실제 거래 방법을 안내 맞춤형 세트 파일: 인디케이터를 빠르게 자동 설정하여 최고의 성과를 낼 수 있도록 도와줍니다 다른 전략은 이제 잊어버리세요! Grabber만이 여러분을 새로운 트레이딩의 정점으로 이끌어 줄 수 있습니다. Grabber 전략의 주요 특징: 거래 시간 프레임: M5부터 H4까지 거래 가능한 자산: 어떤 자산이든 사용 가능하지만, 제가 직접 테스트한 종목들을 추천드립니다 (GBPUSD, GBPCAD, GBPCHF, AUDCAD, AU
MetaForecast M5
Vahidreza Heidar Gholami
5 (3)
MetaForecast는 가격 데이터의 조화를 기반으로 모든 시장의 미래를 예측하고 시각화합니다. 시장이 항상 예측 가능한 것은 아니지만 가격에 패턴이 있다면 MetaForecast는 가능한 정확하게 미래를 예측할 수 있습니다. 다른 유사한 제품과 비교했을 때, MetaForecast는 시장 동향을 분석하여 더 정확한 결과를 생성할 수 있습니다. 입력 매개변수 Past size (과거 크기) MetaForecast가 미래 예측을 생성하기 위한 모델을 만드는 데 사용하는 막대의 수를 지정합니다. 모델은 선택한 막대 위에 그려진 노란색 선으로 표시됩니다. Future size (미래 크기) 예측해야 할 미래 막대의 수를 지정합니다. 예측된 미래는 핑크색 선으로 표시되며 그 위에 파란색 회귀선이 그려집니다. Degree (차수) 이 입력은 MetaForecast가 시장에서 수행할 분석 수준을 결정합니다. Degree 설명  0 차수 0의 경우, "Past size" 입력에 모든 봉우리와
Quantum TrendPulse
Bogdan Ion Puscasu
5 (20)
SuperTrend   ,   RSI   ,   Stochastic   의 힘을 하나의 포괄적인 지표로 결합하여 트레이딩 잠재력을 극대화하는 궁극의 트레이딩 도구   인 Quantum TrendPulse를   소개합니다. 정밀성과 효율성을 추구하는 트레이더를 위해 설계된 이 지표는 시장 추세, 모멘텀 변화, 최적의 진입 및 종료 지점을 자신 있게 식별하는 데 도움이 됩니다. 주요 특징: SuperTrend 통합:   주요 시장 추세를 쉽게 따라가고 수익성의 물결을 타세요. RSI 정밀도:   매수 과다 및 매도 과다 수준을 감지하여 시장 반전 시점을 파악하는 데 적합하며 SuperTrend 필터로 사용 가능 확률적 정확도:   변동성이 큰 시장에서 숨겨진 기회를 찾기 위해 확률적 진동   을 활용하고 SuperTrend의 필터로 사용 다중 시간대 분석:   M5부터 H1 또는 H4까지 다양한 시간대에 걸쳐 시장을 최신 상태로 유지하세요. 맞춤형 알림:   맞춤형 거래 조건이 충족되면
ARIPoint
Temirlan Kdyrkhan
1 (1)
ARIPoint is a powerful trading companion designed to generate high-probability entry signals with dynamic TP/SL/DP levels based on volatility. Built-in performance tracking shows win/loss stats, PP1/PP2 hits, and success rates all updated live. Key Features: Buy/Sell signals with adaptive volatility bands Real-time TP/SL/DP levels based on ATR Built-in MA Filter with optional ATR/StdDev volatility Performance stats panel (Success, Profit/Loss, PP1/PP2) Alerts via popup, sound, push, or email Cu
RelicusRoad Pro MT5
Relicus LLC
5 (24)
훌륭한 백테스트, 환상적인 숫자로 입증된 실제 계정 성능, 그리고 모든 곳에 퍼져 있는 통계를 자랑하는 트레이딩 지표를 얼마나 자주 구매하셨습니까? 하지만 사용 후에는 결국 계좌를 날려버리셨나요? 신호 자체만으로는 신뢰할 수 없습니다. 신호가 왜 처음 나타났는지 알아야 하며, 그것이 바로 RelicusRoad Pro가 가장 잘하는 일입니다! 사용자 매뉴얼 + 전략 + 교육 비디오 + VIP 액세스 전용 그룹 + 모바일 버전 사용 가능 시장을 보는 새로운 방법 RelicusRoad는 외환, 선물, 암호화폐, 주식 및 지수를 위한 세계에서 가장 강력하고 최고의 트레이딩 지표 로서, 트레이더가 계좌를 성장시키는 데 필요한 모든 정보와 도구를 제공합니다. 우리는 기술 분석 및 트레이딩 계획 을 제공하여 초보자 부터 고급 트레이더 까지 모든 트레이더가 성공할 수 있도록 돕습니다. 이것은 미래 시장을 예측 하는 데 충분한 정보를 제공하는 핵심 트레이딩 지표 입니다. 우리는 차트에서 의미 없
Elliott Wave Trend MT5
Young Ho Seo
4 (4)
Elliott Wave Trend was designed for the scientific wave counting. This tool focuses to get rid of the vagueness of the classic Elliott Wave Counting using the guideline from the template and pattern approach. In doing so, firstly Elliott Wave Trend offers the template for your wave counting. Secondly, it offers Wave Structural Score to assist to identify accurate wave formation. It offers both impulse wave Structural Score and corrective wave Structure Score. Structural Score is the rating to sh
Max Ribbon Mt5
Stefano Frisetti
WARNING: This indicator is distributed EXCLUSIVELY on MQL5.com MT4 version:   https://www.mql5.com/it/market/product/160363 MT5 version:   https://www.mql5.com/it/market/product/160410 ============================================================================================= MAX RIBBON ver 1.00 The indicator that shows you the TREND clearly and unambiguously! ============================================================================================= DESCRIPTION MAX RIBBON is an advanced tre
MTF Supply Demand Zones MT5
Georgios Kalomoiropoulos
5 (1)
자동화된 수요 및 공급 구역의 차세대. 모든 차트에서 작동하는 새롭고 혁신적인 알고리즘. 모든 구역은 시장의 가격 움직임에 따라 동적으로 생성됩니다. 두 가지 유형의 경고 --> 1)가격이 영역에 도달할 때 2)새로운 영역이 형성될 때 당신은 더 이상 쓸모없는 지표를 얻을 수 없습니다. 입증된 결과로 완벽한 거래 전략을 얻을 수 있습니다.     새로운 기능:     가격이 공급/수요 영역에 도달하면 경고     새로운 공급/수요 구역이 생성되면 알림     푸시 알림 알림     핍의 영역 너비 레이블     기동특무부대에 한 번 더 시간이 주어집니다. 따라서 현재보다 위의 2개의 시간 프레임 대신 현재보다 높은 3개의 시간 프레임을 볼 수 있습니다.     Alerts/Zones/MTF 기능을 활성화/비활성화하는 버튼 당신이 얻는 이점:     거래에서 감정을 제거하십시오.     거래 항목을 객관화하십시오.     높은 확률 설정을 사용하여 수익
Trend Forecaster
Alexey Minkov
5 (7)
The Trend Forecaster indicator utilizes a unique proprietary algorithm to determine entry points for a breakout trading strategy. The indicator identifies price clusters, analyzes price movement near levels, and provides a signal when the price breaks through a level. The Trend Forecaster indicator is suitable for all financial assets, including currencies (Forex), metals, stocks, indices, and cryptocurrencies. You can also adjust the indicator to work on any time frames, although it is recommen
PZ Swing Trading MT5
PZ TRADING SLU
5 (5)
Protect against whipsaws: revolutionize your swing trading approach Swing Trading is the first indicator designed to detect swings in the direction of the trend and possible reversal swings. It uses the baseline swing trading approach, widely described in trading literature. The indicator studies several price and time vectors to track the aggregate trend direction and detects situations in which the market is oversold or overbought and ready to correct. [ Installation Guide | Update Guide | Tro
TrendLine PRO MT5
Evgenii Aksenov
4.67 (33)
The Trend Line PRO indicator is an independent trading strategy. It shows the trend change, the entry point to the transaction, as well as automatically calculates three levels of Take Profit and Stop Loss protection. Trend Line PRO is perfect for all Meta Trader symbols: currencies, metals, cryptocurrencies, stocks and indices. The indicator is used in trading on real accounts, which confirms the reliability of the strategy. Robots using   Trend Line PRO   and real Signals can be found here: 
SuperScalp Pro
Van Minh Nguyen
5 (1)
SuperScalp Pro – 고급 다중 필터 스캘핑 인디케이터 시스템 SuperScalp Pro는 클래식 Supertrend와 여러 지능형 확인 필터를 결합한 고급 스캘핑 인디케이터 시스템입니다. 해당 인디케이터는 M1부터 H4까지 모든 타임프레임에서 효율적으로 작동하며, 특히 XAUUSD, BTCUSD 및 주요 외환 통화쌍에 적합합니다. 독립형 시스템으로 사용하거나 기존 거래 전략에 유연하게 통합할 수 있습니다. 이 인디케이터는 11개 이상의 필터를 통합하며, 빠른/느린 EMA, 추세 판별용 3개의 EMA, EMA 기울기(EMA slope), RSI, ADX, 거래량(Volume), VWAP, 볼린저 밴드 돌파(Bollinger Bands Breakout) 및 MACD 다이버전스 필터 등을 포함합니다. 스마트 캔들 필터는 캔들 종가를 확인하여 약한 신호를 제거하고, 3 EMA와 MACD 다이버전스 필터를 결합한 추세 인식 메커니즘은 더 높은 승률의 신호를 선별하는 데 도움을 줍니
Trade smarter, not harder: Empower your trading with Harmonacci Patterns This is arguably the most complete harmonic price formation auto-recognition indicator you can find for the MetaTrader Platform. It detects 19 different patterns, takes fibonacci projections as seriously as you do, displays the Potential Reversal Zone (PRZ) and finds suitable stop-loss and take-profit levels. [ Installation Guide | Update Guide | Troubleshooting | FAQ | All Products ] It detects 19 different harmonic pri
PZ Support Resistance MT5
PZ TRADING SLU
3.71 (7)
Unlock key market insights with automated support and resistance lines Tired of plotting support and resistance lines? This is a multi-timeframe indicator that detects and plots supports and resistance lines in the chart with the same precision as a human eye would. As price levels are tested over time and its importance increases, the lines become thicker and darker, making price leves easy to glance and evaluate. [ Installation Guide | Update Guide | Troubleshooting | FAQ | All Products ] Boos
제작자의 제품 더 보기
Angulation
Alexey Topounov
According to Bill Williams' trading strategy described in the book "Trading Chaos: Maximize Profits with Proven Technical Techniques" the indicator displays the following items in a price chart: 1.Bearish and bullish divergent bars: Bearish divergent bar is colored in red or pink (red is a stronger signal). Bullish divergent bar is colored in blue or light blue color (blue is a stronger signal). 2. "Angulation" formation with deviation speed evaluation. 3. The level for placing a pending order (
Synthetic Reverse Bar
Alexey Topounov
5 (2)
Synthetic Reverse Bar is an evolution of Reverse Bar indicator. It is well-known that candlestick patterns work best at higher timeframes (H1, H4). However, candlesticks at such timeframes may form differently at different brokers due to dissimilarities in the terminal time on the single symbol, while the history of quotes on M1 and M5 remains the same! As a result, successful patterns are often not formed at higher timeframes! Synthetic Reverse Bar solves that problem! The indicator works on M5
Soldiers Crows
Alexey Topounov
5 (1)
The indicator displays the "Three white soldiers and Three black crows" candlestick model on a chart. Three white soldiers are color in blue. Three black crows are colored in red. Input parameters: Max Bars - maximum number of bars calculated on the chart. Make Signal Alert - use alert. Type of pattern rules - use a strict model of determining the pattern (short lower shadows for the three soldiers, short upper shadows for the three crows), or a simplified model. Max Shadow Ratio - coefficient o
Reverse Bar
Alexey Topounov
The Reverse Bar indicator paints the reversal bars according to trade strategy, described by Bill Williams in "Trading Chaos. Maximize Profits with Proven Technical Techniques" book. The bearish reversal bar has red or pink color (red-stronger signal) The bullish reversal bar has blue or light blue color(blue - stronger signal) It is recommended to use it on hourly timeframe (H1) and higher.
Pin Bar
Alexey Topounov
5 (1)
This indicator shows Pin Bar candlestick pattern on the chart. The bearish pin bars have red color, the bullish pin bars have blue color. The indicator shows alert when Pin Bar candlestick pattern is formed. It's recommended to use it at timeframes H1 and higher. The best moment (strong signal) is when Pin Bar is formed close to the support/resistance level.
The indicator displays the "Morning star" and "Evening star" patterns on a chart. The Evening star is displayed in red or rose. The Morning star is displayed in blue or light blue. Input Parameters: Max Bars – number of bars calculated on the chart. Make Signal Alert – use alerts. Send Push Notification - send notification to a mobile terminal Type of rules pattern – type of the model of pattern determination (Hard – with the control of length of shadows of the second bar). If Soft is selected
HL D1 Move
Alexey Topounov
The indicator displays the dynamics of forming the daily range in the form of a histogram, and the average daily range for a specified period. The indicator is a useful auxiliary tool for intraday trades. Settings N Day - period for calculation of the daily range value. Level Indefinite - level of indefiniteness. Level Confidence - level of confidence. Level Alert - alert level. When it is crossed, the alert appears.
Bullish Bearish Volume is an indicator that divides the volume into the bearish and the bullish part according to VSA: Bullish volume is a volume growing during upward motion and a volume falling during downward motion. Bearish volume is a volume growing during downward motion and a volume falling during upward motion. For a higher obviousness it uses smoothing using MA of a small period. Settings: MaxBars – number of bars calculated on the chart; Method – smoothing mode (Simple is most preferab
Trading Sessions Pro is a trading session indicator with extended settings + the ability to install and display the custom period. Main Advantages: The indicator allows you to conveniently manage display of trading sessions on the chart. There is no need to enter the settings each time. Just click the necessary trading session in the lower window and it is highlighted by the rectangle on the chart! The indicator has two modes of defining the trading terminal's time offset relative to UTC (GMT).
VWAP Universal
Alexey Topounov
VWAP is Volume Weighted Average Price. It is calculated as addition of products of volume and price divided by the total volume. This version of the indicator is universal as it has three modes of operation: Moving - in this mode the indicator works as a moving average. But unlike ordinary SMA it has smaller lags during big movements! Bands of square deviation can be used in the same way as Bollinger Bands. Period - in this mode the calculations are performed from the start to the end of period
Вертикальная гистограмма объема -  отображает распределение объема по уровням. Гистограмма рассчитывается от объема ( реального или тикового), при этом объем соответствующий бару переносится на уровень H-L бара. Таким образом, при распределении объема за сутки по вертикали - формируются максимумы гистограммы показывающие области проторговки. Настройки индикатора: Timeframe Set -  период в пределах которого производится расчет. (рекомендуется D1) Step's - количество отображаемых периодов. Amplitu
Hurst Fractal Index Фрактальный Индекс Херста -  показатель персистентности временного ряда При значении индикатора >0.5 временной ряд считается персистентным (тенденция сохраняется) При значениях индикатора явно < 0.5 временной ряд считается антиперсистентным (возможна смена направления движения) Для наглядности значения индекса усредняются периодом 2-3. Настройки индикатора: Max Bars -  глубина истории расчета (кол-во баров на графике для которых произведён расчет) Data from Timeframe - исполь
필터:
리뷰 없음
리뷰 답변