Morning Evening Star
- Indicadores
- Versión: 1.3
- Actualizado: 4 septiembre 2017
- Activaciones: 7

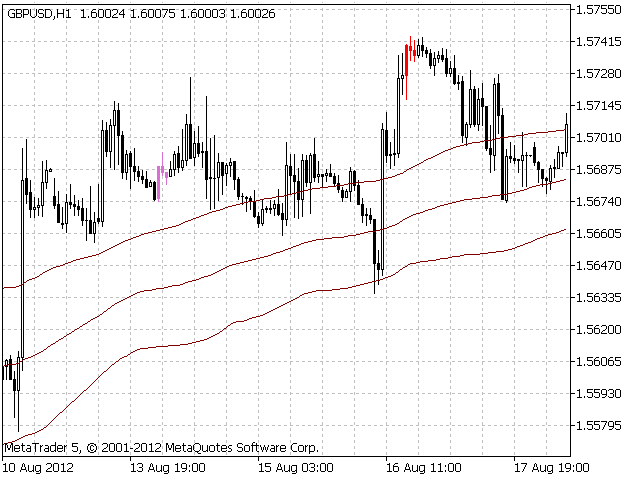
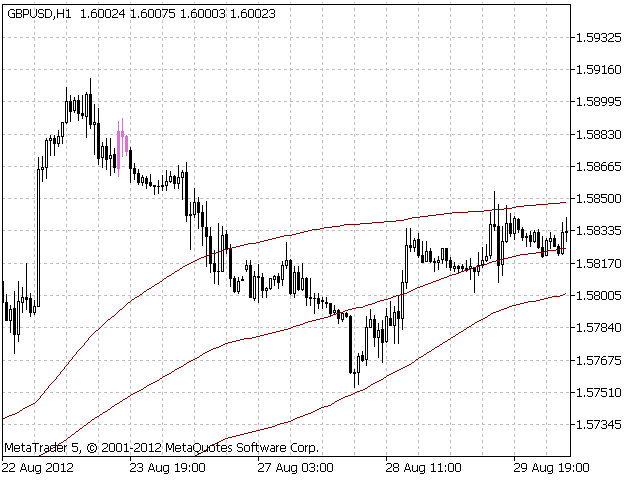
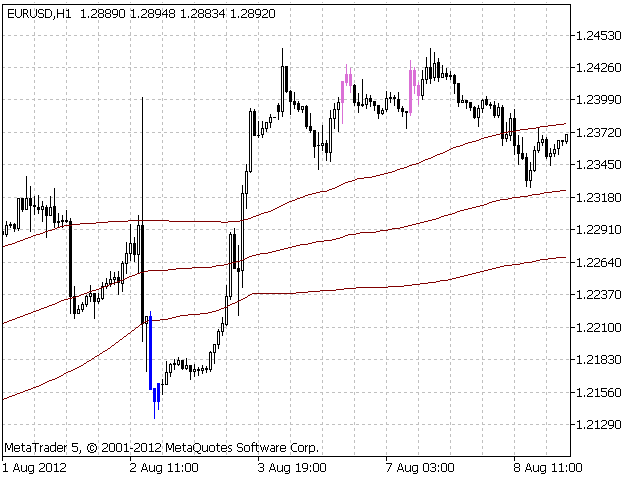
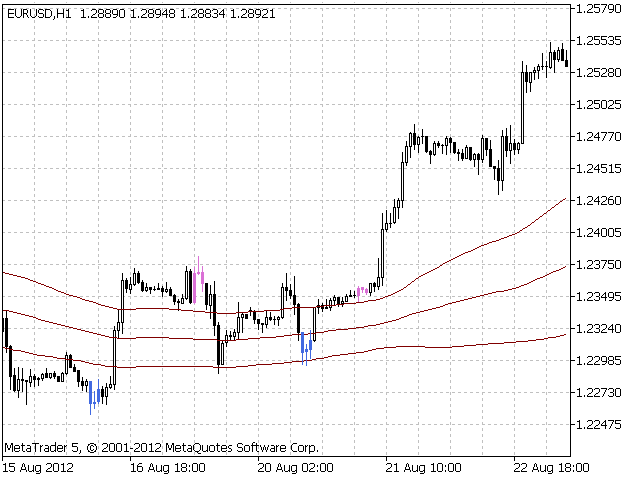
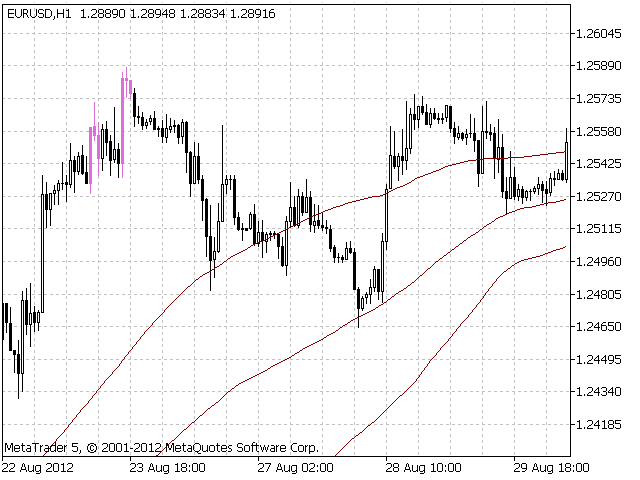
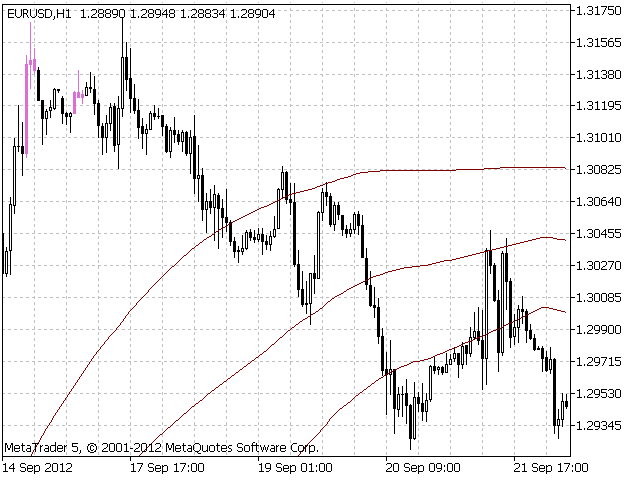
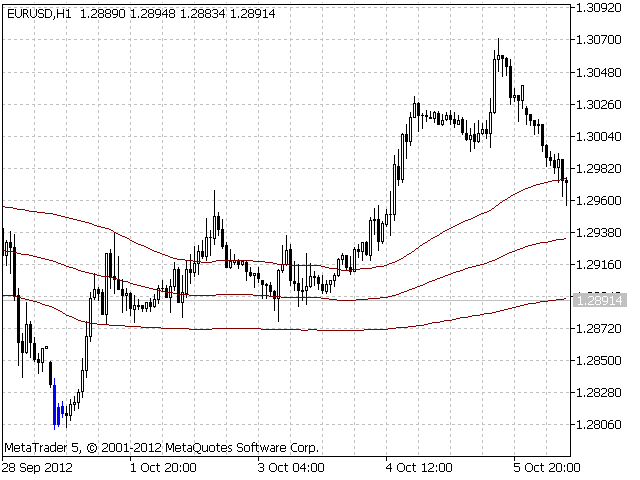
El indicador muestra los patrones "Estrella de la mañana" y "Estrella de la tarde" en un gráfico.
La estrella vespertina se muestra en rojo o rosa. La estrella de la mañana se muestra en azul o azul claro.
Parámetros de entrada:
- Max Bars - número de barras calculadas en el gráfico.
- Hacer Alerta de Señal - utilizar alertas.
- Enviar Notificación Push - enviar notificación a un terminal móvil.
- Type of rules pattern - tipo del modelo de determinación del patrón (Hard - con el control de longitud de sombras de la segunda barra). Si se selecciona Suave, los patrones que no cumplan la condición de longitud máxima de sombra se mostrarán en colores claros (rosa o azul claro).
- FiltroInteligente Activado - filtro que considera la probabilidad de retroceso.
- Sensibilidad Filtro Inteligente - sensibilidad del "Filtro Inteligente" (0 ÷ 1). 1 - sensibilidad máxima. 0 - sensibilidad mínima (habrá menos señales).
- Relación de la longitud del cuerpo(primera barra) - coeficiente de la longitud mínima del cuerpo de la primera barra.
- Relación de la longitud del cuerpo( segunda barra) - coeficiente de la longitud máxima del cuerpo de la segunda barra.
- Relación de la longitud de las sombras( segunda barra) - coeficiente de la longitud máxima de las sombras de la segunda barra.
- Relación de la longitud del cuerpo( tercera barra) - coeficiente de la longitud mínima del cuerpo de la tercera barra.
- Filtro de tendencia acorto plazo - configuración del filtro de tendencia a corto plazo.
- FiltroMA Activado - utilizar el filtro de tendencia a corto plazo basado en MA.
- Método MA - método de promediación de MA.
- Período MA - período de MA.
- MA Price Type - tipo de precio utilizado.
- Set Bollinger Bands Filter - configuración del filtro basado en el indicador Bollinger Bands.
- Filtro Activado - utilizar el filtro basado en el indicador de Bandas de Bollinger.
- Entry BBands period - periodo de las Bandas de Bollinger.
- Entry BB andsdeviation - desviación de las Bandas de Bollinger.
- Range Check - número de barras a comprobar.
Recomendaciones de uso:
Entrar en el mercado mediante órdenes pendientes colocadas
- en el nivel Bajo de la tercera barra menos varios puntos para la Estrella Vespertina.
- en el nivel Alto de la tercera barra más varios puntos para la estrella Matutina.
El SL se coloca en el nivel extremo local más varios puntos.
Una señal que se forme el viernes 3-4 horas antes del final de una sesión comercial debería omitirse.
Si hay una posición abierta cuando aparece una señal, se recomienda no invertir, sino continuar el seguimiento de la posición abierta.