Hedging
- Indicadores
- Versión: 2.2
- Actualizado: 27 octubre 2022
- Activaciones: 8

El indicador de cobertura es una herramienta de negociación que permite salir de una pérdida flotante resultante de operaciones erróneas mediante la cobertura de los resultados de las operaciones. Esta herramienta también le permite resolver el problema de bloqueo negativo.
La cobertura de los resultados de la operación significa su cierre simultáneo TakeProfit y Stop Loss calculado por el indicador.
¡El indicador tiene en cuenta el volumen de las posiciones abiertas! Cuando el número o el volumen de las operaciones se incrementa o se reduce, los niveles de TakeProfit y StopLoss se recalculan automáticamente para volúmenes más grandes, lo que permite revertir la dirección de la operación el número necesario de veces en función del estado actual del mercado.
Los valores recomendados de TakeProfit y StopLoss se muestran en la tabla. El TakeProfit puede mostrarse como una línea horizontal en el gráfico de símbolos. StopLoss debe ser distante de TakeProfit por el valor igual a la propagación media especificada en las entradas del indicador, porque de esta manera usted puede cerrar todas las operaciones a la vez.
En cualquier caso, ¡las operaciones con TakeProfit deben cerrarse primero!
El resultado total de las operaciones se establece en puntos en las entradas del indicador y depende de lo que necesite el operador: pérdida permitida, punto de equilibrio o beneficio.
¡ElTakeProfit y StopLoss calculados son recomendaciones! El nivel de TakeProfit debe fijarse para las órdenes con el mayor volumen total, el nivel de StopLoss - para las órdenes con el menor volumen total. La fijación del nivel para las órdenes es posible cuando se utiliza el Script de Cobertura apropiado.
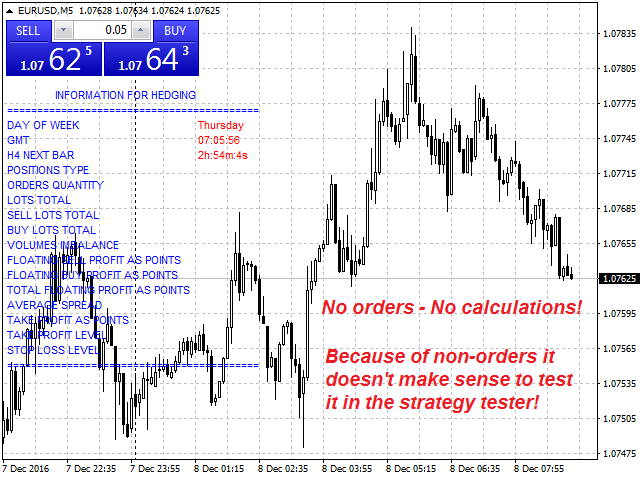
El indicador sólo funciona con órdenes de mercado y realiza cálculos cuando hay al menos dos operaciones de volúmenes diferentes en direcciones distintas: alcista o bajista. No realiza cálculos cuando las operaciones son en la misma dirección o cuando las operaciones bidireccionales tienen el mismo volumen.
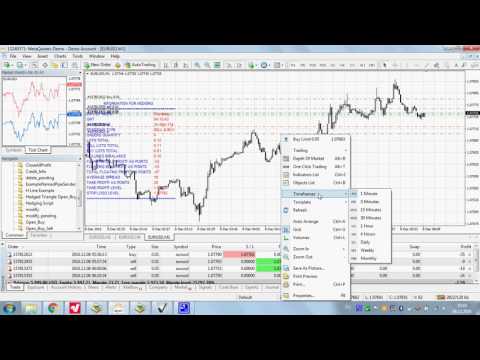
El indicador proporciona información adicional necesaria para operar como se muestra en las capturas de pantalla.
El funcionamiento del indicador se muestra en el vídeo adjunto. El nivel de TakeProfit se muestra como una línea horizontal azul que se ajusta en el gráfico siguiendo las acciones del operador.
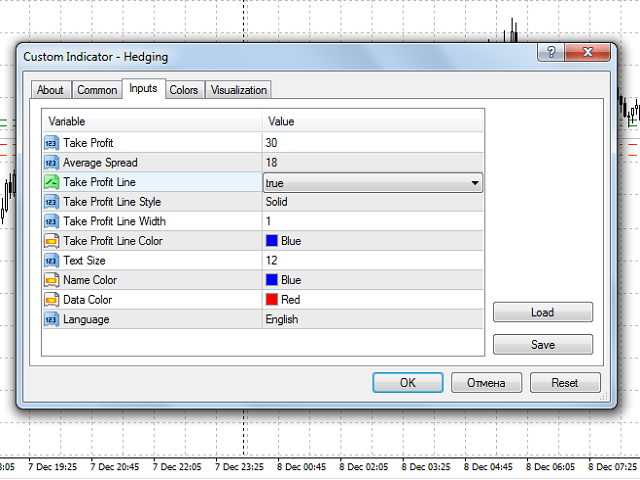
Parámetros de entrada
- Take Profit - el nivel de Take Profit en puntos.
- Average Spread - valor medio del spread.
- Línea Take Profit - muestra la línea Take Profit en el gráfico:
- true - sí.
- flse - no.
- Estilo de la Línea Take Profit
- Anchura de la línea Take Profit
- Color de la línea Take Profit
- Tamaño del Texto - tamaño de la fuente para el texto de información.
- Color del Nombre - el color para los nombres de las etiquetas.
- Color de Datos - el color para los valores.
- Idioma - elija el idioma para la información mostrada:
- Inglés.
- Ruso.