Hedging

The Hedging indicator is a trading tool, allowing to exit a floating loss that results from erroneous trades by using hedging of trade results. This tool also allows you to solve the problem of negative locking.

Hedging of trade results means their simultaneous closing TakeProfit and Stop Loss calculated by the indicator.

The indicator takes into account the volume of opened positions! When the number or volume of trades is increased or reduced, the TakeProfit and StopLoss levels are automatically recalculated for larger volumes, allowing to revert trade direction the required number of times depending on the current market mood!

Recommended TakeProfit and StopLoss values are displayed in the table. The TakeProfit can be displayed as a horizontal line on the symbol chart. StopLoss must be distant from TakeProfit by the value equal to the average spread specified in the indicator inputs, because this way you can close all trades at a time.

In any case, trades with TakeProfit must be closed first!

The total result of trades is set in points in the indicator inputs and depends on what the trader needs: allowable loss, breakeven or profit.

The calculated TakeProfit and StopLoss are recommendations! The TakeProfit level must be set for orders with the largest total volume, the StopLoss level - for orders with lowest total volumes. Placing the level for orders is possible when using the appropriate Hedging Script.

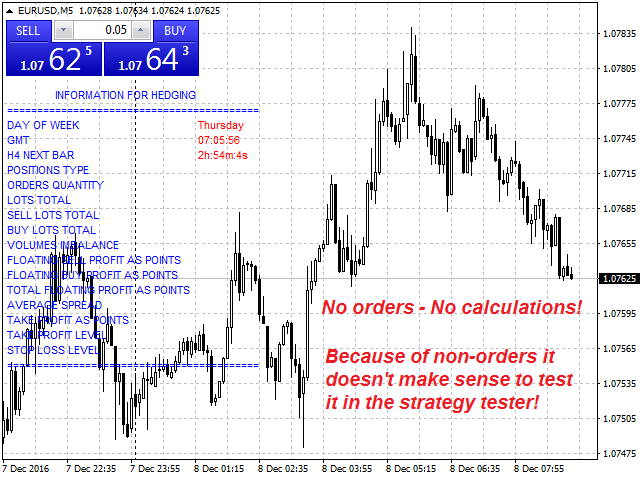
The indicator only works with market orders and makes calculations when there are at least two trades of different volumes in different directions: bullish or bearish. It does not perform calculations when trades are in the same direction or bi-directional trades have the same volume!

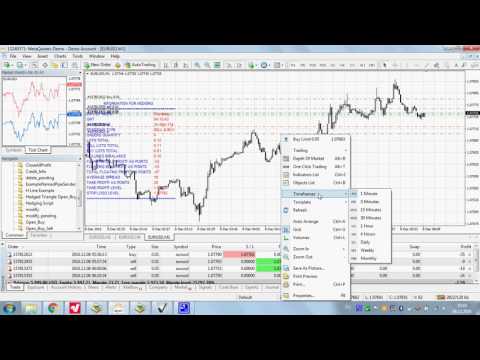
The indicator provides additional information required for trading as shown in screenshots.

The indicator operation is demonstrated in the attached video. The TakeProfit level is shown as a blue horizontal line which is adjusted on the chart following trader's actions.
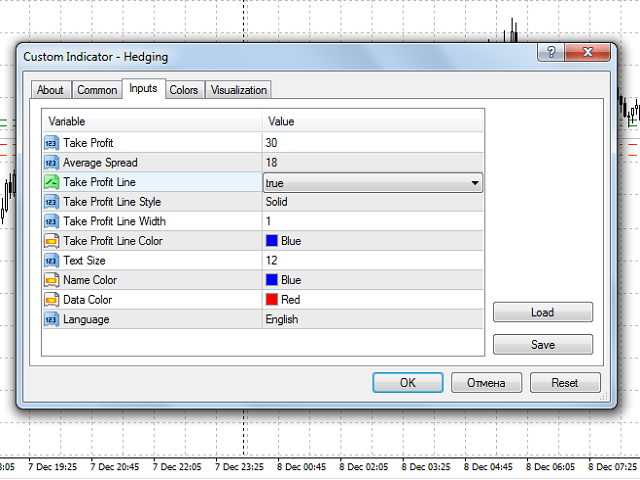

Input Parameters

  1. Take Profit - the Take Profit level in points.
  2. Average Spread - average spread value.
  3. Take Profit Line - showing the Take Profit line on the chart:
    • true - yes.
    • flse - no.
  4. Take Profit Line Style
  5. Take Profit Line Width
  6. Take Profit Line Color
  7. Text Size - font size for the information text.
  8. Name Color - the color for the labels names.
  9. Data Color - the color for the values.
  10. Language - choose language for the displayed information:
    • English.
    • Russian.
추천 제품
Royal Dutch Skunk
Sayan Vandenhout
ROYAL DUTCH SKUNK USES THE TREND WAVE INDICATOR AND IT CAN IDENTIFY THE BEGINNING AND THE END OF A NEW WAVE TREND MOVEMENT. AS AN OSCILLATOR, THE INDICATOR IDENTIFIES THE OVERBOUGHT AND OVERSOLD ZONES. IT WORKS GREAT TO CATCH THE SHORT TERM PRICE REVERSALS AND USES A MARTINGALE STRATEGY TO CLOSE ALL TRADES IN PROFIT. USE DEFAULT SETTINGS ON H1 OR HIGHER TIME FRAME ON ANY PAIR FOR MORE ACCURATE TRADES WHY THIS EA : Smart entries calculated by 6 great strategies The EA can be run on even a $20000
Power Renko MT4
Pierce Vallieres
Power Renko is an indicator which plots Renko bricks underneath the chart using a histogram. You can select the brick size and the timeframe of the Renko bricks as well as whether or not to use the close price or the high/low price of the candles. Renko bricks are based on price alone, not time, therefor the Renko bricks will not be aligned with the chart's time. They are extremely useful for trend trading and many different strategies can be formed from them. Buffers are provided allowing you t
VR Cub
Vladimir Pastushak
VR Cub 은 고품질 진입점을 얻는 지표입니다. 이 지표는 수학적 계산을 용이하게 하고 포지션 진입점 검색을 단순화하기 위해 개발되었습니다. 지표가 작성된 거래 전략은 수년 동안 그 효율성을 입증해 왔습니다. 거래 전략의 단순성은 초보 거래자라도 성공적으로 거래할 수 있다는 큰 장점입니다. VR Cub은 포지션 개시 지점과 이익 실현 및 손절매 목표 수준을 계산하여 효율성과 사용 편의성을 크게 높입니다. 간단한 거래 규칙을 이해하려면 아래 전략을 사용한 거래 스크린샷을 살펴보세요. 설정, 세트 파일, 데모 버전, 지침, 문제 해결 등은 다음에서 얻을 수 있습니다. [블로그] 다음에서 리뷰를 읽거나 작성할 수 있습니다. [링크] 버전 [MetaTrader 5] 진입점 계산 규칙 포지션 개설 진입점을 계산하려면 VR Cub 도구를 마지막 최고점에서 마지막 최저점까지 늘려야 합니다. 첫 번째 지점이 두 번째 지점보다 빠른 경우, 거래자는 막대가 중간선 위에서 마감될 때까지 기다립니다
Owl smart levels
Sergey Ermolov
4.24 (37)
MT5 버전  |   FAQ Owl Smart Levels Indicator 는   Bill Williams 의 고급 프랙탈, 시장의 올바른 파동 구조를 구축하는 Valable ZigZag, 정확한 진입 수준을 표시하는 피보나치 수준과 같은 인기 있는 시장 분석 도구를 포함하는 하나의 지표 내에서 완전한 거래 시스템입니다. 시장과 이익을 취하는 장소로. 전략에 대한 자세한 설명 표시기 작업에 대한 지침 고문-거래 올빼미 도우미의 조수 개인 사용자 채팅 ->구입 후 나에게 쓰기,나는 개인 채팅에 당신을 추가하고 거기에 모든 보너스를 다운로드 할 수 있습니다 힘은 단순함에 있습니다! Owl Smart Levels   거래 시스템은 사용하기 매우 쉽기 때문에 전문가와 이제 막 시장을 연구하고 스스로 거래 전략을 선택하기 시작한 사람들 모두에게 적합합니다. 전략 및 지표에는 눈에 보이지 않는 비밀 공식 및 계산 방법이 없으며 모든 전략 지표는 공개되어 있습니다. Owl Smart Leve
Auto Fibo Pro m
DMITRII GRIDASOV
"Auto FIBO Pro" Crypto_Forex 지표 - 거래에 유용한 보조 도구입니다! - 지표는 자동으로 Fibo 수준과 로컬 추세선(빨간색)을 계산하여 차트에 배치합니다. - Fibonacci 수준은 가격이 반전될 수 있는 주요 영역을 나타냅니다. - 가장 중요한 수준은 23.6%, 38.2%, 50%, 61.8%입니다. - 역전 스캘핑이나 존 그리드 거래에 사용할 수 있습니다. - Auto FIBO Pro 지표를 사용하여 현재 시스템을 개선할 수 있는 기회도 많습니다. - Info Spread Swap Display가 있습니다. 현재 Spread와 Swap이 부착된 외환 쌍을 표시합니다. - 디스플레이에는 계정 잔액, 자본 및 마진도 표시됩니다. - 차트의 어느 모서리에서나 Info Spread Swap Display를 찾을 수 있습니다. 0 - 왼쪽 상단 모서리, 1 - 오른쪽 상단, 2 - 왼쪽 하단, 3 - 오른쪽 하단. 여기를 클릭하여 고품질 트레이딩 로봇과
Trendiness Index
Libertas LLC
5 (3)
"The trend is your friend" is one of the best known sayings in investing, because capturing large trendy price movements can be extremely profitable. However, trading with the trend is often easier said than done, because many indicators are based on price reversals not trends. These aren't very effective at identifying trendy periods, or predicting whether trends will continue. We developed the Trendiness Index to help address this problem by indicating the strength and direction of price trend
PipFinite EA Breakout EDGE
Karlo Wilson Vendiola
5 (5)
The Official Automated Version of the Reliable Indicator PipFinite Breakout EDGE EA Breakout EDGE takes the signal of PipFinite Breakout EDGE indicator and manages the trade for you. Because of numerous financial instruments to consider, many traders want the signals to be fully automated. The EA will make sure all your trades are executed from entry to exit. Saving you time and effort while maximizing your profits. The Edge of Automation Effortless price action trading is now possible acros
Vizzion
Joel Protusada
Vizzion is a fully automated scalping Expert Advisor that can be run successfully using GBPJPY currency pair at H1 timeframe. Very Important This Expert Advisor can not run with any EAs in the same account. As part of the money management plan, it calculates and monitors the Margin Level % and assumes that all open trades are created by it. If you want an Expert Advisor that trades in a daily basis, this EA is not for you because using this requires a patience to wait for a few days or weeks on
Trend PA
Mikhail Nazarenko
5 (3)
The Trend PA indicator uses   Price Action   and its own filtering algorithm to determine the trend. This approach helps to accurately determine entry points and the current trend on any timeframe. The indicator uses its own algorithm for analyzing price changes and Price Action. Which gives you the advantage of recognizing, without delay, a new nascent trend with fewer false positives. Trend filtering conditions can be selected in the settings individually for your trading style. The indicator
Smart Funded Hft
Barbaros Bulent Kortarla
4.82 (65)
스마트 펀드 HFT EA로 거래 잠재력을 해제하세요! VPS 없음 / 설정 파일 없음 / 플러그 앤 플레이 즐기기 / 아래 쉬운 설정 비디오 확인 한정된 시간 동안 프로모션 가격 제 거래의 비밀을 공유하게 되어 매우 기쁩니다 – 스마트 펀드 EA. 수백 가지 도전을 완벽한 성공률로 정복했으며, 이제 여러분의 거래 게임을 한 단계 업그레이드할 차례입니다! 이 EA는 HFT 사용을 허용하는 프롭 회사의 HFT 도전을 통과하기 위해 설계되었습니다. HFT 사용이 허용되지 않는 도전/펀드 계정/실제 계정에서는 사용하지 마세요. 스마트 펀드 HFT EA가 돋보이는 이유: 도전 마스터리: 거의 모든 HFT 도전에서 수백 번의 도전을 성공적으로 완료하여 100%의 성공률을 확보했습니다. 단순한 도구가 아니라 검증된 파워하우스입니다. 최고의 간편함: 복잡한 설정이나 VPS 설정에 빠져들 필요 없습니다. 로드하고, 로트 크기를 조정한 다음 실행 버튼을 누르기만 하면 됩니다 - 최고의 간편함입니다.
The Infinity Expert Advisor is a scalper. When the resistance and support levels are broken, trades are opened in the direction of the price movement. Open positions are managed by several algorithms based on the current market situation (fixed stop loss and take profit, trailing stop, holding positions in case of trend indication, etc.). Requirements for the broker The EA is sensitive to spread, slippages and execution quality. It is strongly recommended not to use the EA for currencies with s
Super Reversal Pattern
Parfait Mujinga Ndalika
Super Reversal Pattern Indicator Unlock the power of advanced pattern recognition with our Super Reversal Pattern Indicator. Designed for traders seeking precision and reliability, this indicator identifies one of the most effective reversal patterns in technical analysis, offering a significant edge in your trading strategy. Key Features: Non-Repainting Accuracy: Enjoy the confidence of non-repainting technology. Once a Super Reversal Pattern is detected, it remains static, providing consiste
Stacking King EA
Dora Nafwa Mwabini
스태킹 킹 EA – 정밀한 파워, 간편한 버튼 조작 설명: 스태킹 킹 EA는 단 한 번의 클릭으로 여러 거래를 즉시 시작하거나, 설정된 기간 동안 매분 자동으로 거래를 스태킹할 수 있는 강력한 트레이딩 도구입니다. MT4 터미널에서 바로 사용 가능합니다. 스캘퍼, 트렌드 라이더, 브레이크아웃 스태킹 등 어떤 트레이더든 이 EA는 최소한의 노력으로 완벽한 제어권을 제공합니다. 실제 시장에서 활동하는 트레이더를 위해 설계되었습니다. 단순한 백테스트 도구가 아닌, 실전에서 활용할 수 있는 장비입니다. 스트레스나 지연 없이 거래 스태킹을 완벽하게 제어하고 싶은 진지한 트레이더를 위해 설계되었습니다. ️ 참고: 이 EA는 터미널 기반이며 전략 테스터 모드에서는 작동하지 않습니다. 실시간 거래용으로 설계되었으며, 시뮬레이션 테스트용으로는 적합하지 않습니다. 이것이 중요한 이유 많은 EA가 백테스트 모드에서 테스트될 수 있지만, 백테스트는 실제 시장 상황을 반영하지 못하는 경우가 많습니다
Noize Absorption Index MT4
Ekaterina Saltykova
5 (1)
Noize Absorption Index - is the manual trading system that measures the difference of pressure between bears forces and bulls forces. Green line - is a noize free index that showing curent situation. Zero value of index shows totally choppy/flat market.Values above zero level shows how powerfull bullish wave is and values below zero measures bearish forces.Up arrow appears on bearish market when it's ready to reverse, dn arrow appears on weak bullish market, as a result of reverse expectation. S
Reversepro Smartsma ea mt4
AL MOOSAWI ABDULLAH JAFFER BAQER
ReversePro SmartSMA EA – A Fully Customizable Moving Average Strategy ReversePro SmartSMA EA is an advanced yet fully customizable trading tool designed for traders who prefer to fine-tune their strategies. This Expert Advisor (EA) is not pre-optimized, allowing you the flexibility to adjust its settings to fit your trading style, risk management preferences, and market conditions. How It Works This EA is based on the well-known Simple Moving Average (SMA) crossover strategy, enhanced with addi
The indicator displays the data of the Stochastic oscillator from a higher timeframe on the chart. The main and signal lines are displayed in a separate window. The stepped response is not smoothed. The indicator is useful for practicing "manual" forex trading strategies, which use the data from several screens with different timeframes of a single symbol. The indicator uses the settings that are identical to the standard ones, and a drop-down list for selecting the timeframe. Indicator Paramet
Magic Balance
Daniil Evstratenko
The indicator shows which trading pairs, strategies, robots and signals that you use are profitable and which are not. The statistic of trades and balance graph are displayed in the account currency and pips - to switch simply click on the graph. button "$"(top left) - minimize/expand and move the indicator panel button ">"(bottom right) - stretching and resetting to the original size Statistic of trades 1 line - account balance, current profit and lot of open trades; 2 line - the number of all
The robot uses the trading strategy of breaking the lines of the Bollinger Bands indicator. The essence of this strategy lies in the constant analysis of the indicator lines and the search for the most effective breakout points for its lines. When the price breaks through the indicator line in one of the directions, the robot opens a trade in that direction and starts to follow it. But the robot does not open trades every time the indicator lines are broken, but only in those places where it co
Gyroscopes
Nadiya Mirosh
Gyroscope        professional forex expert   (for EURUSD, GBPUSD, USDJPY, AUDUSD, USDCHF, EURGBP, EURJPY, NZDUSD, USDCAD, EURCHF, AUDJPY, CADJPY pairs)   alyzing the market using the Elliot Wave Index. Elliott wave theory is the interpretation of processes in financial markets through a system of visual models (waves) on price charts. The author of the theory, Ralph Elliott, identified eight variants of alternating waves (of which five are in the trend and three are against the trend). The mov
Candlestick Pattern Scanner is a multi-timeframe and multi-symbol dashboard and alert system that checks all timeframes and currency pairs for different candlestick patterns that are formed in them. Scanner is integrated with support and resistance zones so you can check the candlestick patterns in the most important areas of the chart to find breakout and reversal patterns in the price chart. Download demo version   (works on M30,D1,W1 timeframes and 20 symbols of Market Watch window) Read the
Classic Market Surfer EA - A Timeless, Proven Strategy for Gold Trading For years, this powerful trading strategy has been hidden from the public-reserved for a select few. Now, for the first time, the Classic Market Surfer EA is available to traders like you.   Built on pure, time-tested trading principles, this EA doesn't rely on trendy gimmicks like AI or machine learning. Instead, it harnesses a classic, robust strategy that has consistently delivered results over the years. This is not a "g
Infinity Trend Pro
Yaroslav Varankin
1 (1)
This is a trend indicator without redrawing Developed instead of the binary options strategy (by the color of the Martingale candlestick) Also works well in forex trading When to open trades (binary options) A signal will appear in the place with a candle signaling the current candle It is recommended to open a deal for one candle of the current timeframe M1 and M5 When a blue dot appears, open a deal up When a red dot appears, open a trade down. How to open trades on Forex. When a signal is rec
Harvest GOLD
Sayan Vandenhout
Harvest GOLD USES THE TREND WAVE INDICATOR AND IT CAN IDENTIFY THE BEGINNING AND THE END OF A NEW WAVE TREND MOVEMENT. AS AN OSCILLATOR, THE INDICATOR IDENTIFIES THE OVERBOUGHT AND OVERSOLD ZONES. IT WORKS GREAT TO CATCH THE SHORT TERM PRICE REVERSALS AND USES A MARTINGALE STRATEGY TO CLOSE ALL TRADES IN PROFIT. USE DEFAULT SETTINGS ON H1 OR HIGHER TIME FRAME ON ANY PAIR FOR MORE ACCURATE TRADES WHY THIS EA : Smart entries calculated by 3 great strategies The EA can be run on even a $30000
TradePilot
Hossein Khalil Alishir
TradePilot Expert Advisor (EA) for MetaTrader 4 TradePilot is a professional and user-friendly Expert Advisor (EA) for MetaTrader 4 (MT4) . It simplifies automated trading , risk management , and trade execution using a smart trading panel . Perfect for beginners and experienced traders looking for a reliable trade manager EA with automated lot size calculation . Key Advantages User-Friendly Trading Panel: Customizable panel with buttons and hotkeys. Smart Risk Management: Supports percen
FDM Strategy
Paranchai Tensit
FDM Strategy is an Expert Advisor based on fractals and five dimension method. Five Dimensions expert system is developed based on a theory combining the Chaos Theory with the trading psychology and the effects that each has on the market movement. There is also an ADX (measuring trend strength with average directional movement index) used as a trading filter. Long and Short Trade Signals: If fractal to buy is above the Alligator's Teeth (red line), the pending Sell Stop order must be placed 1 p
Project Oro
Giacomo Donati
Follow us on Instagram: https://www.instagram.com/project_oro_ea Project Oro is a trading algorithm project that I began approximately six years ago. After countless painful and excruciating hours of coding, it is finally ready to be released to the public. The Expert Advisor (EA) is built on a proprietary and unique technique that analyzes the behavior and movement of candlesticks and the price action within the gold market. It searches for short windows of opportunity to strike and exits tr
The   Trendlines Oscillator   helps traders identify trends and momentum based on the normalized distances between the current price and the most recently detected bullish and bearish trend lines. The indicator features bullish and bearish momentum, a signal line with crossings, and multiple smoothing options. USAGE The   Trendlines Oscillator   works by systematically: Identifying pivot highs and lows. Connecting pivots to form bullish (support) and bearish (resistance) trendlines. Measuring
캔들의 종가를 예측하는 지표입니다. 지표는 주로 D1 차트에서 사용하기 위한 것이. 이 지표는 전통적인 외환 거래와 바이너리 옵션 거래 모두에 적합합니다. 지표는 독립형 거래 시스템으로 사용하거나 기존 거래 시스템에 추가로 사용할 수 있습니다. 이 표시기는 현재 양초를 분석하여 양초 본체 내부의 특정 강도 요인과 이전 양초의 매개변수를 계산합니다. 따라서 지표는 시장 움직임의 추가 방향과 현재 양초의 종가를 예측합니다. 이 방법 덕분에 지표는 단기 및 중장기 거래 모두에 적합합니다. 지표를 사용하면 시장 상황을 분석하는 동안 지표가 생성할 잠재적 신호의 수를 설정할 수 있습니다. 표시기 설정에는 이를 위한 특별한 매개변수가 있습니다. 또한 인디케이터는 새로운 신호에 대해 차트의 메시지 형태, 이메일 및 PUSH 알림 형태로 알릴 수 있습니다. 구매 후 저에게 꼭 써주세요! 나는 당신에게 지표와 거래에 대한 나의 추천을 줄 것입니다! 또한 보너스를 받으세요!
This PORTFOLIO of 3 strategies has been developed, tested and traded live on DAX H1 timeframe. Multiple EAs traded together will lead to a BIGGER PROFITS and SMOOTHER EQUITY CURVE. 3 not correlated EAs logics for DAX H1 timeframe merged to a single strategy. Very SIMPLE STRATEGIES with only FEW PARAMETERS. Every trade has his own logic for STOP LOSS. To catch the profits every strategy uses different approach - some has TAKE PROFIT, some uses TIME BASED EXITS or PROFIT TRAILING. EA has been back
This PORTFOLIO of 3 strategies has been developed, tested and traded live on DAX M30 timeframe. Multiple EAs traded together will lead to a BIGGER PROFITS and SMOOTHER EQUITY CURVE. 3 not correlated EAs logics for DAX M30 timeframe merged to a single strategy. Very SIMPLE STRATEGIES with only FEW PARAMETERS.  Every trade has his own logic for STOP LOSS. To catch the profits every strategy uses different approach - some has TAKE PROFIT, some uses TIME BASED EXITS or PROFIT TRAILING. EA has been
이 제품의 구매자들이 또한 구매함
Miraculous Indicator – Gann Square of Nine 기반 100% 비리페인트 Forex 및 바이너리 도구 이 영상은 Miraculous Indicator 를 소개합니다. 이 지표는 Forex 및 바이너리 옵션 트레이더를 위해 특별히 개발된 매우 정확하고 강력한 트레이딩 도구입니다. 이 지표가 독특한 이유는 전설적인 **Gann Square of Nine(Gann 9의 사각형)**과 **Gann's Law of Vibration(Gann 진동의 법칙)**에 기반을 두고 있기 때문입니다. 이는 현대 트레이딩에서 가장 정밀한 예측 도구 중 하나로 손꼽힙니다. Miraculous Indicator는 완전히 비리페인트(non-repaint) 됩니다. 즉, 캔들이 마감된 후에도 신호가 변경되거나 사라지지 않습니다. 보이는 것이 곧 결과입니다. 이는 트레이더가 자신감을 가지고 거래에 진입하고 청산할 수 있는 신뢰할 수 있고 일관된 기반을 제공합니다. 주요 특징: Gann
Gann Made Easy
Oleg Rodin
4.83 (155)
Gann Made Easy 는 mr.의 이론을 사용하여 최고의 거래 원칙을 기반으로 하는 전문적이고 사용하기 쉬운 Forex 거래 시스템입니다. W.D. 간. 이 표시기는 Stop Loss 및 Take Profit Levels를 포함하여 정확한 BUY 및 SELL 신호를 제공합니다. PUSH 알림을 사용하여 이동 중에도 거래할 수 있습니다. 거래 팁, 보너스, GANN MADE EA를 무료로 받으시려면 구매 후 저에게 연락주세요! 아마도 Gann 거래 방법에 대해 이미 여러 번 들었을 것입니다. 일반적으로 Gann의 이론은 초보자 거래자뿐만 아니라 이미 거래 경험이 있는 사람들에게도 매우 복잡한 것입니다. Gann의 거래 방식은 이론적으로 적용하기 쉽지 않기 때문입니다. 나는 그 지식을 연마하고 Forex 지표에 최고의 원칙을 적용하기 위해 몇 년을 보냈습니다. 표시기는 적용하기가 매우 쉽습니다. 차트에 첨부하고 간단한 거래 권장 사항을 따르기만 하면 됩니다. 지표는 지속적으로 시장
M1 Sniper
Oleg Rodin
5 (17)
M1 SNIPER 는 사용하기 쉬운 거래 지표 시스템입니다. M1 시간대에 맞춰 설계된 화살표 지표입니다. 이 지표는 M1 시간대 스캘핑을 위한 단독 시스템으로 사용할 수 있으며, 기존 거래 시스템의 일부로도 사용할 수 있습니다. 이 거래 시스템은 M1 시간대 거래용으로 특별히 설계되었지만, 다른 시간대에도 사용할 수 있습니다. 원래는 XAUUSD와 BTCUSD 거래를 위해 이 방법을 설계했지만, 다른 시장 거래에도 유용하다는 것을 알게 되었습니다. 이 지표의 신호는 추세 방향과 반대로 거래될 수 있습니다. 저는 지표의 신호를 활용하여 양방향으로 거래할 수 있도록 돕는 특별한 거래 기법을 알려드립니다. 이 방법은 특별한 동적 지지선과 저항선 가격 영역을 활용하는 것을 기반으로 합니다. 구매하시면 M1 SNIPER 화살표 지표를 바로 다운로드하실 수 있습니다. 또한, 아래 스크린샷에 표시된 Apollo Dynamic SR 지표는 M1 SNIPER 도구를 사용하는 모든 사용자에게 무료로
RFI levels PRO
Roman Podpora
5 (1)
사전 지표       시장 반전 수준과 영역을 파악하여   가격이 해당 수준으로 되돌아올 때까지 기다렸다가 새로운 추세의 시작점에서 진입할 수 있도록 해줍니다. 즉, 추세의 끝에서 진입하는 것이 아닙니다. 그는 보여준다       반전 수준       시장이 방향 전환을 확인하고 추가적인 움직임을 형성하는 지점입니다. 이 지표는 차트를 다시 그릴 필요 없이 작동하며, 모든 금융 상품에 최적화되어 있고, 특정 금융 상품과 함께 사용할 때 최대의 잠재력을 발휘합니다.       트렌드 라인즈 프로       지시자. 모든 계측기에 적용 가능한 가역 구조 스캐너 모든 거래 상품을 자동으로 추적하고 모든 R-반전 패턴을 즉시 식별하여 LOGIC AI 신호가 이미 존재하는 위치와 기타 유용한 정보를 표시합니다. 로직 AI – 진입점을 표시해주는 도우미 시장 진입에 가장 적합한 시점을 판단하는 지능형 신호입니다. TPSproSYSTEM 알고리즘을 사용하여 가격 변동, 추세 및 주요 시장 참
TPSpro RFI Levels
Roman Podpora
4.85 (27)
러시아어 설명서  /  영어   설명서  /  MT5 버전 주요 기능: 판매자와 구매자의 활동 영역을 표시합니다! 이 지표는 매수 및 매도에 대한 모든 올바른 첫 번째 임펄스 레벨/존을 표시합니다. 진입점 검색이 시작되는 이러한 레벨/존이 활성화되면 레벨의 색상이 바뀌고 특정 색상으로 채워집니다. 상황을 더욱 직관적으로 파악할 수 있도록 화살표도 표시됩니다. LOGIC AI - 템플릿 활성화 시 진입점 검색을 위한 영역(원) 표시 시각적 명확성을 개선하기 위해 인공지능을 사용하여 진입점을 검색한 영역을 표시하는 기능이 추가되었습니다. 더 높은 시간대의 레벨/존 표시(MTF 모드) 더 높은 시간 간격을 사용하여 레벨/존을 표시하는 기능이 추가되었습니다. 또한, 이 지표는 자동 추세 감지 기능(   TPSproTREND PRO   )을 구현했습니다. 거래를 위한 별도의 전문적인 단계별 알고리즘 이 알고리즘은 추세 방향과 반대 방향으로의 당일 거래 모두에 적합하도록 설계되었습니다. 각
Gold Signal Pro
Mohamed Hassan
First 25 copies at $80, after that price becomes $149 (3 copies left) Gold Signal Pro is a powerful MT4 indicator designed to help traders spot strong price reactions in the market. It focuses on clear wick rejections , showing when price strongly rejects a level and often continues in the same direction. Gold Signal Pro is mainly built for scalping gold (XAUUSD) and works best on lower timeframes like M5 and M15 , where timing matters most. That said, it can also be used on any forex pair, a
PRO Renko System
Oleg Rodin
5 (30)
PRO Renko System 은 RENKO 차트 거래를 위해 특별히 고안된 매우 정확한 거래 시스템입니다. 이것은 다양한 거래 상품에 적용될 수있는 보편적 인 시스템입니다. 체계는 효과적으로 당신에게 정확한 반전 신호에 접근을 주는 소위 시장 소음을 중화합니다. 이 표시기는 사용하기가 매우 쉽고 신호 생성을 담당하는 매개 변수가 하나만 있습니다. 당신은 쉽게 당신의 선택의 어떤 무역 계기에 공구를 적응시킬 수 있고 renko 막대기의 크기. 나는 항상 당신이 내 소프트웨어로 수익성있게 거래 할 수 있도록 추가 지원을 제공 할 준비가되어 있습니다! 나는 당신에게 행복하고 수익성있는 거래를 기원합니다! 구매 후 저에게 연락하십시오! 내 렌코 차트 생성기를 보내드립니다. 또한 내 개인 권장 사항 및 시스템의 다른 모듈을 무료로 공유 할 것입니다!
GoldRush Trend Arrow Signal
Kirk Lee Holloway
5 (2)
GoldRush 트렌드 화살표 신호 GoldRush 트렌드 화살표 신호 지표는 XAU/USD 시장에서 고속 단기 스캘핑 트레이더를 위해 설계된 정밀한 실시간 트렌드 분석을 제공합니다. 1분 시간대에 특화되어 설계된 이 도구는 명확한 진입점을 표시하는 방향성 화살표를 제공하여 스캘퍼들이 변동성이 높은 시장 환경에서도 자신 있게 거래할 수 있도록 합니다. 이 지표는 PRIMARY 및 SECONDARY 경고 화살표로 구성됩니다. PRIMARY 신호는 추세 방향의 변화를 나타내는 흰색과 검은색 방향성 화살표이며, SECONDARY 신호는 PRIMARY 화살표가 지시하는 방향을 확인하고 잠재적인 거래 진입점을 표시하는 파란색과 빨간색 화살표입니다. 참고: 추세 방향이 변경된 후 PRIMARY 경고 화살표가 단 하나만 표시될 경우, 다수의 SECONDARY 파란색/빨간색 화살표가 표시될 수 있음을 유의해야 합니다. SECONDARY 신호는 신호 기준을 충족하는 어떤 캔들 이후에도 표시
Trend indicator AI
Ramil Minniakhmetov
4.65 (80)
트렌드 인공 지능 지표는 실행 가능한 진입 점 및 반전 경고와 추세 식별을 결합하여 상인의 시장 분석을 향상시킬 훌륭한 도구입니다. 이 표시기는 사용자가 자신감과 정밀도로 외환 시장의 복잡성을 탐색 할 수 있도록 지원합니다 기본 신호 외에도 트렌드 인공 지능 지표는 풀백 또는 되돌림 중에 발생하는 2 차 진입 점을 식별하여 거래자가 기존 트렌드 내에서 가격 수정을 활용할 수 있도록합니다. 중요한 장점: ·작동 4 및 5 *명확한 구매 또는 판매 신호 *다시 칠하지 않습니다 *모든 자산에서 작동 나는 전보 사기에 개 또는 세트를 판매하지 않도록주의. 모든 설정은 블로그에 여기에 무료.  중요! 지침 및 보너스를 얻기 위해 구입 후 즉시 저에게 연락! 진짜 가동 감시는 뿐 아니라 나의 다른 제품 여기에서 찾아낼 수 있습니다: https://www.mql5.com/en/users/mechanic/seller&nbsp ; 설정 및 입력: 모든 자산에 대해 기본 설정을 권
Trend Screener
STE S.S.COMPANY
4.79 (95)
트렌드 표시기, 트렌드 트레이딩 및 필터링을 위한 획기적인 고유 솔루션, 하나의 도구 안에 내장된 모든 중요한 트렌드 기능! Forex, 상품, 암호 화폐, 지수 및 주식과 같은 모든 기호/도구에 사용할 수 있는 100% 다시 칠하지 않는 다중 시간 프레임 및 다중 통화 표시기입니다. 기간 한정 특가: 지원 및 저항 스크리너 지표는 단 100달러에 평생 제공됩니다. (원래 가격 50 달러) (제안 연장) Trend Screener는 차트에 점이 있는 화살표 추세 신호를 제공하는 효율적인 지표 추세 추종 지표입니다. 추세 분석기 표시기에서 사용할 수 있는 기능: 1. 트렌드 스캐너. 2. 최대 이익 분석이 있는 추세선. 3. 추세 통화 강도 측정기. 4. 경고가 있는 추세 반전 점. 5. 경고가 있는 강력한 추세 점. 6. 추세 화살표 Trend Screener Indicator가 있는 일일 분석 예, 일일 신호 성능...등은 여기에서 찾을 수 있습니다.   여기를 클릭하십시오. L
Trend Lines PRO
Roman Podpora
5 (1)
트렌드 라인즈 프로       이 지표는 시장이 실제로 어떤 방향으로 전환되는지 파악하는 데 도움이 됩니다. 실제 추세 반전 지점과 주요 시장 참여자들이 다시 진입하는 지점을 보여줍니다. 보시다시피       BOS 라인       복잡한 설정이나 불필요한 노이즈 없이 더 높은 시간대의 추세 변화와 주요 레벨을 확인할 수 있습니다. 신호는 차트에 다시 그려지지 않고 캔들이 마감된 후에도 계속 표시됩니다. VERSION MT 5     -    RFI LEVELS PRO   표시기   와 결합할 때 최대 잠재력을 발휘합니다. 지표가 보여주는 내용: 실제 변화       추세(BOS 라인) 한 번 신호가 나타나면 그 신호는 계속 유효합니다! 이는 신호를 발생시킨 후 변경될 수 있는 리페인팅 방식의 지표와 중요한 차이점입니다. 리페인팅 방식의 지표는 잠재적으로 자금 손실로 이어질 수 있습니다. 이제 더욱 높은 확률과 정확도로 시장에 진입할 수 있습니다. 또한 화살표가 나타난 후 목표가(
System Trend Pro
Aleksandr Makarov
5 (2)
System Trend Pro - This is the best trend trading indicator!!! The indicator no repaint!!!  The indicator has   MTF   mode, which adds confidence to trading on the trend (   no repaint   ). How to trade? Everything is very simple, we wait for the first signal (big arrow), then wait for the second signal (small arrow) and enter the market in the direction of the arrow. (See screens 1 and 2.) Exit on the opposite signal or take 20-30 pips, close half of it, and keep the rest until the opposite
Smc Blast Signal
Mohit Dhariwal
5 (3)
Full Fledged EA and Alert plus for alerts will also be provided in this offer along with the purchase of Indicator. Limited copies only at this price and Ea too. Grab your copy soon Alert plus for indicator with set file is kept in comment section with the image  SMC Blast Signal with FVG, BOS and trend Breakout The SMC Blast Signal is a Precise trading system for Meta Trader 4 that uses Smart Money Concepts (SMC), including Fair Value Gaps (FVG) and Break of Structure (BOS), to identify high-pr
Currency Strength Wizard
Oleg Rodin
4.84 (55)
통화 강도 마법사는 성공적인 거래를 위한 올인원 솔루션을 제공하는 매우 강력한 지표입니다. 표시기는 여러 시간 프레임의 모든 통화 데이터를 사용하여 이 또는 해당 외환 쌍의 힘을 계산합니다. 이 데이터는 특정 통화의 힘을 확인하는 데 사용할 수 있는 사용하기 쉬운 통화 지수 및 통화 전력선의 형태로 표시됩니다. 필요한 것은 거래하려는 차트에 표시기를 부착하는 것뿐입니다. 표시기는 거래하는 통화의 실제 강세를 보여줍니다. 지표는 또한 추세와 거래할 때 유리하게 사용할 수 있는 구매 및 판매 거래량 압력의 극한값을 보여줍니다. 지표는 또한 피보나치에 기반한 가능한 대상을 보여줍니다. 표시기는 PUSH 알림을 포함한 모든 유형의 알림을 제공합니다. 구매 후 연락주세요. 나는 당신과 거래 팁을 공유하고 당신에게 무료로 훌륭한 보너스 지표를 줄 것입니다! 나는 당신에게 행복하고 유익한 거래를 기원합니다!
Gold Scalper Super
Aleksandr Makarov
5 (2)
Gold Scalper Super is an easy-to-use trading system. The indicator can be used as a standalone scalping system on the M1 time frame, as well as part of your existing trading system. Bonus: when purchasing an indicator, Trend Arrow Super is provided free of charge, write to us after purchase. The indicator 100% does not repaint!!! If a signal appears, it does not disappear! Unlike indicators with redrawing, which lead to the loss of a deposit, because they can show a signal and then remove it.
Volatility Trend System - a trading system that gives signals for entries. The volatility system gives linear and point signals in the direction of the trend, as well as signals to exit it, without redrawing and delays. The trend indicator monitors the direction of the medium-term trend, shows the direction and its change. The signal indicator is based on changes in volatility and shows market entries. The indicator is equipped with several types of alerts. Can be applied to various trading ins
IQ Gold Gann Levels
INTRAQUOTES
5 (4)
Presenting one-of-a-kind Gann Indicator for XAUUSD IQ Gold Gann Levels is a non-repainting, precision tool designed exclusively for XAUUSD/Gold intraday trading. It uses W.D. Gann’s square root method to plot real-time support and resistance levels, helping traders spot high-probability entries with confidence and clarity. William Delbert Gann (W.D. Gann) was an exceptional market analyst whose trading technique was based on a complex blend of mathematics, geometry, astrology, and ancient calcul
Scalper Inside PRO
Alexey Minkov
4.74 (69)
An exclusive indicator that utilizes an innovative algorithm to swiftly and accurately determine the market trend. The indicator automatically calculates opening, closing, and profit levels, providing detailed trading statistics. With these features, you can choose the most appropriate trading instrument for the current market conditions. Additionally, you can easily integrate your own arrow indicators into Scalper Inside Pro to quickly evaluate their statistics and profitability. Scalper Inside
Advanced Currency Strength28 Indicator
Bernhard Schweigert
4.91 (657)
현재 40% 할인 초보자 또는 전문가 트레이더를 위한 최고의 솔루션! 이 지표는 우리가 독점 기능과 새로운 공식을 통합했기 때문에 독특하고 고품질이며 저렴한 거래 도구입니다. 단 하나의 차트로 28 Forex 쌍의 통화 강도를 읽을 수 있습니다! 새로운 추세 또는 스캘핑 기회의 정확한 트리거 포인트를 정확히 찾아낼 수 있기 때문에 거래가 어떻게 개선될지 상상해 보십시오. 사용 설명서: 여기를 클릭  https://www.mql5.com/en/blogs/post/697384 그것이 첫 번째, 원본입니다! 쓸모없는 지망생 클론을 사지 마십시오. 더 스페셜  강력한 통화 모멘텀을 보여주는 하위 창의 화살표 GAP가 거래를 안내합니다! 기본 또는 호가 통화가 과매도/과매도 영역(외부 시장 피보나치 수준)에 있을 때 개별 차트의 기본 창에 경고 표시가 나타납니다. 통화 강도가 외부 범위에서 떨어질 때 풀백/반전 경고. 교차 패턴의 특별 경고 추세를 빠르게 볼 수 있는 다중 시간
Pulse Scalping Line - an indicator for identifying potential pivot points. Based on this indicator, you can build an effective Martingale system. According to our statistics, the indicator gives a maximum of 4 erroneous pivot points in a series. On average, these are 2 pivot points. That is, the indicator shows a reversal, it is erroneous. This means that the second signal of the indicator will be highly accurate. Based on this information, you can build a trading system based on the Martingale
Pip Storm Signal
Camila Bernardez Camero
PIP STORM 신호 PIP STORM 은 변동성이 큰 시장 상황에서 초고빈도 실행을 위해 설계된 화살표 기반의 고급 시스템입니다. 이 시스템의 핵심 목표는 지연되거나 과도하게 사용된 인디케이터에 의존하지 않고, 실행 가능한 스캘핑 신호를 지속적으로 제공하는 것입니다. 예측하지 않고, 가격 전환 구간에 정밀하게 반응하며, 최소한의 실시간 확인 로직을 통해 마이크로 브레이크아웃과 유동성 불균형을 포착합니다. 업데이트 받기 향후 릴리스 및 공지사항을 확인하려면 공식 채널에 가입하세요: https://www.mql5.com/en/channels/signalsandindicators 스캘핑 빈도 이 도구는 조용히 사용하기 위한 것이 아닙니다. PIP STORM 은 활성 시장에서 거의 모든 캔들에 대해 공격적이고 지속적으로 신호를 생성하며, 현재의 방향을 확인하거나 중요한 되돌림을 정밀하게 감지합니다. 신호 해석 시각적으로는 단순하지만, 작동 면에서는 매우 강력합니다: 빨
Apollo SR Master
Oleg Rodin
5 (1)
Apollo SR Master는 지지/저항 구간에서의 거래를 더욱 쉽고 안정적으로 만들어 주는 특수 기능을 갖춘 지지/저항 지표입니다. 이 지표는 지역 가격의 고점과 저점을 감지하여 시간 지연 없이 실시간으로 지지/저항 구간을 계산합니다. 새롭게 형성된 저항 구간을 확인하기 위해 지표는 해당 저항 구간을 실제 매도 또는 매수 신호로 활용할 수 있음을 나타내는 특수 신호를 표시합니다. 이 경우, 저항 구간의 강도가 높아지고, 따라서 저항 구간에서의 성공적인 거래 가능성도 높아집니다. 이것이 바로 이 지표의 핵심 아이디어입니다. SR 존은 손절매와 이익실현을 더욱 쉽게 할 수 있도록 해줍니다. 신호 방향에 따라 SR 존 위 또는 아래 공간을 손절매로 활용할 수 있습니다. 또한, 반대쪽 SR 존은 잠재적 이익실현 영역으로 활용할 수 있습니다. 또한 Apollo SR Master 지표를 사용하는 모든 사용자에게 "Apollo Price Action System" 지표를 무료로 제공합니다.
Basic Harmonic Patterns Dashboard
Mehran Sepah Mansoor
5 (3)
이 대시보드는 선택한 심볼에 대해 사용 가능한 최신 고조파 패턴을 표시하므로 시간을 절약하고 더 효율적으로 사용할 수 있습니다 / MT5 버전 . 무료 인디케이터: Basic Harmonic Pattern 인디케이터 열 Symbol : 선택한 심볼이 나타납니다 Trend : 강세 또는 약세 Pattern : 패턴 유형(가틀리, 나비, 박쥐, 게, 상어, 사이퍼 또는 ABCD) Entry : 진입 가격 SL: 스톱로스 가격 TP1: 1차 테이크프로핏 가격 TP2: 2차 테이크프로핏 가격 TP3: 3차 테이크프로핏 가격 Current price: 현재 가격 Age (in bars): 마지막으로 그려진 패턴의 나이 주요 입력 Symbols : "28개 주요 통화쌍" 또는 "선택한 심볼" 중에서 선택합니다. Selected Symbols : 쉼표로 구분하여 모니터링하려는 원하는 심볼("EURUSD,GBPUSD,XAUUSD")을 선택합니다. 브로커에 쌍에 접미사 또는 접두사가 있는
현재 40% 할인 ! 초보자 또는 전문가 트레이더를 위한 최고의 솔루션! 이 대시보드 소프트웨어는 28개의 통화 쌍에서 작동합니다. 2가지 주요 지표(Advanced Currency Strength 28 및 Advanced Currency Impulse)를 기반으로 합니다. 전체 Forex 시장에 대한 훌륭한 개요를 제공합니다. 고급 통화 강도 값, 통화 이동 속도 및 모든(9) 시간대의 28 Forex 쌍에 대한 신호를 보여줍니다. 추세 및/또는 스캘핑 기회를 정확히 파악하기 위해 차트의 단일 지표를 사용하여 전체 시장을 볼 수 있을 때 거래가 어떻게 개선될지 상상해 보십시오! 잠재적인 거래를 식별하고 확인하면서 강력한 통화와 약한 통화를 더욱 쉽게 식별할 수 있도록 이 지표에 기능을 내장했습니다. 이 표시기는 통화의 강세 또는 약세가 증가 또는 감소하는지 여부와 모든 시간대에서 수행되는 방식을 그래픽으로 보여줍니다. 추가된 새로운 기능은 현재 시장 조건 변화에 적응하는
Advanced Arrow
Alfred Kamal
3.9 (39)
This indicator depends on some secrets equations to draw Signals with Stop loss and maximum 4 Take profits. There is a free EA depends on this indicator as a gift when you purchase/rent it. Features Simply it gives you entry point as Ready sign (Buy / Sell) and arrow (Buy / Sell) after candle closed, also SL line and 4 TP lines or less. Once SL-TP lines are shown with the arrow, they remains as they are until signal change. It is historical indicator. No Repaint. user manual for V5 please click
MetaForecast M4
Vahidreza Heidar Gholami
5 (2)
MetaForecast는 가격 데이터의 조화를 기반으로 모든 시장의 미래를 예측하고 시각화합니다. 시장이 항상 예측 가능한 것은 아니지만 가격에 패턴이 있다면 MetaForecast는 가능한 정확하게 미래를 예측할 수 있습니다. 다른 유사한 제품과 비교했을 때, MetaForecast는 시장 동향을 분석하여 더 정확한 결과를 생성할 수 있습니다. 입력 매개변수 Past size (과거 크기) MetaForecast가 미래 예측을 생성하기 위한 모델을 만드는 데 사용하는 막대의 수를 지정합니다. 모델은 선택한 막대 위에 그려진 노란색 선으로 표시됩니다. Future size (미래 크기) 예측해야 할 미래 막대의 수를 지정합니다. 예측된 미래는 핑크색 선으로 표시되며 그 위에 파란색 회귀선이 그려집니다. Degree (차수) 이 입력은 MetaForecast가 시장에서 수행할 분석 수준을 결정합니다. Degree 설명  0 차수 0의 경우, "Past size" 입력에 모든 봉우리와
Easy ICT Price Action MT4
Han Qin Lin
4.88 (8)
ICT, SMC, 스마트 머니 컨셉트(Smart Money Concept), 지지 및 저항(Support and Resistance), 추세 분석(Trend Analysis), 가격 행동(Price Action), 시장 구조(Market Structure), 주문 블록(Order Blocks), 브레이커 블록(Breaker Blocks), 모멘텀 변화(Momentum Shift), 강한 불균형(Strong Imbalance), HH/LL/HL/LH, 공정 가치 격차(Fair Value Gap), FVG, 프리미엄 및 디스카운트 영역(Premium & Discount Zones), 피보나치 리트레이스먼트(Fibonacci Retracement), OTE, 매수 측 유동성(Buyside Liquidity), 매도 측 유동성(Sellside Liquidity), 유동성 공백(Liquidity Voids), 시장 세션(Market Sessions), NDOG, NWOG, 실버 불릿(Silv
Scalper Vault
Oleg Rodin
5 (35)
Scalper Vault 는 성공적인 스캘핑에 필요한 모든 것을 제공하는 전문 스캘핑 시스템입니다. 이 표시기는 외환 및 바이너리 옵션 거래자가 사용할 수 있는 완전한 거래 시스템입니다. 권장 시간 프레임은 M5입니다. 시스템은 추세 방향으로 정확한 화살표 신호를 제공합니다. 또한 상단 및 하단 신호와 Gann 시장 수준을 제공합니다.  이 시스템은 사용하기가 매우 쉽습니다. 원하는 시장 지역의 화살표만 따라가면 됩니다. 엑시트는 가격이 적정 수준에 도달하거나 시장의 고점 또는 저점 신호가 나타날 때 수행됩니다.  표시기는 PUSH 알림을 포함한 모든 유형의 경고를 제공합니다. 인디케이터 구매 후 연락주세요. 내 개인 거래 권장 사항과 훌륭한 보너스 지표를 무료로 공유합니다! 나는 당신에게 행복하고 유익한 거래를 기원합니다!
이 지표를 구매하면 제 프로페셔널 트레이드 매니저를 무료로 드립니다. 우선 이 거래 시스템이 리페인팅, 리드로잉 및 레이그 인디케이터가 아니라는 점을 강조하는 것이 중요합니다. 이는 수동 및 로봇 거래 모두에 이상적인 것으로 만듭니다. 온라인 강좌, 설명서 및 프리셋 다운로드. "스마트 트렌드 트레이딩 시스템 MT5"은 새로운 및 경험이 풍부한 트레이더를 위해 맞춤형으로 제작된 종합적인 거래 솔루션입니다. 10개 이상의 프리미엄 인디케이터를 결합하고 7개 이상의 견고한 거래 전략을 특징으로 하여 다양한 시장 조건에 대한 다목적 선택이 가능합니다. 트렌드 추종 전략: 효과적인 트렌드 추이를 타기 위한 정확한 진입 및 손절 관리를 제공합니다. 반전 전략: 잠재적인 트렌드 반전을 식별하여 트레이더가 범위 시장을 활용할 수 있게 합니다. 스캘핑 전략: 빠르고 정확한 데이 트레이딩 및 단기 거래를 위해 설계되었습니다. 안정성: 모든 인디케이터가 리페인팅, 리드로잉 및 레이그가 아니므로 신뢰
Weis Wave with Alert
Trade The Volume Waves Single Member P.C.
4.82 (22)
Rental/Lifetime Package Options and Privileges' Rent Monthly Six Months   Yearly/Lifetime Weis Wave with Speed with Alert+Speed Index x x x Manual  x x x Quick Set up Video x x x Blog x x x Lifetime Updates x x x Setup and Training Material x x Rectangle Break Alert Tool      x Discord Access Channel "The SI traders" x   How to trade info visit:    http://www.tradethevolumewaves.com   ** If you purchase please contact me to setup your  : training Room and  complete manual access.  This is
제작자의 제품 더 보기
Main Candles
Igor Semyonov
The indicator detects the following types of Japanese candlesticks: Doji, Hammer and/or Hanging Man, Shooting Star and/or Inverted Hammer, Spinning Top, Maribozu. The indicator is intended for manual and/or automated trading within an Expert Advisor. There is a possibility to choose colors for bullish and bearish candlesticks. For automated trading, use any indicator buffer of the double type: 0, 1, 2 or 3, whose value is not zero!
The indicator is intended for detecting big (long) and/or small (short) candlesticks. There is possibility of coloring the bullish and bearish candlesticks. The indicator can be used for manual and/or automated trading within an Expert Advisor. The indicator data that can be used for automated trading can be taken from one of four buffers of the double type: 0, 1, 2 or 3. Values must not be equal to zero. 
The indicator of DeMark fractals. The indicator can be drawn on the basis of price data and on the basis of a moving average. There is a possibility to color the up and down fractals. The indicator can be used for manual and for automated trading within an Expert Advisor. For automated trading, use any indicator buffer of the double type: 0 - up fractals, 1 - down fractals! Values of the buffers must not be equal to zero.  A moving average is drawn on the basis of input parameters: Calc_Method 
Stochastic Global
Igor Semyonov
4 (1)
Description A universal colored indicator Stochastic. The rising and falling lines and the levels of the indicator can be colored.   The indicator can be calculated as the standard one on the basis of a price or as a derivative on the basis of the following nineteen other indicators included in the standard package of the MetaTrader 4 terminal: AD - an indicator of accumulation and distribution of volume. OBV - On Balance Volume. Volume - tick volume indicator. AC - indicator of acceleration. AO
Description A universal colored indicator MACD Histo. The rising and falling of the indicator histogram can be colored.   The indicator can be calculated as the standard one on the basis of a price or as a derivative on the basis of the following twelve other indicators included in the standard package of the MetaTrader 4 terminal: AD - an indicator of accumulation and distribution of volume. OBV - On Balance Volume. Volume - tick volume indicator. Force - Force Index indicator. MFI - Money Flow
Description A colored universal indicator MACD Line (MA convergence-divergence indicator, shown as a histogram). The rising and falling of the indicator histogram can be colored. The indicator can be calculated as the standard one on the basis of a price or as a derivative on the basis of the following twelve other indicators included in the standard package of the MetaTrader 4 terminal: AD - an indicator of accumulation and distribution of volume. OBV - On Balance Volume. Volume - tick volume i
RSI Global
Igor Semyonov
Description A universal indicator RSI together with moving averages based on it. Depending on the need, moving averages can be disabled. You can color the indicator lines and levels: lines of RSI, moving average lines and thresholds of overbought and oversold levels.   The indicator can be calculated as the standard one on the basis of a price or as a derivative on the basis of the following eighteen other indicators included in the standard package of the MT4 terminal: AD - an indicator of accu
CCI Global
Igor Semyonov
5 (1)
Description A universal indicator CCI together with moving averages based on it. Depending on the need, moving averages can be disabled. You can color the indicator lines and levels: lines of CCI, moving average lines and thresholds of overbought and oversold levels.   The indicator can be calculated as the standard one on the basis of a price or as a derivative on the basis of the following eighteen other indicators included in the standard package of the MetaTrader 4 terminal: AD - an indicato
Description A multi-purpose multi-colored/multi-symbol indicator, which is a set of standard tools from the MetaTrader 4 terminal. The difference is that below the basic price chart it allows to calculate and build in a separate window any of the twenty indicators in a colored form, painting bulls and bears in different colors, for any financial instrument in accordance with the list below:  AD - an indicator of accumulation and distribution of volume. OBV - On Balance Volume. Force - Force Inde
AO Global
Igor Semyonov
Description A colored universal indicator AO (Awesome Oscillator). The rising and falling of the indicator histogram can be colored.   The indicator can be calculated as the standard one or as a derivative on the basis of the following eleven other indicators included in the standard package of the MetaTrader 4 terminal: AD - an indicator of accumulation and distribution of volume. OBV - On Balance Volume. Volume - tick volume indicator. Force - Force Index indicator. MFI - Money Flow Index. ATR
Description A colored universal indicator MACD Classic (MA convergence-divergence indicator) that combines two indicators: MACD Line and MACD Histo. The rising and falling lines, the signal line and the indicator histogram can be colored. The indicator can be calculated as the standard one on the basis of a price or as a derivative on the basis of the following twelve other indicators included in the standard package of the MetaTrader 4 terminal: AD - an indicator of accumulation and distributio
Description The universal colored multicurrency/multisymbol indicator MACD Classic, consisting of two MACD indicators: MACD Line and MACD Histo. The indicator may be used with any broker, irrespective of the name of the financial instrument since it is necessary to manually enter the name as an input parameter. If you enter a non-existent or incorrect name of a financial instrument, you will receive an error message that this financial instrument is unknown (does not exist). Inputs Currency_Nam
Description A colored universal indicator/oscillator based on crossing moving averages. The rising and falling lines of the indicator histogram can be colored. The combined use of the line and the histogram increases the level of the analysis when making a decision to open or close deals. The indicator can be calculated as the standard Price Oscillator or as a derivative on the basis of the following eleven other indicators included in the standard package of the MetaTrader 4 terminal: AD - an i
Description A universal colored multicurrency/multi-symbol indicator RAVI. Was proposed by T. Chand as a trend indicator. RAVI means Range Action Verification Index. The indicator may be used with any broker, irrespective of the name of the financial instrument since it is necessary to manually enter the name as an input parameter. If you enter a non-existent or incorrect name of a financial instrument, you will receive an error message that this financial instrument is unknown (does not exist).
Description A colored multicurrency/multisymbol oscillator of the market mood. The oscillator is designed for detecting the continuation or change of the market mood prior to its occurrence. An excellent example is the screenshots that show all the features of the oscillator. The oscillator may be used with any broker, irrespective of the name of the financial instrument since it is necessary to manually enter the name as an input parameter. If you enter a non-existent or incorrect name of a fin
Inside Bar
Igor Semyonov
Description The indicator determines the appearance of internal bars on the chart, and paints them in accordance with the bullish and/or bearish mood. The indicator can notify of the appearance of a formed internal bar by playing a beep, as well as display the time remaining until the end of the formation of the current bar in the format of <d:h:m:s, where: < means the current bar. d - days. h - hours. m - minutes. s - seconds. The bullish and bearish mood can be colored. Inputs Sound_Play - a
Reversal Bars
Igor Semyonov
Description The indicator determines the appearance of the bars that signal of a reversal of current local moods and plays a beep. It also paints these bars in accordance with the bullish and/or bearish priority. You can select the color for bullish and bearish moods. Inputs Sound_Play - a flag that allows the sound notification. Use Detection of the reversal bar can be a signal to perform appropriate trading activities.  The indicator can be used for manual or automated trading in an Expert A
Description The indicator determines the appearance of bars that notify of the reversal of the current trend, and paints them in accordance with the bullish and/or bearish mood. The indicator can notify of the appearance of a formed reversal bar by playing a beep, as well as display the time remaining until the end of the formation of the current bar in the format of <d:h:m:s, where: < means the current bar. d - days. h - hours. m - minutes. s - seconds. You can select the color for bullish and
Description A universal colored multicurrency/multi-symbol indicator of moving averages: Moving Average, Double Moving Average, Triple Moving Average . The indicator is drawn in a separate window, so below the main trading chart a user can see the development of another financial instrument. It is very useful when considering the combined values of various moving averages for different financial instruments below the main trading chart.  The indicator may be used with any broker, irrespective of
Description A universal colored indicator of moving averages: Moving Average, Double Moving Average, Triple Moving Average . The indicator provides various opportunities for the analysis of prices based on different ways of constructing moving averages in the window of the main financial instrument. You can color bullish and bearish moods. Inputs MA_Type - type of multiplicity: Moving Average. Double Moving Average. Triple Moving Average. MA_Period - the MA period. MA_Method - the averaging met
Description A colored universal multicurrency/multi-symbol indicator Bollinger Bands to be drawn in a separate window below the main financial instrument. The rising and falling line of the main indicator and Bollinger Bands can be colored. The indicator can be calculated based on one of the eleven basic indicators included in the standard package of the MetaTrader 4 terminal: AD - an indicator of accumulation and distribution of volume. OBV - On Balance Volume. Force - Force Index indicator. MF
Description A colored universal multicurrency/multi-symbol indicator Channel to be drawn in a separate window below the main financial instrument. The indicator uses the calculation method of the Price Channel indicator. The rising and falling line of the main indicator and the Channel lines can be colored. The indicator can be calculated based on one of the eleven basic indicators included in the standard package of the MetaTrader 4 terminal: AD - an indicator of accumulation and distribution o
Keltner Channel
Igor Semyonov
5 (1)
Description Keltner's colored channel indicator,also called STARC band, drawn in the main chart window. The indicator uses the calculation technique of the three drawing options: basic, improved and modified . The first two were proposed by Keltner, the third one - by a successful trader L. Rakshe. You can also search for your own best parameters of the indicator. The upper, middle and lower bands can be colored. The indicator includes the basic analytical tool of the market moods by Keltner. Th
ZigZag Global
Igor Semyonov
Description A colored universal multicurrency/multi-symbol indicator ZigZag to be drawn in a separate window below the main financial instrument. The indicator may be used with any broker, irrespective of the name of the financial instrument since it is necessary to manually enter the name as an input parameter. If you enter a non-existent or incorrect name of a financial instrument, you will receive an error message that this financial instrument is unknown (does not exist).  The indicator can
Description A colored channel indicator Price Channel to be drawn on the main chart of a financial symbol. It can color bullish and bearish moods based on the middle line of the indicator, as well as change the color of the upper and lower lines of the channel. Purpose The indicator can be used for manual or automated trading in an Expert Advisor. Values of indicator buffer of the double type can be used for automated trading:  The middle line of the indicator - buffer 4. The upper line of the
Description Candlesticks is a colored multicurrency/multy-symbol indicator. It shows a financial instrument as a candlestick chart in a separate window below the chart of the main financial symbo. The indicator may be used with any broker, irrespective of the name of the financial instrument since it is necessary to manually enter the name as an input parameter. If you enter a non-existent or incorrect name of a financial instrument, you will receive an error message that this financial instrume
Description Candlestick Tools  is a colored multicurrency/multy-symbol indicator. It shows one of four standard indicators as a candlestick chart in a separate window below the chart of the main financial symbol. The indicator is calculated based on one of two indicators included in the standard package of the МetaТrader 4 terminal: CCI - Commodity Channel Index. RSI - Relative Strength Index. The default indicator is Commodity Channel Index. The indicator may be used with any broker, irrespecti
Pivot Pro
Igor Semyonov
Description Pivot Pro  is a universal color indicator of the  Pivot Points  levels systems. You can select one of its three versions:  Standard   Old , Standard New  and  Fibo . The system will automatically calculate the  Pivot Point  on the basis of market data for the previous day ( PERIOD_D1 ) and the system of support and resistance levels, three in each. It can also display price tags for each level. You can color the indicator lines. Only a method of calculation of the third level of supp
Price Levels
Igor Semyonov
Description The indicator is intended for labeling the chart using horizontal levels and/or half-round prices. The indicator works on any financial instrument regardless of the name and the number of digits. A user can choose colors for the indicator lines. Input Parameters Calc_Method - method of calculation of the lines: levels of round prices. levels of half-round prices. Digits_Accepted - flag for calculating the levels according to number of decimal places in the quotes of a financial inst
Description A colored universal multicurrency/multi-symbol indicator MACD Line Smart (the indicator moving average convergence divergence is displayed as a histogram) based on double or triple moving average .  Comparing to the standard MACD this indicator is more sensitive to what allows generating advance signals. he indicator may be used with any broker, irrespective of the name of the financial instrument since it is necessary to manually enter the name as an input parameter. If you enter a
필터:
리뷰 없음
리뷰 답변