Trend Sight
- Indicadores
- Versión: 1.1
- Actualizado: 24 marzo 2022
- Activaciones: 5

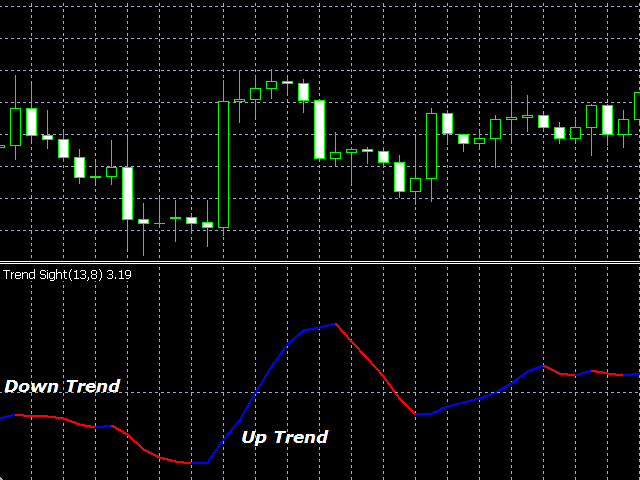
El indicador Trend Sight muestra el cambio porcentual de la Media Móvil desde la barra actual hasta la otra barra seleccionada, lo que le permite realizar un seguimiento de la tasa de cambio suavizada del precio, así como de la fuerza y el cambio de la tendencia.
La tendencia alcista se muestra como una línea azul del indicador, mientras que la tendencia bajista se muestra en rojo.
Cierre una posición corta y abra una larga si el color de la línea cambia de rojo a azul.
Cierre una posición larga y abra una corta si el color de la línea cambia de azul a rojo.
Debe utilizar un stop loss ajustado, ya que el color y la dirección de la línea pueden cambiar repentinamente.
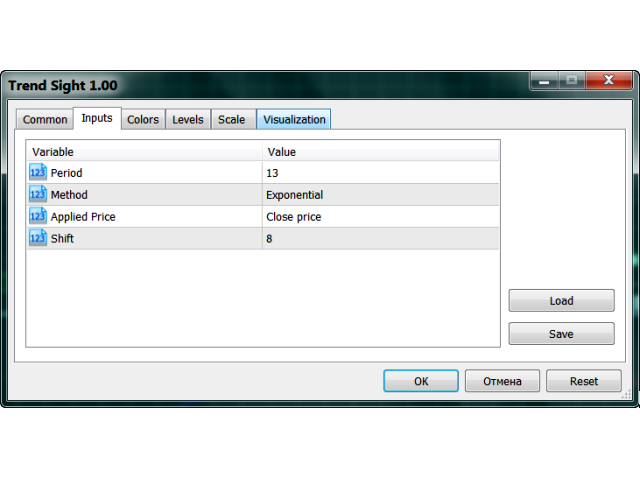
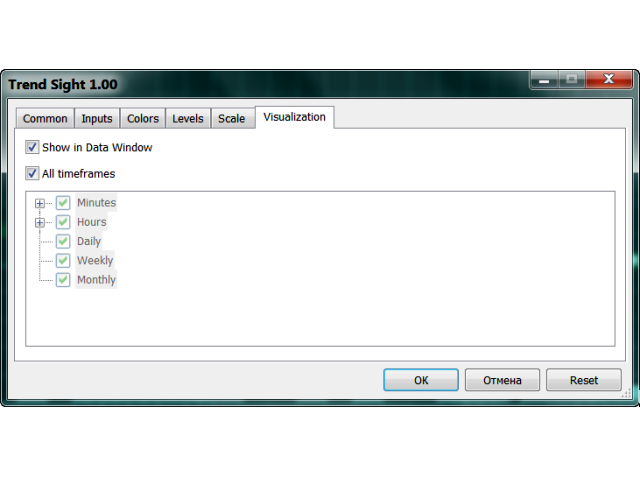
La pestaña Entradas del indicador le permite seleccionar:
- Periodo de suavización de la media móvil
- Método de suavizado de la media móvil (Simple, Exponencial, Suavizado, Lineal ponderado)
- Precio aplicado (Cierre, Apertura, Máximo, Mínimo, Mediano, Típico, Ponderado)
- Desplazamiento de la Media Móvil de la barra actual a la otra barra seleccionada
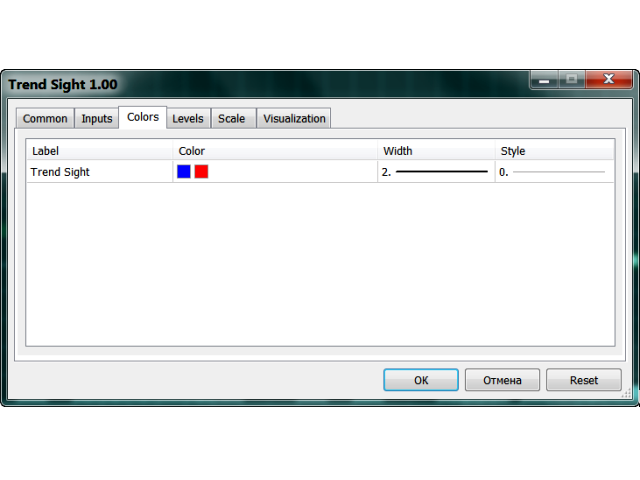
La pestaña Colores permite seleccionar el color, la anchura y el estilo de la línea.
Parámetros
- período - período de la MA;
- método - método de suavizado (Simple, Exponencial, Suavizado, Lineal ponderado);
- precio aplicado - valor elegido (Cierre, Apertura, Máximo, Mínimo, Mediana, Típico, Ponderado);
- shift - desplazamiento de la Media Móvil de barra a barra a una distancia de Shift.
Nota: si Shift es menor que 1 o mayor que Period, aparece la siguiente alerta: "Valor de Shift incorrecto. El indicador utilizará el valor de Shift = Period.


El usuario no ha dejado ningún comentario para su valoración