K Channel

K_Channel is a technical indicator defining the current Forex market status - trend or flat.

The indicator works on any timeframe. H1 and higher timeframes are recommended though to minimize false signals.

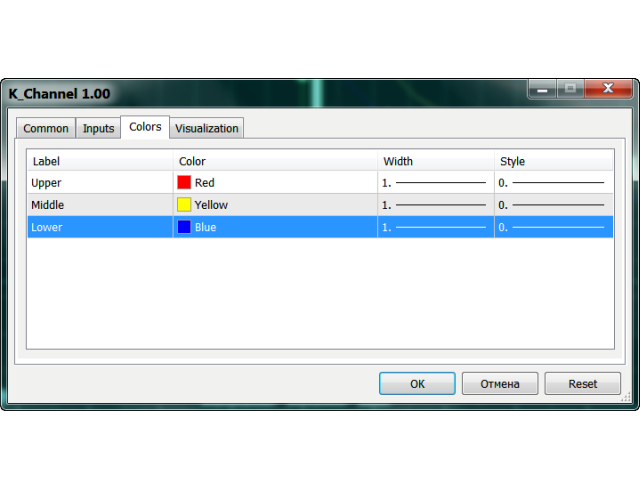
The indicator is displayed as lines above and below EMA. Average True Range (ATR) is used as bands' width.

Therefore, the channel is based on volatility. This version allows you to change all the parameters of the main Moving Average.

Unlike Bollinger Bands that applies the standard deviation value, К_Channel uses maximum and minimum prices within a period.

K_Channel indicator is calculated by the following formula:

Upper Level = EMA13 (Typical Price) + EMA13 (Trading Range)

Lower Level = EMA13 (Typical Price) - EMA13 (Trading Range),

Trading Range = max(high(t), low(t))- min(high(t), low(t)), where

high(t) - highest price of the current period,

low(t) - lowest price of the current period.
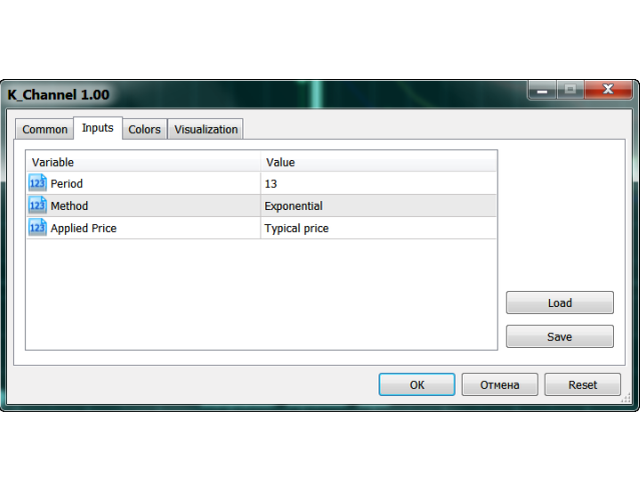

Parameters

  • period - number of bars used for the indicator calculations;
  • method - select from the four Moving Averages;
  • apply to - select from the seven applied price types.
おすすめのプロダクト
KDJ Index 4   交易实用必备工具指标 波浪自动计算指标,通道趋势交易 完美的趋势-波浪自动计算通道计算 , MT4版本 完美的趋势-波浪自动计算通道计算 , MT5版本 本地跟单复制交易 Easy And Fast Copy , MT4版本 Easy And Fast Copy , MT5版本 本地跟单复制交易 模拟试用 Easy And Fast Copy , MT4 模拟账号运行 Easy And Fast Copy , MT5 模拟账号运行 "Cooperative QQ:556024  "  "Cooperation wechat:556024"  "Cooperative email:556024@qq.com" 强烈推荐趋势指标, 波浪的标准自动计算   和   波浪的标准自动计算MT5版本     KDJ指标又叫 随机指标 ,是一种相当新颖、实用的技术分析指标,它起先用于期货市场的分析,后被广泛用于股市的中短期趋势分析,是期货和股票市场上最常用的技术分析工具。 随机指标KDJ一般是用于股票分析的统计体系,根据统计学原理,通过一个特定的周期(常为9日、9周等)
Universal Soul Reaper is an atmospheric market-flow oscillator designed to interpret price behavior as a cycle of spiritual energy. Instead of reacting to raw price alone, it visualizes the state of the market’s soul —revealing when momentum is awakening, stabilizing, or fading. The indicator operates in a separate window and presents three interwoven entities: the Ectoplasmic Veil , the Spirit Boundary , and the Soul Core . Together, they form a living framework that helps traders sense pressu
Liquidity Touch Zones PRO X - is   a support and resistance indicator that identifies   price areas of confirmed strength   formed by repeated price interactions and displayed taking into account the instrument's characteristic volatility. The calculation is based on fractal points, which serve as initial benchmarks. These points form price zones reflecting repeated price interactions and are represented as areas of varying heights depending on the level's significance. It is designed for trader
LBR Oscillator
Pablo Filipe Soares De Almeida
LBR Oscillator – 3/10 Oscillator LBR Oscillator は、プロトレーダーであるリンダ・ラシュキによって広く使用・普及された、クラシックな 3/10 Oscillator を改良したバージョンです。 本インジケーターは、リンダ・ラシュキが使用している元の標準設定に基づいて開発されており、3期間および10期間の移動平均と、16期間のシグナルラインを使用し、モメンタムと市場リズムの変化を読み取ることに重点を置いています。 概念的基盤 – リンダ・ラシュキによる 3/10 Oscillator の使い方 リンダ・ラシュキは、3/10 Oscillator を単なる自動売買シグナル生成器としてではなく、モメンタム確認ツールとして使用しています。 主な用途は以下の通りです: モメンタムの加速と減速を識別 トレンド中の押し目・戻りを確認 市場方向の短期的な変化を予測 プライスアクション、移動平均、トレンド環境と組み合わせて使用 注目点は、ヒストグラムの挙動、傾き、方向転換であり、単純なクロスではありません。 ヒストグラムは、短期移動平均(3期間)と長期移動平
Combined
Ahmed Alaaeldin Abdulrahman Ahmed Elherzawi
5 (1)
Welcome to Investment Castle products This product is exclusively available in the MQL5 market and is not available and will not be available anywehere else. The Combined indicator is a multi-time frame indicator and it is built using 3 indicators: Bands indicator which draws the support and resistance key levels using up to 5 different time frames Patterns indicator which draws the chart patterns using up to 6 different time frames Spots indicator which shows the common candlestick patterns Yo
Overview: This technical indicator applies a double smoothing algorithm to the standard Heiken Ashi calculation. It is designed to filter market noise and visualize the market structure clearly without the lag associated with standard moving averages. The tool allows the user to select different Moving Average types, including Hull Moving Average (HMA) and Linear Weighted Moving Average (LWMA) , to calculate the open, high, low, and close prices of the candles. Key Features: Double Smoothing En
FREE
これは、価格ラベル付きのAdvanced ZigZagDynamic および/または ExtendedFractals インジケーターの極値に基づくサポートおよびレジスタンスレベルのMTFインジケーターです(無効にすることができます)。 MTFモードでは、より高いTFを選択できます。デフォルトでは、レベルはZigZagインジケータードットに基づいて生成されます。フラクタルインジケータードットは、ZigZagと一緒に、またはその代わりに使用することもできます。使用を簡素化し、CPU時間を節約するために、計算はバーの開口部ごとに1回実行されます。 パラメーター: ForcedTF-レベル計算のチャート時間枠(現在の時間枠と等しいか、それを超える場合があります) MinPipsLevelWidth-ポイント単位の最小レベル幅(非常にタイトなレベルに使用) Use ZigZag Extremums points -ZigZagピークを使用してサポート/抵抗レベルを計算することを有効/無効にします Fixed pips range -ジグザグインジケーターを計算するための最小値と最大値の間の距離
ZLMA Trend Candles indicator uses an enhanced Zero-Lag Moving Average to highlight key trend shifts, repainting candles in real time. It reacts faster than traditional moving averages, helping you spot potential market turns earlier. Gain clear entry and exit signals and filter out market noise with ease! This product is also available for MetaTrader 4 =>  https://www.mql5.com/en/market/product/129279 1. What Is ZLMA Trend Candles? ZLMA Trend Candles is a MetaTrader 4/5 indicator based on the Z
Price Magnet — Price Density and Attraction Levels Indicator Price Magnet is a professional analytical tool designed to identify key support and resistance levels based on statistical Price Density. The indicator analyzes a specified historical period and detects price levels where the market spent the most time. These zones act as “magnets,” attracting price action or forming a structural base for potential reversals. Unlike traditional Volume Profile tools, Price Magnet focuses on price-time d
- Real price is 200$ - 50% Discount (It is 99$ now) -   It is enabled for 2 purchases. Contact me for extra bonus (Gann Trend indicator), instruction or any questions! - Non-repaint, No lag - I just sell my products in Elif Kaya Profile, any other websites are stolen old versions, So no any new updates or support. - Lifetime update free Gann Gold EA MT5 Introduction W.D. Gann’s theories in technical analysis have fascinated traders for decades. It offers a unique approach beyond traditional cha
CosmiCLab SMC FIBO CosmiCLab SMC FIBO is a professional trading indicator designed for traders who use Smart Money Concepts (SMC), market structure analysis and Fibonacci retracement levels. The indicator automatically detects market swings and builds Fibonacci levels based on the latest impulse movement. It also identifies market structure changes such as BOS (Break of Structure) and CHOCH (Change of Character), helping traders understand the current market direction. CosmiCLab SMC FIBO also pr
Ichimoku Aiko MTF
Michael Jonah Randriamampionontsoa
Ichimoku Aiko MTF is a collection of technical indicators that show support and resistance levels, as well as momentum and trend direction. It is a multi-timeframe indicator so you don't need to change the chart timeframe when you want to see the ichimoku clouds on a higher timeframe.  eg. The chart timeframe is M15 and you want to see on the M15 timeframe chart the H1 ichimoku indicators (the ichimoku in Metatrader can't do that) that's why you need to use Ichimoku Aiko MTF.
Pyjama Chart is a comprehensive technical analysis toolkit for MetaTrader 5, designed to automatically map key historical price structures and key zones on your chart. This professional utility automates the manual charting process for several advanced price-action concepts. It dynamically detects and renders structure points, trend continuation markers, supply/demand imbalances, volatility-based zones, and areas of potential liquidity, providing a complete structural blueprint of the market at
Do you, like me, like to trade with the trend? Then this indicator will help you! Rainbow Trend is a trend indicator, which uses several Moving Averages on the chart. It measures different trend strenght zones for different periods: very long term, long term, mid term, short term and very short term. Each zone has its color, and it is possible to have sound alert when the prices leaves a zone and enters another. Its configuration is very simple. If you find any bug or have any suggestions, conta
トレンドに逆らった取引はもうやめましょう! 正確でタイムリーな情報を重視する真剣なトレーダーのために綿密に設計された当社のインジケーターは、28の主要ペアを非常にシンプルな方法で俯瞰することができます。このツールは、人気、強気または弱気のトレンドの強さ、買い手と売り手の割合/ MT5 バージョンに基づいて通貨ペアをランク付けすることができます。 特徴 リアルタイムのトレンド強度: 各通貨ペアのトレンドの強さを正確に評価し、取引機会を特定するための確かなガイドを提供します。 買い手と売り手の分析: 各ペアの買い手と売り手の強さランキングにより、市場のダイナミクスを即座に把握し、重要な動きを予測することができます。 トレーダーの関心: 各通貨ペアのトレーダーの関心と活動に関するデータにアクセスし、新たなトレンドと潜在的な転換点をよりよく理解するのに役立ちます。 直感的でカスタマイズ可能なダッシュボード: 当社の使いやすいダッシュボードは、お客様の好みに合わせて表示をカスタマイズすることができ、一目で関連情報を得ることができます。 リアルタイム更新: リアルタイム更新により、市場の
市場ボリュームプロファイル指標 + スマートオシレーター。通貨ペア、株式、先物、暗号資産など、ほぼすべての銘柄で動作し、リアルボリュームとティックボリュームの両方に対応しています。プロファイル作成範囲は、1週間や1ヶ月などの自動設定のほか、境界線(赤と青の2本の垂直線)を動かして手動で設定することも可能です。ヒストグラム形式で表示され、特定の価格レベルにおけるヒストグラムの幅は、その価格帯で行われた取引量(約定数)を表します。 Mode level line color パラメータを使用すると、価格が反発する可能性が高い重要なボリュームレベルを自動表示できます。また、 Maximum color パラメータは、指定した範囲全体で最も取引が集中した最大ボリュームレベルを個別に表示します。 スマートオシレーターは買われすぎ・売られすぎのゾーンを表示します。複数のインジケーターからの情報を分析し、処理されたデータに基づいて、買われすぎと売られすぎのゾーンを対応する色で塗りつぶします。 Volume every day では、 Range period パラメータでプロファイル作成の時間間隔を
it depends on ATR period to get swing points to help make better trading decisions  blue dot and red dot is the default color scheme of course you can change it later if you'd like  you can change the following : ATR PERIOD  sending notifications number of times to send notifications  sending notifications to your smart phone that's it very simple to use just drag and drop and follow the trend 
# XAUUSD Gold Master v4.1 — Professional Gold Trading Indicator for MetaTrader 5 Gold Master v4.1 is a comprehensive, professional-grade trading indicator developed exclusively for XAUUSD (Gold) on MetaTrader 5. It combines multiple technical analysis disciplines into a single, unified system designed to identify high-probability trading opportunities in the gold market. The indicator integrates signal generation, risk management, market context analysis, and a fully interactive information pa
This indicator combine DOW theory with Fibonancy level to determine the structure of financial markets. It include resistance determine to provide an overview of the market. The Dow Theory is an approach to trading developed by Charles H. Dow, who, with Edward Jones and Charles Bergstresser, founded Dow Jones & Company, Inc. and developed the Dow Jones Industrial Average in 1896. In summarize, DOW theory is: + Technical framework that predicts the market is in an upward trend if one of its aver
Auto Optimized RSI   は、正確な売買シグナルを提供するために設計された、使いやすいスマートな矢印インジケーターです。過去のデータを使ったトレードシミュレーションに基づき、各通貨ペアや時間足に最適なRSIの買い/売りレベルを自動で見つけ出します。 このインジケーターは、独立したトレードシステムとしても、既存の戦略の一部としても使用できます。特に短期トレーダーにとって便利なツールです。 従来のRSI(70/30など)の固定レベルとは異なり、 Auto Optimized RSI   はリアルな価格の動きとバックテスト結果に基づき、ダイナミックにレベルを調整します。勝率、ドローダウン、平均利益/損失といった重要な統計をモニターし、現在の市場に適応して、本当に機能するシグナルを提供します。 RSIが最適化されたレベルをクロスすると、チャート上に買い・売りの矢印が表示され、成功率の高いエントリーポイントを見つけるのに役立ちます。 ご購入後にご連絡いただければ、追加のツールや特別なトレードのヒントを無料でお渡しいたします! 皆様のトレードが成功しますように!
Precision Arrows – TPとSLを内蔵したスマートエントリーシグナル Precision Arrows は、 正確性・明瞭性・信頼性 を求めるトレーダーのために設計された高性能トレーディングインジケーターです。 高確率の買い・売りシグナルを検出し、自動的に テイクプロフィット(TP) と ストップロス(SL) のレベルを設定。 FX・株価指数・暗号資産・シンセティックインデックス など、あらゆる市場で規律的かつ一貫したトレードをサポートします。 このインジケーターは、精密なシグナル検出、インテリジェントなフィルタリング、そしてマルチタイムフレームトレンドダッシュボードを組み合わせ、あらゆる相場環境に対応する完全なトレーディングソリューションを提供します。 期間限定オファー Precision Arrows は現在、 75ドル(永久ライセンス) でご利用可能です。 (通常価格: 199.99ドル / オファー延長中) 重要: ご購入後すぐにご連絡ください。使用手順と 特別ボーナス をお送りします。 主な機能 3つのトレードモード お好みのスタイルに合わせて、 スキャルピ
Visual Dolphin Indicator
AL MOOSAWI ABDULLAH JAFFER BAQER
Visual Dolphin Indicator Unlock the rhythm of the market with the Visual Dolphin Indicator, your ultimate tool for identifying and capitalizing on market trends with clarity and confidence. Designed for both novice and experienced traders, this indicator eliminates the noise and guesswork, providing crystal-clear buy and sell signals directly on your chart. The Logic Behind the Waves The core of the Visual Dolphin Indicator is a sophisticated yet intuitive dual-wave system based on moving avera
プレミアムレベルは、正しい予測の精度が80%を超える独自の指標です。 この指標は、最高のトレーディングスペシャリストによって2か月以上テストされています。 あなたが他のどこにも見つけられない作者の指標! スクリーンショットから、このツールの正確さを自分で確認できます。 1は、1キャンドルの有効期限を持つバイナリーオプションの取引に最適です。 2はすべての通貨ペア、株式、商品、暗号通貨で機能します 手順: 赤い矢印が表示されたらすぐにダウントレードを開き、青い矢印が表示されたら閉じます。青い矢印の後に開くこともできます。 試してテストしてください!推奨設定はデフォルトです! 日足チャートで最高の精度を示します! インディケータは、2600 Pipsの収益性に対して、約10Pipsという非常に小さなマージンを使用します。
Features All Ichimoku Signals (Selectable) : Display all reliable signals generated by the Ichimoku indicator. You can choose which signals to view based on your preferences. Filter by Signal Strength : Sort signals by their strength—whether they are weak, neutral, or strong. Live Notifications : Receive real-time notifications for Ichimoku signals. Transparent Cloud : Visualize the Ichimoku cloud in a transparent manner. Available Signals Tenkensen-Kijunsen Cross Price-Kijunsen Cross Price-C
The Slope indicator   measures the slope of a linear regression , which is the line of best fit for a data series. A 20-period Slope, therefore, measures the slope of a 20-day linear regression. ... In general, a positive slope indicates an uptrend, while a negative slope indicates a downtrend. How do you use slope Indicator? By applying the slope indicator  to both the price chart and the price relative , chartists can quantify the price trend and relative performance with one indicator. A pos
Koryu Delta Koryu DeltaはMetaTrader 5のインジケーターです。ピボットポイント分析とデルタボリュームデータを用いてトレンドの反転ポイントを特定します。マーケットシフトパターンを検出し、市場の動向に基づいたシグナルを表示します。このツールは、スキャルピング、スイングトレード、または長期投資を行うトレーダーにご利用いただけます。最大500本のヒストリカルバーを分​​析し、過去のパターンを見つけ出します。シグナルにはクローズドバーロジックを採用しています。 Koryu Deltaの機能 パターン検出:ピボット分析を用いて、強気と弱気のマーケットシフトパターンを特定します。 デルタボリューム分析:ティックボリュームとローソク足構造を用いて、買い圧力と売り圧力を表示します。デルタ表示は調整可能です。パターン範囲内の各ローソク足のボディサイズ、ウィック比率、ティックボリュームを検証することでデルタを計算します。 サポートレベルプロット:検出されたパターンのサポートレベル(エントリー、ストップロス(SL)、3つのテイクプロフィット(TP)レベル)を描画します。それ
FREE
The Predicting Donchian Channel MT5 indicator allows predicting the future changes in the levels of the Donchian channel based on the channel position of the price. The standard ZigZag indicator starts drawing its ray in 99% of the time the opposite Donchian channel is touched. The forecast of the channel boundary levels will help in finding the points, where the correction ends or the trend changes, an also to estimate how soon those events can occur. Configurations Period - Donchian channel c
All about time and price by ICT. This indicator provides a comprehensive view of ICT killzones, Silver Bullet times, and ICT Macros, enhancing your trading experience.  In those time windows price either seeks liquidity or imbalances and you often find the most energetic price moves and turning points. Features: Automatic Adaptation: The ICT killzones intelligently adapt to the specific chart you are using. For Forex charts, it follows the ICT Forex times: In EST timezone: Session: Asia: 20h00-0
Elliott Wave Oscillator Pro for MetaTrader 5 Elliott Wave Oscillator Pro is a precision momentum analysis tool designed to help traders visualize wave structure, trend strength, and market rhythm in real time. By calculating the difference between fast and slow moving averages, the oscillator reveals the internal energy of price movement, allowing traders to better anticipate shifts in momentum and potential wave transitions. This indicator transforms complex Elliott-based momentum behavior into
TRD Trend Range Detector MT5 — Market Regime Identification Indicator TRD Trend Range Detector MT5 is a technical analysis tool designed to identify market regimes. The indicator distinguishes between trending and consolidating (ranging) markets in real-time using a multi-factor algorithm. Market Regime Identification Many trading strategies are dependent on specific market conditions. TRD Trend Range Detector MT5 serves as a filter to identify when a trend is established or when the market is e
このプロダクトを購入した人は以下も購入しています
SuperScalp Pro
Van Minh Nguyen
4.55 (20)
SuperScalp Pro — 高度なマルチフィルター対応スキャルピングインジケーターシステム SuperScalp Pro は、クラシックな Supertrend と複数のインテリジェントな確認フィルターを組み合わせた高度なスキャルピング用インジケーターシステムです。M1〜H4 のすべての時間足で効率的に機能し、特に XAUUSD、BTCUSD、および主要なFX通貨ペアに適しています。単体のシステムとして、また既存の取引戦略へ柔軟に統合して使用できます。 本インジケーターは 11 以上のフィルターを統合しており、短期・長期の EMA、トレンド判定に用いる 3 本の EMA、EMA スロープ(EMA slope)、RSI、ADX、出来高、VWAP、ボリンジャーバンドのブレイクアウト、MACD ダイバージェンスフィルターなどを含みます。スマートキャンドルフィルターはローソク足の終値を確認して弱いシグナルを排除し、3 本の EMA と MACD ダイバージェンスを組み合わせたトレンド認識メカニズムにより勝率の高いシグナルの選別を支援します。 SuperScalp Pro は ATR に基
Azimuth Pro
Ottaviano De Cicco
5 (6)
Azimuth Pro V2:MT5向けシンセティック・フラクタル構造分析と確認済みエントリー 概要 Azimuth Pro は Merkava Labs によるマルチレベルスイング構造インジケーターです。4つのネストされたスイングレイヤー、スイングアンカーVWAP、ABCパターン検出、3タイムフレーム構造フィルタリング、そして確定バーでの確認済みエントリー — 1つのチャートで、ミクロスイングからマクロサイクルまでを網羅するワークフロー。 これはブラインドシグナル製品ではありません。ロケーション、コンテキスト、タイミングを重視するトレーダーのための構造ファーストワークフローです。 V2発売記念オファー — Azimuth Pro V2をUSD 399で(次の100本)。最終価格:USD 499。 1. V2での変更点 シンセティック・マルチタイムフレームエンジン 上位タイムフレーム分析をMeridian Proと同じ独自のシンセティックアーキテクチャで一から再構築。よりクリーンなHTFコンテキスト、安定したライブ動作、従来のMTF同期問題なし。シンセティックエンジンは 固定比率タ
Entry In The Zone and SMC Multi Timeframe is a real-time 2-in-1 market analysis tool that combines market structure analysis and a No Repaint BUY / SELL signal system into a single indicator, built on Smart Money Concepts (SMC) — a widely adopted framework used by professional traders to understand market structure. This indicator helps you see the market more clearly, make decisions based on structure rather than guesswork, and focus on high-probability zones where price is more likely to react
Power Candles – あらゆる市場に対応した強度ベースのエントリーシグナル Power Candles は、Stein Investments が長年培ってきた強度分析を価格チャート上に直接反映します。価格だけに反応するのではなく、各ローソク足は実際の市場の強さに基づいて色分けされ、モメンタムの蓄積、強度の加速、明確なトレンド転換を瞬時に把握できます。 すべての市場に共通する単一ロジック Power Candles は すべての取引シンボル で自動的に動作します。現在のシンボルが Forex か非 Forex 市場かを自動判別し、内部で適切な強度モデルを適用します。 Forex および Gold :FX Power のデルタ値を使用(絶対値レンジ最大 100) 指数、暗号資産、CFD :IX Power の強度値を使用(絶対値レンジ最大 50) 必要な強度計算は Power Candles に直接組み込まれています。ローソク足のカラーリングやシグナルロジックに、追加のインジケーターは不要です。 価格ノイズではなく「強度状態」 各ローソク足は、以下の 9 つの明確に定義された強
このインジケーターを購入された方には、以下の特典を 無料 で提供しています: 各トレードを自動で管理し、ストップロスとテイクプロフィットを設定し、戦略ルールに基づいてポジションを決済する補助ツール 「Bomber Utility」 様々な銘柄に合わせたインジケーターの設定ファイル(セットファイル) 「最小リスク」、「バランスリスク」、「待機戦略」 の3つのモードで使用できる Bomber Utility 用の設定ファイル このトレーディング戦略をすぐに導入・設定・開始できる ステップバイステップのビデオマニュアル ご注意: 上記の特典を受け取るには、MQL5のプライベートメッセージシステムを通じて販売者にご連絡ください。 オリジナルのカスタムインジケーター 「Divergence Bomber(ダイバージェンス・ボンバー)」 をご紹介します。これは、MACDのダイバージェンス(乖離)戦略に基づいた 「オールインワン」型のトレーディングシステム です。 このテクニカルインジケーターの主な目的は、価格とMACDインジケーターの間に発生するダイバージェンスを検出 し、将来の価格の動きを示す
FX Trend NG:次世代マルチマーケット・トレンドインテリジェンス 概要 FX Trend NG は、複数の時間足に対応したプロフェッショナル向けトレンド分析およびマーケット監視ツールです。 市場全体の構造を数秒で把握することができます。 複数のチャートを切り替える必要はありません。どの銘柄がトレンド中なのか、どこでモメンタムが弱まっているのか、そしてどの時間足で強い整合性があるのかを瞬時に確認できます。 ローンチ特別オファー – FX Trend NG を $30(6ヶ月) または $80 永久ライセンス でご利用いただけます。 すでに Stein Investments のユーザーですか? -> メッセージを送信 して、プライベートグループへアクセスしてください。 セットアップや詳細情報が必要ですか? -> Stein Investments 公式ページ をご覧ください。 1. FX Trend NG が他と異なる理由 3ステート・トレンドロジック ― Buy と Sell だけではない • 多くのインジケーターは Buy または Sell の2状態のみを表示します。
このインジケーターを購入すると、プロ仕様のトレードマネージャーを無料で差し上げます。 まず第一に、このトレーディングシステムがノンリペイント、ノンリドロー、ノンラグのインジケーターであることを強調する価値がある。これにより、手動取引とロボット取引の両方に理想的なものになっています。 オンラインコース、マニュアル、プリセットのダウンロード。 「スマートトレンドトレーディングシステム MT5」は、新規および経験豊富なトレーダー向けにカスタマイズされた包括的なトレーディングソリューションです。10以上のプレミアムインジケーターを組み合わせ、7つ以上の堅実なトレーディング戦略を備えており、多様な市場状況に対応する多目的な選択肢となっています。 トレンドフォロー戦略:トレンドを効果的に乗り越えるための正確なエントリーとストップロス管理を提供します。 リバーサル戦略:潜在的なトレンドの反転を特定し、トレーダーがレンジ相場を活用できるようにします。 スキャルピング戦略:高速で正確なデイトレードおよび短期取引のために設計されています。 安定性:すべてのインジケーターはノンリペイント、ノンリドロー、ノ
Meridian Pro
Ottaviano De Cicco
5 (1)
Meridian Pro:MT5用プロフェッショナル・マルチタイムフレーム・トレンドマトリックス 概要 Meridian Pro は Merkava Labs が開発したマルチタイムフレーム・トレンドマトリックスで、方向性の状態、強度、モメンタムの状況、マトリックスの合意をひとつのコンパクトなパネルに集約します。ひとつのアダプティブエンジンがM1からW1まで一貫して適用されます。シンボルごとの調整は不要。インジケーターの積み重ねも不要。すべてのアセットとすべてのタイムフレームをカバーするひとつの構造化された読み取りです。 発売キャンペーン — Meridian Proを USD 99 (導入価格)で入手。通常価格:USD 149 。 1. Meridian Proが他と異なる理由 ひとつのエンジン、バラバラなインジケーターのダッシュボードではない 多くのMTFダッシュボードは、タイムフレームごとに生のインジケーター値を繰り返すだけです。Meridian Proはマトリックス全体でひとつのアダプティブ・トレンドエンジンを使用するため、パネルの各行が同じ構造化フレームワークから導出されます
Quantum TrendPulse を ご紹介します。これは、   SuperTrend   、   RSI   、および Stochastic のパワーを 1 つの包括的なインジケーターに組み合わせて、取引の可能性を最大限に引き出す究極の取引ツールです。精度と効率を求めるトレーダー向けに設計されたこのインジケーターは、市場のトレンド、勢いの変化、最適なエントリー ポイントとエグジット ポイントを自信を持って特定するのに役立ちます。 主な特徴: SuperTrend 統合: 現在の市場動向に簡単に追従し、収益性の波に乗ることができます。 RSI精度: 買われすぎと売られすぎのレベルを検出し、市場の反転のタイミングに最適で、SuperTrendのフィルターとして使用されます。 確率的精度: 確率的振動を活用して、変動の激しい市場で隠れたチャンスを見つけます。SuperTrend のフィルターとして使用されます。 マルチタイムフレーム分析:   M5 から H1 または H4 まで、さまざまなタイムフレームで市場を常に把握します。 カスタマイズ可能なアラート: カスタム取引条件が満たされ
トレンド スクリーナー インジケーターでトレンド取引の力を解き放ちます。ファジー ロジックと複数通貨システムを活用した究極のトレンド取引ソリューションです。 ファジー ロジックを活用した革新的なトレンド インジケーターである Trend Screener を使用して、トレンド取引を向上させます。 これは、13 を超えるプレミアム ツールと機能、および 3 つの取引戦略を組み合わせた強力なトレンド追跡インジケーターであり、Metatrader をトレンド アナライザーにする多用途の選択肢となります。 期間限定オファー : トレンド スクリーナー インジケーターは、わずか 100 ドルで生涯ご利用いただけます。 (元の価格 50$ ) (オファー延長) Trend Screener の 100% 非再描画精度の揺るぎない精度を体験して、取引の決定が過去の価格変動の影響を受けないようにしてください。 マルチタイムフレームおよびマルチ通貨機能の多用途性を解放し、比類のない自信を持って外国為替、商品、暗号通貨、インデックスの世界を取引できるようにします。 Trend Screener の包括的な
Gann Made Easy   は、ミスター・ギャンの理論を使用した取引の最良の原則に基づいた、プロフェッショナルで使いやすい外国為替取引システムです。 W・D・ガン。このインジケーターは、ストップロスとテイクプロフィットレベルを含む正確な買いと売りのシグナルを提供します。 PUSH通知を利用して外出先でも取引可能です。 ご購入後、取引方法の説明と優れた追加インジケーターを無料で入手するには、私にご連絡ください! おそらく、ギャンの取引手法についてはすでに何度も聞いたことがあるでしょう。通常、ギャンの理論は初心者のトレーダーだけでなく、すでにある程度の取引経験がある人にとっても非常に複雑なものです。なぜなら、ギャンの取引手法は理論的にはそれほど簡単に適用できるものではないからです。私はその知識を磨き、最良の原則を私の外国為替インジケーターに組み込むために数年を費やしました。 このインジケーターは非常に簡単に適用できます。必要なのは、それをチャートに添付し、簡単な取引推奨事項に従うだけです。このインジケーターは常に市場分析の仕事を行い、取引の機会を探します。適切なエントリーポイントを検
OmniSync Projection
Antonio-alin Teculescu
5 (1)
Chronos Fractal Engine is an innovative price projection indicator for MetaTrader 5, designed to transform your technical analysis by intelligently identifying and projecting historical price patterns. Built upon an advanced correlation algorithm and the fractal principles of the market, this powerful tool visualizes potential future price movements, giving you a unique edge in your trading decisions. What is Chronos Fractal Engine? At its core, the Chronos Fractal Engine employs a sophisticat
Smart Stop Indicator – チャート上で実現するインテリジェントなストップロス精度 概要 Smart Stop Indicator は、ストップロスを勘や感情ではなく、明確で体系的に設定したいトレーダーのために設計されています。本ツールは、クラシックなプライスアクション(高値更新・安値切り下げ)と最新のブレイクアウト認識ロジックを組み合わせ、次に来るべき論理的なストップレベルを正確に特定します。トレンド相場、レンジ、急速なブレイクアウト局面のいずれであっても、最適な SL ゾーンとその状態(“new”、“broken”、“valid”)をチャート上に直接表示します。さらに今回、SL 距離の %ADR 表示も新たに追加されています。 主な特徴 マーケット構造に基づく自動ストップ配置 • 市場構造とリアルタイムの値動きに基づき、意味のあるストップロスレベルを自動検出します。 スマートなブレイクアウト感知 • 急激な方向転換やブレイクアウトにも柔軟に対応し、早すぎるストップ調整を避けます。 SL %ADR の表示 • ストップロスまでの距離を ADR(Averag
Crystal Heikin Ashi Signals - Professional Trend & Signal Detection Indicator Advanced Heikin Ashi Visualization with Intelligent Signal System for Manual & Automated Trading Final Price: $149 ---------> Price goes up $10 after every 10 sales . Limited slots available — act fast . Overview Crystal Heikin Ashi Signals is a professional-grade MetaTrader 5 indicator that combines pure Heikin Ashi candle visualization with an advanced momentum-shift detection system. Designed for both manual traders
ARICoin is a powerful trading companion designed to generate high-probability entry signals with dynamic TP/SL/DP levels based on volatility. Built-in performance tracking shows win/loss stats, PP1/PP2 hits, and success rates all updated live. Key Features: Buy/Sell signals with adaptive volatility bands Real-time TP/SL/DP levels based on ATR Built-in MA Filter with optional ATR/StdDev volatility Performance stats panel (Success, Profit/Loss, PP1/PP2) Alerts via popup, sound, push, or email Cust
あなたのシンボルでどの戦略が実際に機能するか確認しましょう - リアルマネーをリスクにさらす前に。 Power Barは、あらゆるシンボルとあらゆるタイムフレームで 極端な価格バー を検出し、3つの異なるトレード戦略を即座にバックテストします。勝率、プロフィットファクター、損益を並べて比較できます。すべてが1つのインタラクティブなパネルに集約されています。 推測なし。カーブフィッティングなし。データだけです。 Power Barが特別な理由 ほとんどのインジケーターはシグナルを出すだけで、それが機能するかどうかは推測に任されます。Power Barはさらに先を行きます - すべてのシグナルを 3つの戦略 に対してテストし、統計を表示します。FlipFlop、Momentum、Reversalをワンクリックで切り替え、数値が即座に変化するのを確認できます。 FlipFlop - 常にポジションを保有。シグナルでエントリーし、反対シグナルでイグジット。当社のリサーチでは、US30、US500、DAXなどのトレンドのあるインデックスで最も効果的です。 Momentum - シグナルの方向に
BTMM State Engine Pro is a MetaTrader 5 indicator for traders who use the Beat The Market Maker approach: Asian session context, kill zone timing, level progression, peak formation detection, and a multi-pair scanner from a single chart. It combines cycle state logic with a built-in scanner dashboard so you do not need the same tool on many charts at once. What it does Draws the Asian session range; session times can follow broker server offset or be set in inputs. Tracks level progression (L
FX Power: 通貨の強弱を分析して、より賢い取引を実現 概要 FX Power は主要通貨と金の実際の強弱をあらゆる市場状況で理解するための必須ツールです。強い通貨を買い、弱い通貨を売ることで、 FX Power は取引の意思決定を簡素化し、高い確率の取引機会を見出します。トレンドを追従する場合でも、極端なデルタ値を使用して反転を予測する場合でも、このツールはあなたの取引スタイルに完全に適応します。ただ取引するだけではなく、 FX Power で賢く取引をしましょう。 1. なぜ FX Power がトレーダーにとって非常に有益なのか 通貨と金のリアルタイム強弱分析 • FX Power は主要通貨と金の相対的な強弱を計算し、マーケットダイナミクスに関する明確な洞察を提供します。 • どの資産がリードしているか、または後れを取っているかを監視して、取引するペアを賢く選びましょう。 マルチタイムフレームの包括的なビュー • 短期、中期、長期のタイムフレームで通貨と金の強弱を追跡し、マーケットトレンドに基づいて取引戦略を調整できます。 • スキャルピングからスイングトレード
まず第一に、この取引ツールはノンリペイント、ノンリドロー、ノンラグの指標であり、プロの取引に理想的ですことを強調する価値があります。 オンラインコース、ユーザーマニュアル、デモ。 スマートプライスアクションコンセプトインジケーターは、新米から経験豊富なトレーダーまで、非常 に強力なツールです。Inner Circle Trader AnalysisやSmart Money Concepts Trading Strategiesなど、20以上の有用な指標を1つに組み合わせています。このインジケーターはスマートマネーコンセプトに焦点を当て、大手機関の取引方法を提供し、彼らの動きを予測するのに役立ちます。 特に、流動性分析に優れており、機関がどのように取引しているかを理解しやすくしています。市場のトレンドを予測し、価格の動きを慎重に分析するのに優れています。機関の戦略とトレードを合わせることで、市場の動向についてより正確な予測ができます。このインジケーターは多目的であり、市場構造を分析し、重要な注文ブロックを特定し、さまざまなパターンを認識するのに優れています。 このインジケーター
ご紹介     Quantum Breakout PRO は 、ブレイクアウト ゾーンの取引方法を変革する画期的な MQL5 インジケーターです。 13年以上の取引経験を持つ経験豊富なトレーダーのチームによって開発されました。     クォンタム ブレイクアウト プロ   は、革新的でダイナミックなブレイクアウト ゾーン戦略により、あなたのトレーディングの旅を新たな高みに押し上げるように設計されています。 クォンタム ブレイクアウト インジケーターは、5 つの利益ターゲット ゾーンを備えたブレイクアウト ゾーン上のシグナル矢印と、ブレイクアウト ボックスに基づいたストップロスの提案を提供します。 初心者トレーダーにもプロのトレーダーにも適しています。 量子EAチャネル:       ここをクリック 重要!購入後、インストールマニュアルを受け取るためにプライベートメッセージを送ってください。 推奨事項: 時間枠: M15 通貨ペア: GBPJPY、EURJPY、USDJPY、NZDUSD、XAUUSD アカウントの種類: ECN、Raw、またはスプレッドが非常に低い R
優れたテクニカルインジケーター「Grabber」をご紹介します。これは、すぐに使える「オールインワン」トレーディング戦略として機能します。 ひとつのコードに、市場のテクニカル分析ツール、取引シグナル(矢印)、アラート機能、プッシュ通知が強力に統合されています。 このインジケーターを購入された方には、以下の特典を無料で提供します: Grabberユーティリティ:オープンポジションを自動で管理するツール ステップバイステップのビデオマニュアル:インジケーターのインストール、設定、取引方法を解説 カスタムセットファイル:インジケーターをすばやく自動設定し、最大限の成果を出すための設定ファイル 他の戦略はもう忘れてください!Grabberだけが、あなたを新たなトレードの高みへと導いてくれるのです。 Grabber戦略の主な特徴: 推奨タイムフレーム:M5〜H4 対応通貨ペア・資産:どれでも使用可能ですが、私が実際に検証した以下を推奨します(GBPUSD、GBPCAD、GBPCHF、AUDCAD、AUDUSD、AUDSGD、AUDCHF、NZDUSD、NZDCAD、EURCAD、EURUSD、E
Bill Williams Advanced is designed for automatic chart analysis using Bill Williams' "Profitunity" system. The indicator analyzes four timeframes at once. Manual (Be sure to read before purchasing) Advantages 1. Analyzes the chart using Bill Williams' "Profitunity" system. Signals are displayed in a table in the corner of the screen and on the price chart. 2. Finds all known AO and AC signals, as well as zone signals. Equipped with a trend filter based on the Alligator. 3. Finds "Divergence Bar
Market Structure Order Block Dashboard MT5 は、 MT5(MetaTrader 5)用インジケーター です。 市場構造 と ICT / Smart Money Concepts に基づき、 HH/HL/LH/LL 、 BOS 、 ChoCH に加えて、 Order Blocks 、 Fair Value Gaps (FVG) 、 流動性 (EQH/EQL、sweeps)、 セッション / Kill Zones 、 Volume Profile を表示し、コンパクトなコンフルエンス・ダッシュボードを提供します。 重要: これは 分析ツール です。自動売買は行いません(EAではありません)。 購入者特典(ボーナス) 購入後、私のストアから 2つのボーナスインジケーター を(選択して)受け取ることができます。 ボーナスの受け取り方法: 1) 本商品のページに正直なレビューを投稿してください。 2) MQL5のメッセージで、 BONUS MSOB + 選んだ 2つのインジケーター名 を送ってください。 主な機能 市場構造: HH/HL/LH/LL
まず第一に、この取引インジケーターは再描画されず、再描画されず、遅延しないことを強調する価値があります。これにより、手動取引とロボット取引の両方に理想的なものになります。 ユーザーマニュアル:設定、入力、戦略。 アトミックアナリストは、価格の強さとモメンタムを利用して市場でより良いエッジを見つけるためのPA価格アクションインジケーターです。ノイズや誤ったシグナルを除去し、取引ポテンシャルを高めるための高度なフィルターを備えています。複雑なインジケーターの複数のレイヤーを使用して、アトミックアナリストはチャートをスキャンし、複雑な数学的計算をシンプルなシグナルと色に変換します。これにより、どのような初心者トレーダーでも理解して使用し、一貫した取引の決定を行うことができます。 「アトミックアナリスト」は、新規および経験豊富なトレーダー向けにカスタマイズされた包括的な取引ソリューションです。プレミアムインジケーターとトップノッチの機能を1つの取引戦略に組み合わせ、すべてのタイプのトレーダーにとって汎用性のある選択肢にします。 デイリートレーディングとスキャルピング戦略:高速で正確なデイ
RelicusRoad Pro: 定量的市場オペレーティングシステム 【期間限定】無制限アクセス 70% OFF - 2,000人超のトレーダーと共に なぜ多くのトレーダーは「完璧な」インジケーターを使っても失敗するのでしょうか? それは、文脈を無視して 単一の概念 だけでトレードしているからです。文脈のないシグナルは単なるギャンブルです。勝ち続けるには、 根拠の重なり(コンフルエンス) が必要です。 RelicusRoad Proは単なる矢印インジケーターではありません。完全な 定量的市場エコシステム です。独自のボラティリティモデリングを用いて、価格が推移する「適正価値の道(Fair Value Road)」をマッピングし、ノイズと真の構造的ブレイクを判別します。 推測はやめましょう。機関投資家レベルの「ロード・ロジック」でトレードを。 コアエンジン:「Road」アルゴリズム システムの中心となる Road Algo は、市場環境にリアルタイムで適応するダイナミックなボラティリティチャネルです。 安全ライン(平衡点) と、価格が数学的に反転しやすい 拡張レベル を投影します。 Si
Berma Bands
Muhammad Elbermawi
5 (8)
Berma Bands (BBs) インジケーターは、市場のトレンドを特定して活用したいトレーダーにとって貴重なツールです。価格と BBs の関係を分析することで、トレーダーは市場がトレンド段階にあるか、レンジ段階にあるかを判断できます。 詳細については、[ Berma Home Blog ] をご覧ください。 バーマ バンドは、上部バーマ バンド、中部バーマ バンド、下部バーマ バンドの 3 つの異なる線で構成されています。これらの線は価格の周りにプロットされ、全体的な傾向に対する価格の動きを視覚的に表します。これらのバンド間の距離から、ボラティリティや潜在的な傾向の反転についての洞察を得ることができます。 バーマ バンドの線がそれぞれ離れると、市場が横ばいまたはレンジ相場の期間に入っていることを示すことがよくあります。これは、明確な方向性の偏りがないことを示しています。トレーダーは、これらの期間中にトレンドを特定するのが難しいと感じる可能性があり、より明確なトレンドが出現するまで待つ場合があります。 バーマ バンドの線が 1 本の線に収束すると、強いトレンド環境の兆候となること
ARIPoint is a powerful trading companion designed to generate high-probability entry signals with dynamic TP/SL/DP levels based on volatility. Built-in performance tracking shows win/loss stats, PP1/PP2 hits, and success rates all updated live. Key Features: Buy/Sell signals with adaptive volatility bands Real-time TP/SL/DP levels based on ATR Built-in MA Filter with optional ATR/StdDev volatility Performance stats panel (Success, Profit/Loss, PP1/PP2) Alerts via popup, sound, push, or email Cu
Auto Optimized Parabolic RSI: 高度な3Dモメンタムエンジン ほとんどのリテール向けインジケーターは、市場のボラティリティが変化した瞬間に破綻する静的な入力値に依存しているため、失敗に終わります。Auto Optimized Parabolic RSIは、自らの数学的優位性を継続的に再計算することで「インジケーターの陳腐化」問題を解決し、機関投資家レベルの定量的適応力をMT5ターミナルに直接もたらします。 最大の強み: カスタムインメモリ3D最適化 標準的な自動最適化ツールは、インジケーターの呼び出しで端末に過負荷をかけるため、頻繁にMT5プラットフォームをフリーズさせます。本ツールは、このボトルネックを完全に回避しています。RAMベースのカスタムネイティブ計算機を内蔵した内部エンジンは、チャートを読み込んだりタイムフレームを変更したりするたびに、超高速の3Dグリッド探索を実行します。RSI期間(頻度)、SARステップ(加速度)、SAR最大値(制限速度)を同時にスイープし、プラットフォームを遅延させることなく、数万通りものパラメーターの組み合わせを絶対的なミ
ICT PO3 (Power of 3) AMD Protocol Framework Indicator True Time & Structure Integration   |  Non-Repainting | Real-Time  | Multi-Asset  | MT4 Version Available Full Setup Guide & Strategy Playbook: https://www.mql5.com/en/blogs/post/768683 MT4 Version: https://www.mql5.com/en/market/product/171742 Indicator Overview The ICT PO3 AMD Protocol Framework is a complete structural overlay for MetaTrader 5 that maps the True Daily Cycle directly onto your lower-timeframe execution chart. It projects
Trend Ai indicatorは、トレンドの識別と実用的なエントリポイントと反転アラートを組み合わせることで、トレーダーの市場分析を強化する優れたツールです。 この指標は、ユーザーが自信と正確さで外国為替市場の複雑さをナビゲートすることを可能にします トレンドAiインジケーターは、主要なシグナル以外にも、プルバックやリトレースメント中に発生するセカンダリエントリポイントを識別し、トレーダーが確立されたトレンド内の価格修正を活用できるようにします。 重要な利点: *MT4およびMT5の仕事 *明確な買いまたは売りシグナル *再描画しません ·すべての資産で動作します 私はeaやセットをtelegram it詐欺で販売しないように注意してください。 すべての設定はここでブログで無料です。  重要! 指示とボーナスを得るために購入後すぐに私に連絡してください! 私の他のプロダクトと同様、実質操作の監視はここに見つけることができます: https://www.mql5.com/en/users/mechanic/seller&nbsp ; 設定および入力: すべての
作者のその他のプロダクト
Unda
Pavel Gotkevitch
The Unda indicator determines the trend direction and strength, as well as signals about trend changes. The indicator uses price extremums for the previous periods and calculates the ratio between the current price and extremums. Therefore, the only parameter is Period (default = 13), which sets the number of bars to determine extremums. The higher the Period, the less the number of signals about trend changes, but the greater the indicator delay. Uptrends are shown by blue color of the indicato
DeMarker Mod
Pavel Gotkevitch
4 (2)
В стандартном индикаторе DeMarker используется простая скользящая средняя - Simple Moving Average, что несколько ограничивает возможности этого индикатора. В представленном индикаторе DeMarker Mod добавлен выбор из четырех скользящих средних - Simple, Exponential, Smoothed, Linear weighted, что позволяет существенно расширить возможности данного индикатора.   Параметры стандартного индикатора DeMarker: ·         period  - количество баров, используемых для расчета индикатора;   Параметры индикат
FREE
MAPC
Pavel Gotkevitch
3 (1)
MAPC (Moving Average Percent's Change) shows the Moving Average's percent change from one period to another selected period allowing you to track the smoothed price change rate. MAPC is calculated according to the following equation: MAPC[i] = 100 * (MA[i] - MA[i - n]) / MA[i],  where: MA[i] - current Moving Average value;   MA[i - n] - value of the Moving Average that is n periods away from the current Moving Average value. Input Parameters Period - Moving Average period; Method - smoothing me
FREE
Only Exponential Moving Average at Close Price is used in standard Bears Power limiting the possibilities of that indicator to some extent. Bears Power Mod enables you to select from four Moving Averages and seven applied prices, thus greatly expanding the indicator's functionality.
FREE
Only Exponential Moving Average at Close Price is used in standard Bulls Power limiting the possibilities of that indicator to some extent. Bulls Power Mod enables you to select from four Moving Averages and seven applied prices, thus greatly expanding the indicator's functionality.
FREE
Support & Resistance indicator is a modification of the standard Bill Williams' Fractals indicator. The indicator works on any timeframes. It displays support and resistance levels on the chart and allows setting stop loss and take profit levels (you can check the exact value by putting the mouse cursor over the level). Blue dashed lines are support level. Red dashed lines are resistance levels. If you want, you can change the style and color of these lines. If the price approaches a support lev
MA Crossing displays two moving averages on the chart painting their crossing points in different colors - blue (buy) and red (sell). The indicator clearly defines the trend direction and power and simplifies the perception of market signals. The indicator may be useful in the strategies involving two moving averages' crossing method. The indicator's input parameters allow you to select the following settings for each moving average: period (Fast Period, Slow Period); smoothing period (Simple, E
Vates
Pavel Gotkevitch
4.2 (5)
Vates is a Latin word meaning a prophet. Vates is a multicurrency trend Expert Advisor that can run on any type real accounts, on any timeframe, with any initial deposit, with a fixed or varying lot size, with four and five-digit quotes, with brokers offering different order filling types. A distinctive feature of the EA is its stability and reliability. The results of Expert Advisor testing in the Strategy Tester in four modes (two main modes – normal and with a delay, and two additional modes
Grab
Pavel Gotkevitch
The Grab indicator combines the features of both trend indicators and oscillators. This indicator is a convenient tool for detecting short-term market cycles and identifying overbought and oversold levels. A long position can be opened when the indicator starts leaving the oversold area and breaks the zero level from below. A short position can be opened when the indicator starts leaving the overbought area and breaks the zero level from above. An opposite signal of the indicator can be used for
The standard Commodity Channel Index (CCI) indicator uses a Simple Moving Average, which somewhat limits capabilities of this indicator. The presented CCI Modified indicator features a selection of four moving averages - Simple, Exponential, Smoothed, Linear weighted, which allows to significantly extend the capabilities of this indicator. Parameter of the standard Commodity Channel Index (CCI) indicator period - the number of bars used for the indicator calculations; apply to - selection from
D-Channel is a technical indicator defining the current Forex market status - trend or flat. The indicator is based on DEMA (Double Exponential Moving Average). The advantage of DEMA is that it eliminates false signals at the saw-toothed price movement and allows saving a position at a strong trend. The indicator can work on any timeframe, though H1 and higher timeframes are recommended to minimize false signals. The indicator displays a channel as lines located above and below the average line.
Stips is a histogram indicator that determines trend direction and strength, as well as trend changes. The indicator can be used as a normal oscillator, i.e. analyze its trend change signals (crossing the zero line), as well as divergence and exit from overbought and oversold zones. The indicator uses extreme prices of previous periods and calculates the ratio between the current price and extreme values. Therefore its only parameter is Period (default is 13), which sets the number of bars to de
F-Channel is a technical indicator defining the current Forex market status - trend or flat. The indicator is based on FRAMA (Fractal Adaptive Moving Average). The FRAMA follows strong trend movements and slows down significantly during price consolidation. The indicator is able to work on any timeframes, but H1 and higher timeframes are recommended to minimize false signals. The indicator displays a channel as lines located above and below the middle line. The upper and lower lines can serve as
Labor is a technical analysis indicator defining trend direction and power, as well as signaling a trend change. The indicator is based on a modified EMA (Exponential Moving Average) with an additional smoothing filter. The indicator works on any timeframe. The uptrend is shown as a blue line, while a downtrend - as a red one. Close a short position and open a long one if the line color changes from red to blue. Close a long position and open a short one if the line color changes from blue to re
P-Channel is a technical indicator determining the current Forex market status - trend or flat. The indicator is able to work on any timeframes, but H1 and higher timeframes are recommended to minimize false signals. The indicator displays a channel as lines located above and below the middle line. The upper and lower lines can serve as the resistance and support levels. Sell when the price reaches the upper line, and buy when the price reaches the lower line. It is recommended to use a small st
The FRAMA Crossing indicator displays on a chart two FRAMAs (Fractal Adaptive Moving Average) and paints their crossing areas in different colors – blue (buy) and red (sell). FRAMA follows strong trend movements and slows down significantly during price consolidation. The indicator clearly defines the trend direction and power and simplifies the perception of market signals. The indicator can work on any timeframes may be useful in the strategies involving two moving averages' crossing method. T
The CCI Crossing indicator displays the intersection of two CCI (Commodity Channel Index) indicators - fast and slow - in a separate window. The intersection area is filled in blue, when the fast CCI is above the slow CCI. The intersection area is filled in red, when the fast CCI is below the slow CCI. This indicator is a convenient tool for measuring the deviations of the current price from the statistically average price and identifying overbought and oversold levels. The indicator can work on
Dash
Pavel Gotkevitch
Dash is a histogram indicator, which measures the rate of price change and determines the overbought and oversold levels. The indicator uses price extremums for the previous periods and calculates the ratio between the current price and extremums. Therefore, the only parameter is Period , which sets the number of bars to determine extremums. A long position can be opened when the red lines of the indicator start leaving the oversold area and break the -1 level upwards. A short position can be op
The Surge indicator combines the features of trend indicators and oscillators. The indicator measures the rate of price change and determines the overbought and oversold market levels. The indicator can be used on all timeframes and is a convenient tool for detecting short-term market cycles. The indicator uses price extremums for the previous periods and calculates the ratio between the current price and extremums. Therefore, the only parameter is Period, which sets the number of bars to determ
The DEMA Crossing indicator displays the intersection of two DEMA (Double Exponential Moving Average) - fast and slow. The intersection area is filled in blue, when the fast DEMA is above the slow DEMA. The intersection area is filled in red, when the fast DEMA is below the slow DEMA. The advantage of the DEMA moving average is that it eliminates false signals at the saw-toothed price movement and allows saving a position at a strong trend. The indicator clearly defines the trend direction and p
The Trend Sight indicator shows the Moving Average's percent change from the current bar to the other selected bar allowing you to track the smoothed price change rate, as well as trend strength and change. The uptrend is shown as a blue indicator line, while a downtrend is displayed in red. Close a short position and open a long one if the line color changes from red to blue. Close a long position and open a short one if the line color changes from blue to red. You should use a tight stop loss,
The Trend Sign indicator is a modification of the MACD indicator (Moving Average Convergence Divergence), which allows determining the direction and strength of the trend, as well as a trend change. The indicator is based on two moving averages - fast and slow, and it can work on any timeframe. Uptrends are shown by blue color of the indicator line, downtrends by the red color. Close a short position and open a long one if the line color changes from red to blue. Close a long position and open a
The DEMA Trend indicator is based on two DEMA (Double Exponential Moving Average) - fast and slow. The advantage of the DEMA moving average is that it eliminates false signals at the saw-toothed price movement and allows saving a position at a strong trend. The indicator allows determining the direction and strength of the trend, and it can work on any timeframe. Uptrends are shown by blue color of the indicator line, downtrends by the red color. Close a short position and open a long one if the
T-Channel is a technical indicator defining the current Forex market status - trend or flat. The indicator is based on TEMA (Triple Exponential Moving Average). The advantage of the TEMA is that it provides a smaller delay than a moving average with a single or double smoothing. The indicator is able to work on any timeframes, but H1 and higher timeframes are recommended to minimize false signals. The indicator displays a channel as lines located above and below the middle line. The upper and lo
The TEMA Trend indicator is based on two TEMA (Triple Exponential Moving Average) - fast and slow. The advantage of the TEMA is that it provides a smaller delay than a moving average with a single or double smoothing. The indicator allows determining the direction and strength of the trend, and it can work on any timeframe. Uptrends are shown by blue color of the indicator line, downtrends by the red color. Close a short position and open a long one if the line color changes from red to blue. Cl
The Trend Detect indicator combines the features of both trend indicators and oscillators. This indicator is a convenient tool for detecting short-term market cycles and identifying overbought and oversold levels. A long position can be opened when the indicator starts leaving the oversold area and breaks the zero level from below. A short position can be opened when the indicator starts leaving the overbought area and breaks the zero level from above. An opposite signal of the indicator can b
The Trade Helper indicator is a modification of the Trade Assistant indicator (by Andriy Moraru). The Trade Helper multitimeframe indicator is a good assistant for traders, useful as a filter in most trading strategies. This indicator combines the tactics of Elder's Triple Screen in a single chart, which lies in entering a trade when the same trend is present on three adjacent timeframes. The indicator operation is based on the principle of determining the trend on the three selected timeframes
Lotus indicator combines the features of both trend indicators and oscillators allowing you to track the smoothed price change rate, as well as trend strength and change. The uptrend is shown as a green indicator line, while a downtrend is displayed in red. A long position can be opened when the indicator breaks the zero level from below. A short position can be opened when the indicator breaks the zero level from above. An opposite signal of the indicator can be used for exiting positions. You
DEMA Cross DEMA Cross - это мультивалютный трендовый советник, работающий на реальных счетах любого типа, на любом временном интервале, с любым начальным депозитом, с постоянным или изменяющимся размером лота, с четырех- и с пятизначными котировками, а также с брокерами, использующими различный тип заливки ордеров. Отличительной особенностью советника является его стабильность и, что особенно важно, его достоверность. Результаты проверки советника в тестере стратегий в 4-х режимах (2 основных
フィルタ:
Noprofit
313
Noprofit 2020.05.24 15:33 
 

ユーザーは評価に対して何もコメントを残しませんでした

削除済み 2019.11.02 18:35 
 

ユーザーは評価に対して何もコメントを残しませんでした

削除済み 2019.01.14 06:47 
 

ユーザーは評価に対して何もコメントを残しませんでした

Gennadiy Voltornist
11909
Gennadiy Voltornist 2017.12.14 20:45 
 

ユーザーは評価に対して何もコメントを残しませんでした

Daniel Andrejczuk
5597
Daniel Andrejczuk 2017.11.09 03:06 
 

ユーザーは評価に対して何もコメントを残しませんでした

Nork
6187
Nork 2016.12.21 07:25 
 

ユーザーは評価に対して何もコメントを残しませんでした

レビューに返信