T Channel
- Indicadores
- Versión: 1.1
- Actualizado: 25 marzo 2022
- Activaciones: 5

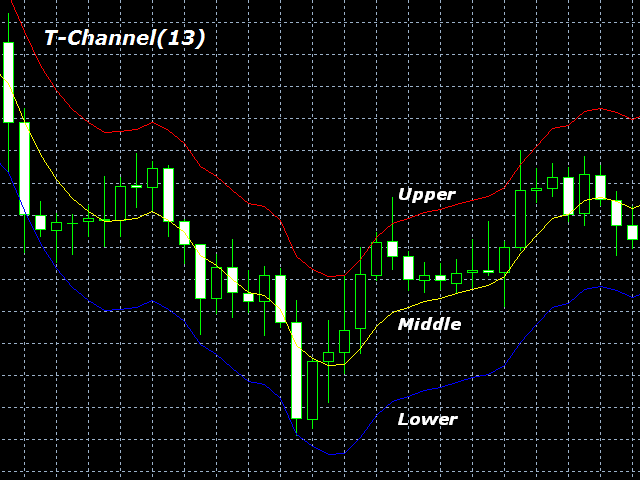
T-Channel es un indicador técnico que define el estado actual del mercado Forex - tendencia o plano.
El indicador se basa en la TEMA (media móvil exponencial triple). La ventaja de la TEMA es que proporciona un retraso menor que una media móvil con un suavizado simple o doble.
El indicador puede funcionar en cualquier marco temporal, pero se recomienda H1 y marcos temporales superiores para minimizar las señales falsas.
El indicador muestra un canal como líneas situadas por encima y por debajo de la línea media. Las líneas superior e inferior pueden servir como niveles de resistencia y soporte.
Venda cuando el precio alcance la línea superior y compre cuando el precio alcance la línea inferior.
Se recomienda utilizar un stop loss pequeño para protegerse de señales falsas.
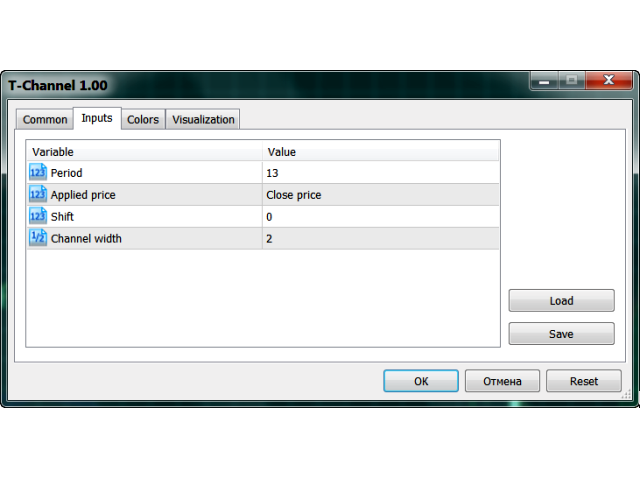
La pestaña Entradas del indicador permite seleccionar:
- el periodo del indicador;
- uno de los siete tipos de precio aplicados (Cierre, Apertura, Máximo, Mínimo, Mediano, Típico, Ponderado);
- desplazamiento horizontal de todas las líneas del gráfico
- desplazamiento vertical de las líneas superior e inferior con respecto a la línea central.
La pestaña Colores permite elegir el color, la anchura y el estilo de línea del indicador.
Parámetros
- período - número de barras utilizadas para los cálculos del indicador;
- precio aplicado - seleccione entre los siete tipos de precios aplicados;
- desplazamiento - desplazamiento horizontal de todas las líneas del gráfico;
- ancho del canal - desplazamiento vertical de las líneas superior e inferior.
El indicador T-Channel se calcula mediante las siguientes fórmulas:
- Nivel superior = TEMA(N,P) + High(t)*CW/1000
- Nivel inferior = TEMA(N,P) - Low(t)*CW/1000,
donde:
- Nivel Superior - la línea superior del canal;
- Nivel inferior: línea inferior del canal;
- TEMA - Media móvil exponencial triple;
- N - período de promediación;
- P - precio aplicado (Cierre, Apertura, Máximo, Mínimo, Mediano, Típico, Ponderado);
- High(t) y Low(t) - precios máximo y mínimo del periodo actual;
- CW - anchura del canal (desplazamiento vertical de las líneas superior e inferior respecto a la línea media).


El usuario no ha dejado ningún comentario para su valoración