Abiroid ChronoVolume
- Indicadores
- Abir Pathak
- Versión: 1.2
- Activaciones: 20
ChronoVolume Detailed Blog post with screenshots:
https://www.mql5.com/en/blogs/post/763650
It is an advanced volume analysis indicator.
Overview:
ChronoVolume analyzes volume data in MetaTrader 4 by converting basic tick volume into meaningful trading insights.
Since MT4 only provides tick volume (number of price changes), this indicator uses algorithms to estimate buying and selling pressure, giving you a clearer picture of market sentiment.
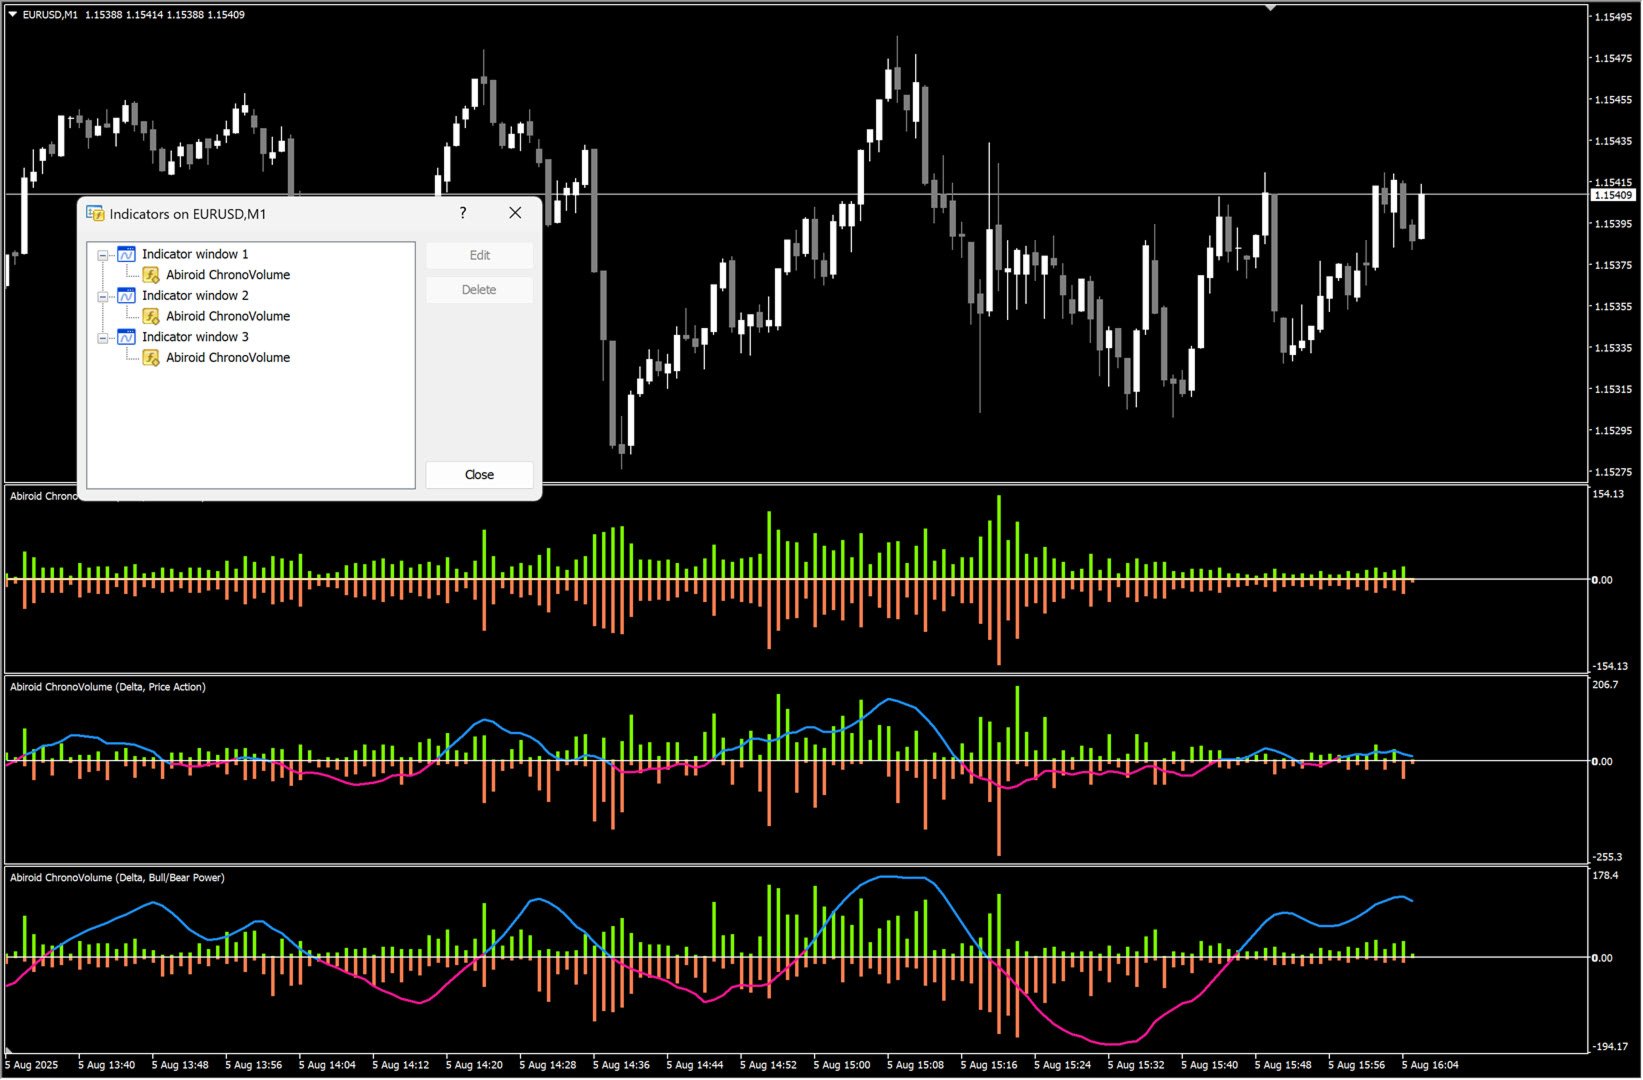
The indicator offers three ways to calculate volume and three ways to display it, allowing you to analyze the same market data from different perspectives.
Volume Calculation Methods
1. Price Action Volume Type
Analyzes where the closing price falls within each bar's range to estimate buying vs selling pressure.
How it works:
If high => More buying pressure
If close is near the low => More selling pressure
If close is in the middle => Balanced activity
Buy Volume = Total Volume × (Close - Low) / (High - Low)
Sell Volume = Total Volume × (High - Close) / (High - Low)
Best for: Traditional breakout analysis, trend confirmation, divergence spotting
2. Bull/Bear Power Volume Type
Uses deviation from a 13-period moving average to measure institutional buying and selling strength.
How it works:
EMA13 = 13-period moving average of closing prices
Bull Power = High - EMA13 (how far high extends above average)
Bear Power = Low - EMA13 (how far low extends below average)
Distribution based on absolute values of Bull Power vs Bear Power
Best for: Momentum analysis, institutional flow detection, EMA-based strategies
3. Tick Volume Type
Enhanced processing of raw tick volume without directional bias.
How it works:
Pure tick volume with advanced smoothing and scaling
No assumptions about buying vs selling
Best for: Overall market participation, volume spikes, neutral analysis
Display Modes:
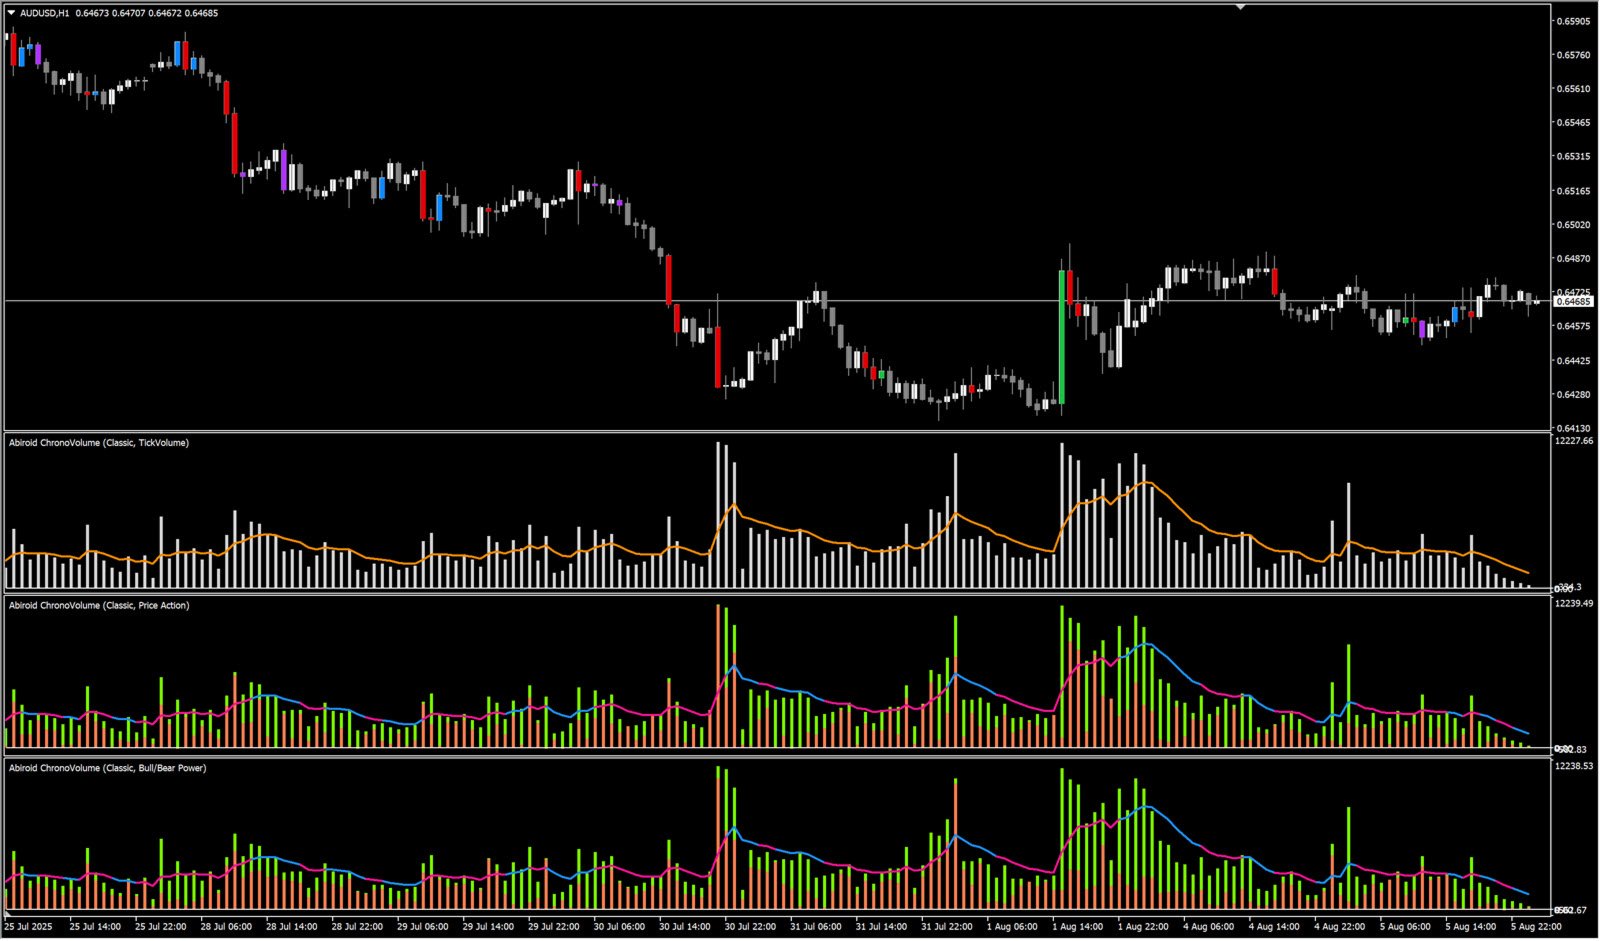
a) Classic Mode
Shows volume relative to recent averages, perfect for identifying unusual activity.
What you see:
Histogram bars showing current volume compared to average
Optional smooth line for trend identification
Color coding based on your selected volume calculation method
Calculations:
- Calculate relative volume: Current Volume/Average of last 6 bars
- Apply smoothing: Spotting volume spikes, confirming breakouts, identifying divergences
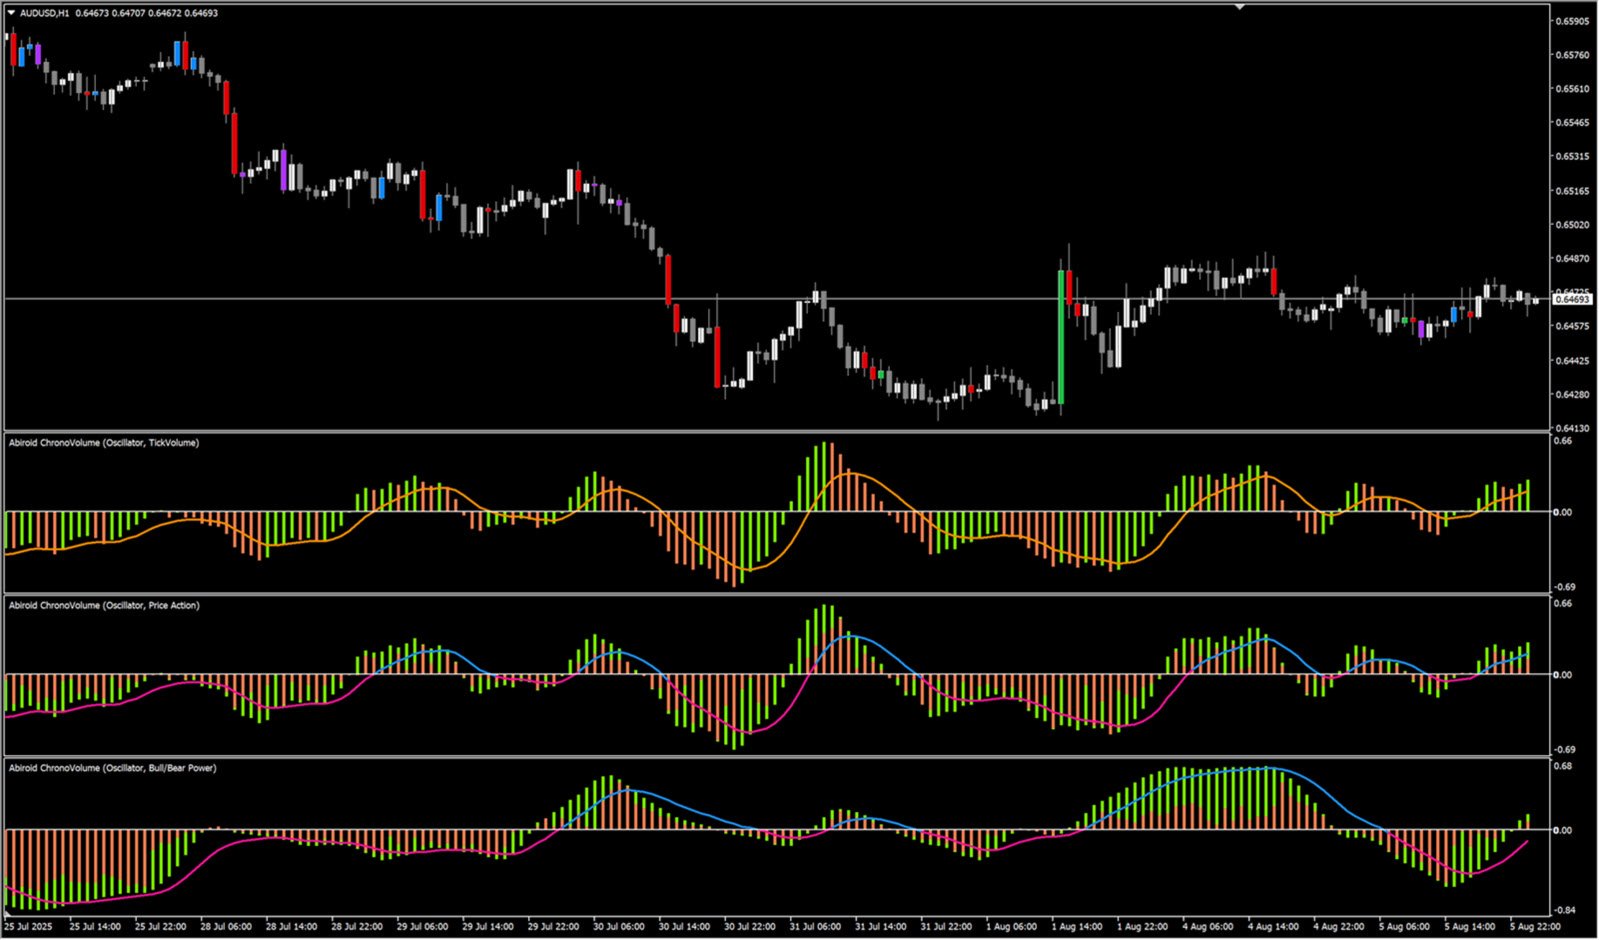
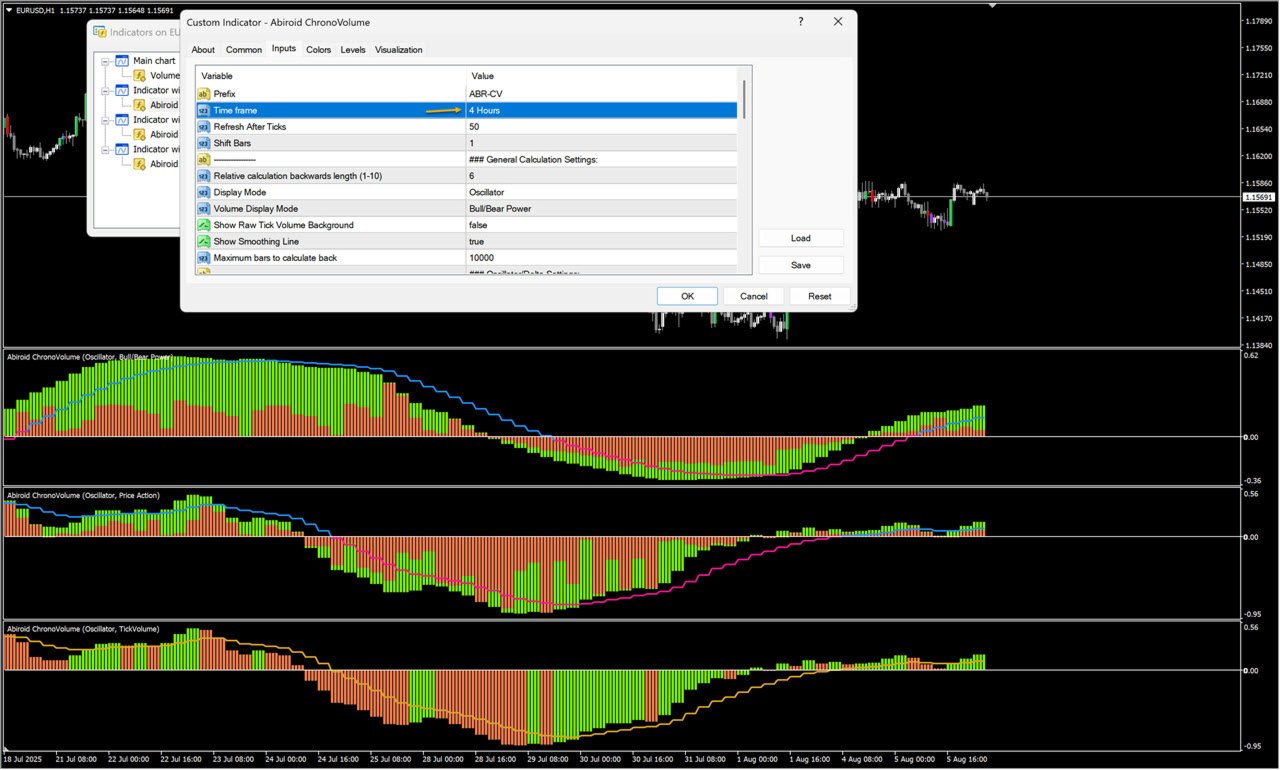
b) Oscillator Mode
Transforms volume into momentum format, oscillating around zero to show directional pressure.
What you see:
Values above zero = Net buying pressure
Values below zero = Net selling pressure
Optional smooth line showing momentum direction
Calculations:
- Calculate buying vs selling difference
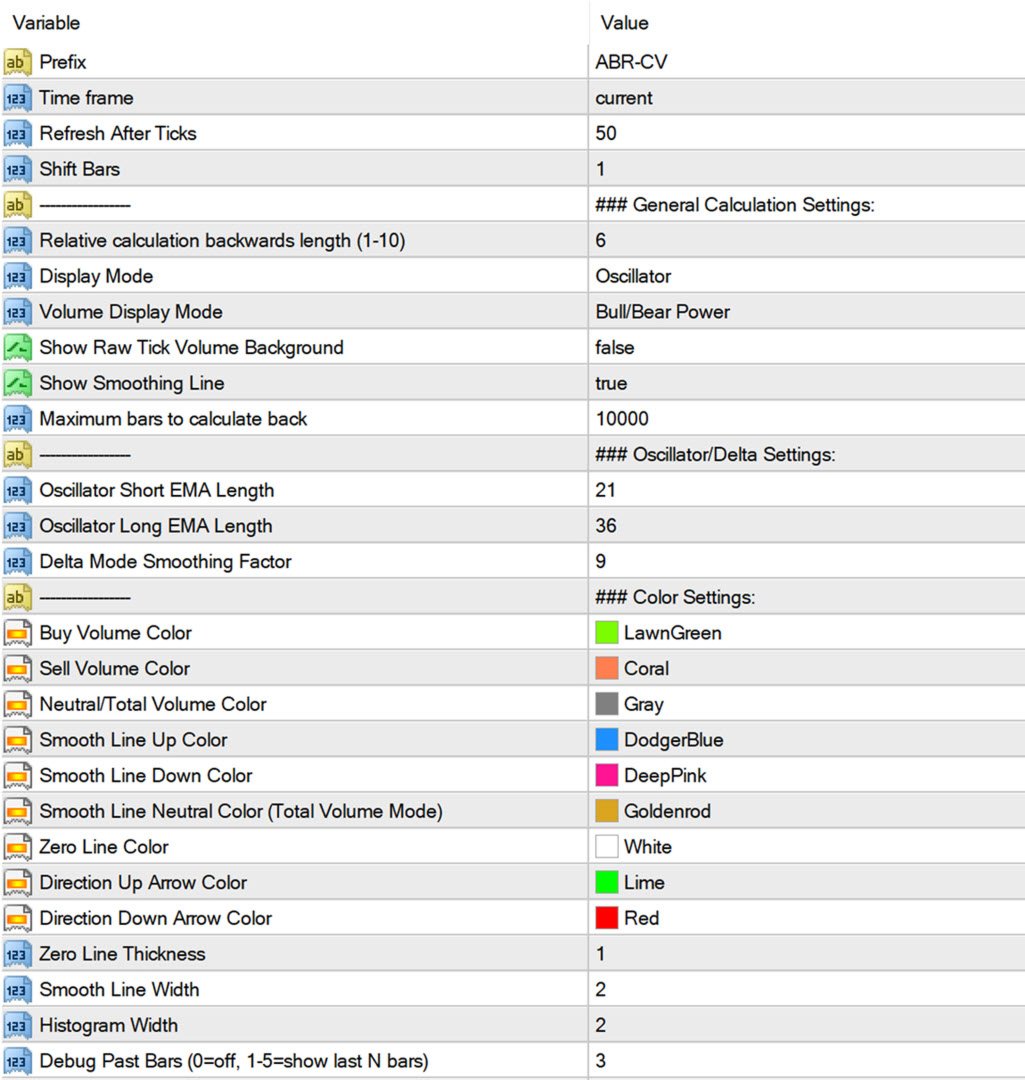
- Apply two EMAs (21 and 36 periods) to smooth the data
- Take difference between fast and slow EMA4. Normalize using sigmoid function for bounded oscillator
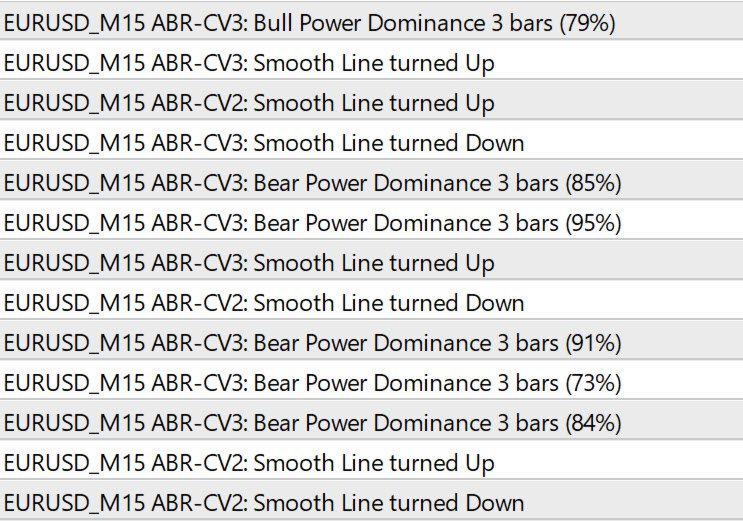
Use for: Momentum shifts, overbought/oversold conditions, zero-line crosses
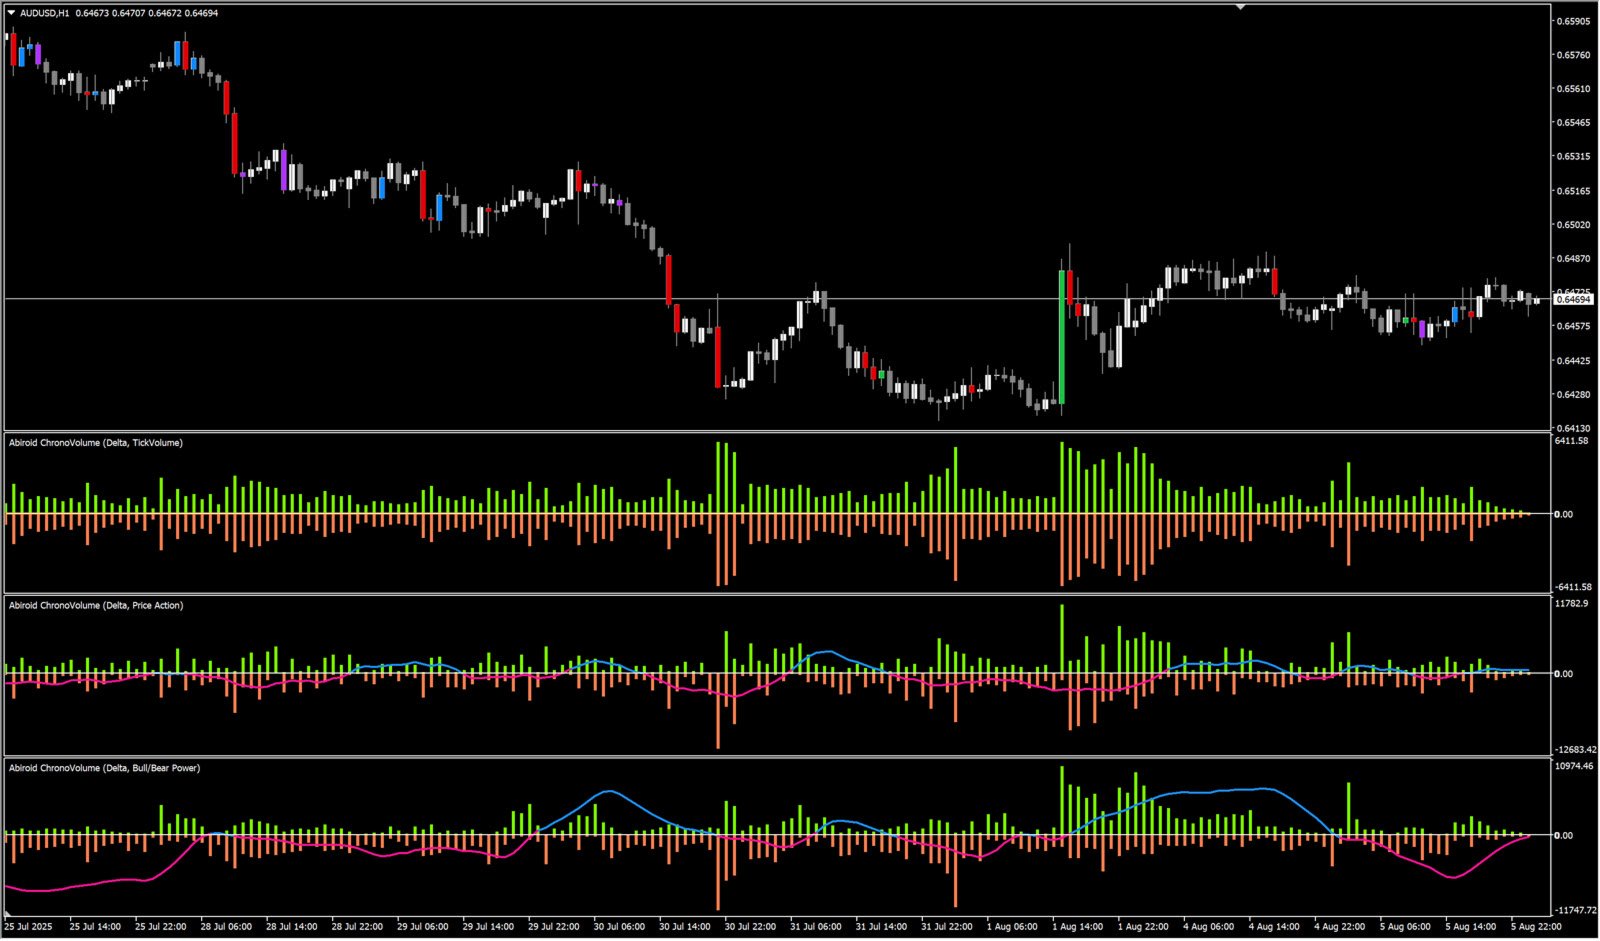
c) Delta Mode
Shows net buying vs selling pressure, revealing institutional order flow.
What you see:
Positive bars = Buying dominanceNegative bars = Selling dominanceMagnitude shows strength of net flowMathematical process:
- Start with buying vs selling difference
- Scale by volume context (× 200-period average × 20)
- Apply EMAs (21 and 36 periods) to scaled values
- Smooth the difference with adjustable smoothing factor
Use for: Institutional flow analysis, early reversal detection, net pressure assessment
Why Oscillator Mode Needs to Recalculate Past Bars:
The oscillator mode uses a chain of three Exponential Moving Averages (EMAs) - a 21-period EMA, a 36-period EMA, and a final 9-period EMA of their difference.
Each EMA calculation depends on the previous bar's EMA value.
Smoothing Effects: Unlike simple moving averages that only look at a fixed window of data, EMAs give exponentially decreasing weight to older values and more weight to newer values.
Calculation Order Sensitivity: The oscillator's final value comes from normalizing the difference between the short and long EMAs using a 200-period Simple Moving Average (SMA) of absolute differences.
This creates a feedback loop where:
- New price data affects the buy/sell momentum calculation
- This changes the EMA values for recent bars
- The EMA changes affect the normalization factor (boundSMA)
- The new normalization factor recalculates oscillator values for past bars
Practical Impact: While this recalculation is mathematically correct and provides smoother, more responsive signals, it means that oscillator values for the last 50-200 bars may shift slightly when new data arrives.
For most trading applications, this smoothing benefit outweighs the historical value adjustments.
Because new data is more essential for current trades. If you want absolutely non-repainting volume bars, then don't use the oscillator mode.
Remember: Volume analysis works best when combined with price action and other technical analysis methods.
Use ChronoVolume to confirm your trading ideas rather than as a standalone signal generator.
Read about how Oscillators are actually useful in the blogpost mentioned above.