ChronoVolume Available here:
https://www.mql5.com/en/market/product/146081
It is an advanced volume analysis indicator.
Overview:
ChronoVolume analyzes volume data in MetaTrader 4 by converting basic tick volume into meaningful trading insights.
Since MT4 only provides tick volume (number of price changes), this indicator uses algorithms to estimate buying and selling pressure, giving you a clearer picture of market sentiment.
It offers three ways to calculate volume (types) and three ways to display it (modes), allowing you to analyze from different perspectives.
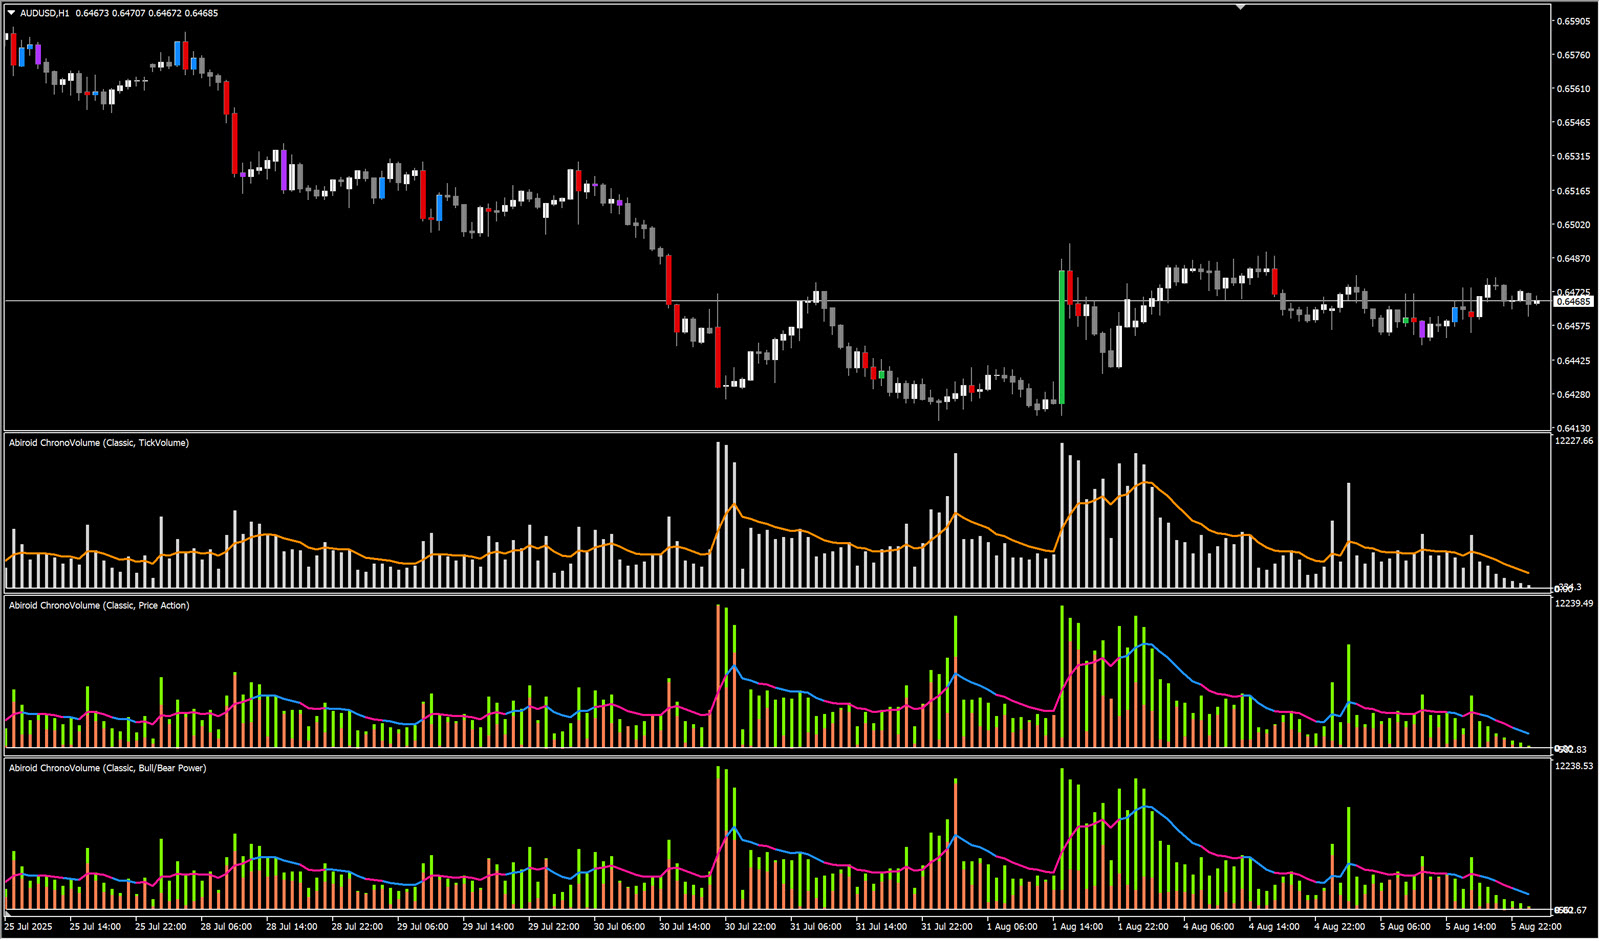
Volume Calculation Methods
1. Price Action Volume Type
Analyzes where the closing price falls within each bar's range to estimate buying vs selling pressure.
How it works:
If high → More buying pressure
If close is near the low → More selling pressure
If close is in the middle → Balanced activity
Buy Volume = Total Volume × (Close - Low) / (High - Low)
Sell Volume = Total Volume × (High - Close) / (High - Low)
Best for: Traditional breakout analysis, trend confirmation, divergence spotting
2. Bull/Bear Power Volume Type
Uses deviation from a 13-period moving average to measure institutional buying and selling strength.
How it works:
EMA13 = 13-period moving average of closing prices
Bull Power = High - EMA13 (how far high extends above average)
Bear Power = Low - EMA13 (how far low extends below average)
Distribution based on absolute values of Bull Power vs Bear Power
Best for: Momentum analysis, institutional flow detection, EMA-based strategies
3. Tick Volume Type
Enhanced processing of raw tick volume without directional bias.
How it works:
Pure tick volume with advanced smoothing and scaling
No assumptions about buying vs selling
Best for: Overall market participation, volume spikes, neutral analysis
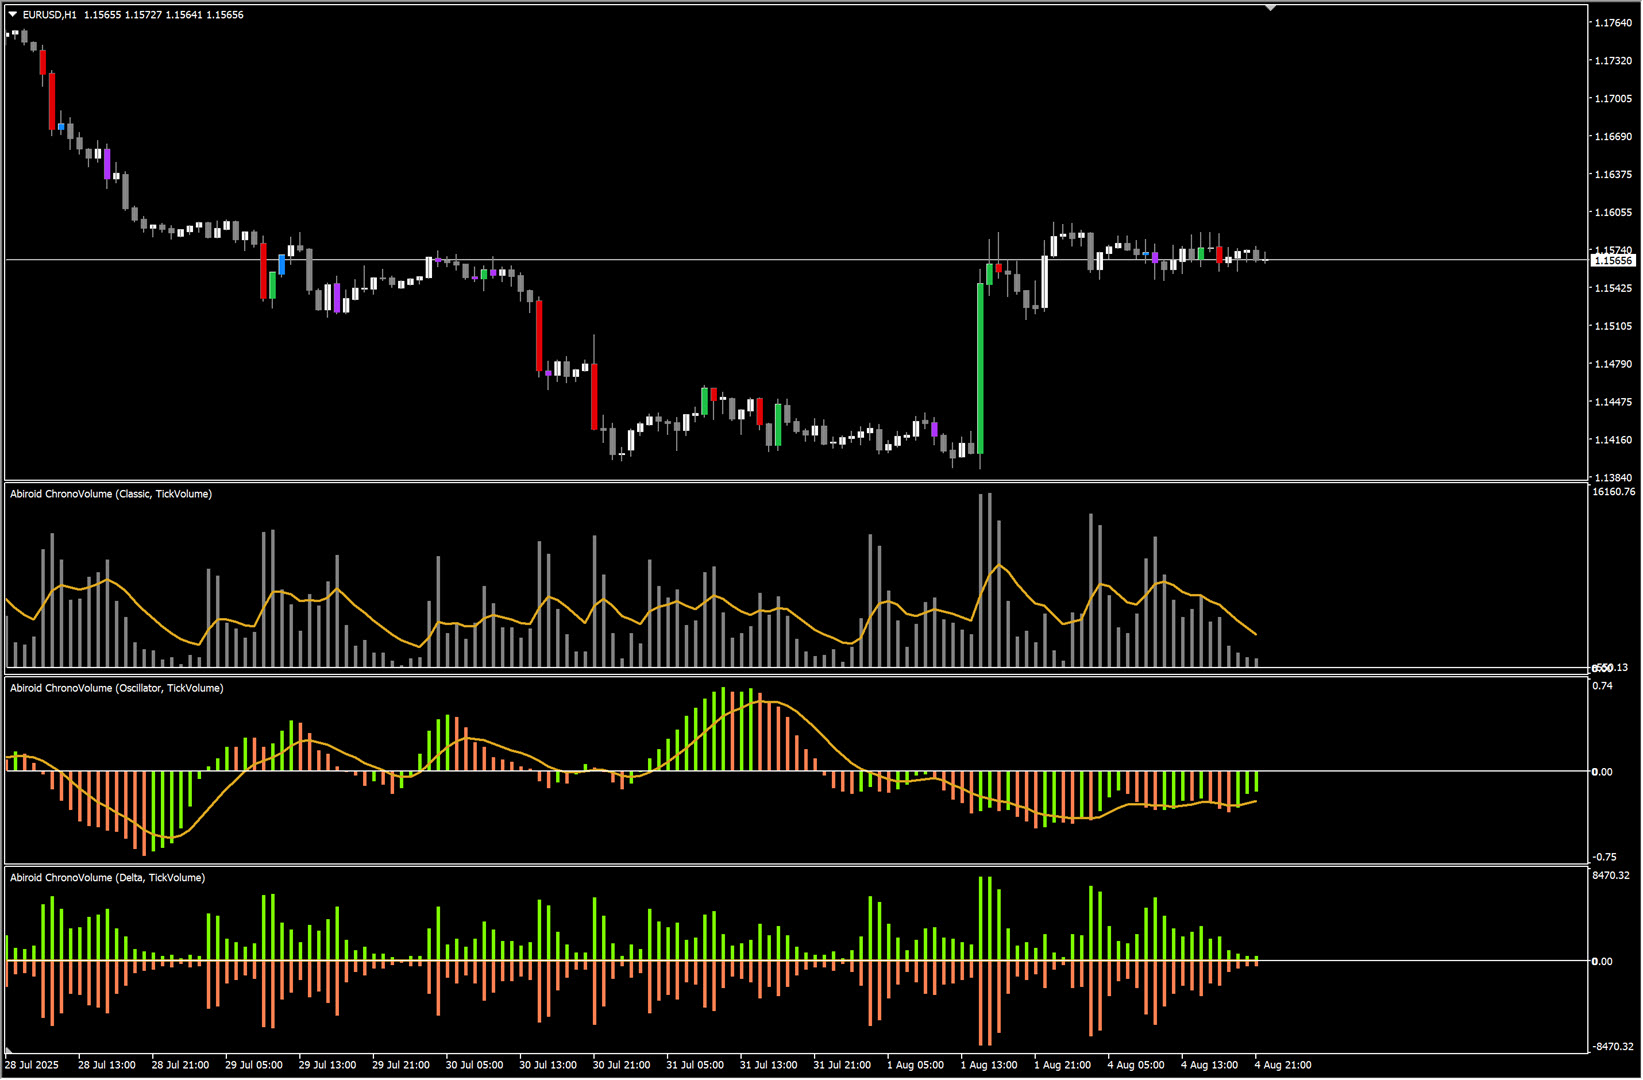
Display Modes:
a) Classic Mode
Shows volume relative to recent averages, perfect for identifying unusual activity.
What you see:
- Histogram bars showing current volume compared to average
- Optional smooth line for trend identification
- Color coding based on your selected volume calculation method
Calculations:
- Calculate relative volume: Current Volume/Average of last 6 bars
- Apply smoothing: Spotting volume spikes, confirming breakouts, identifying divergences
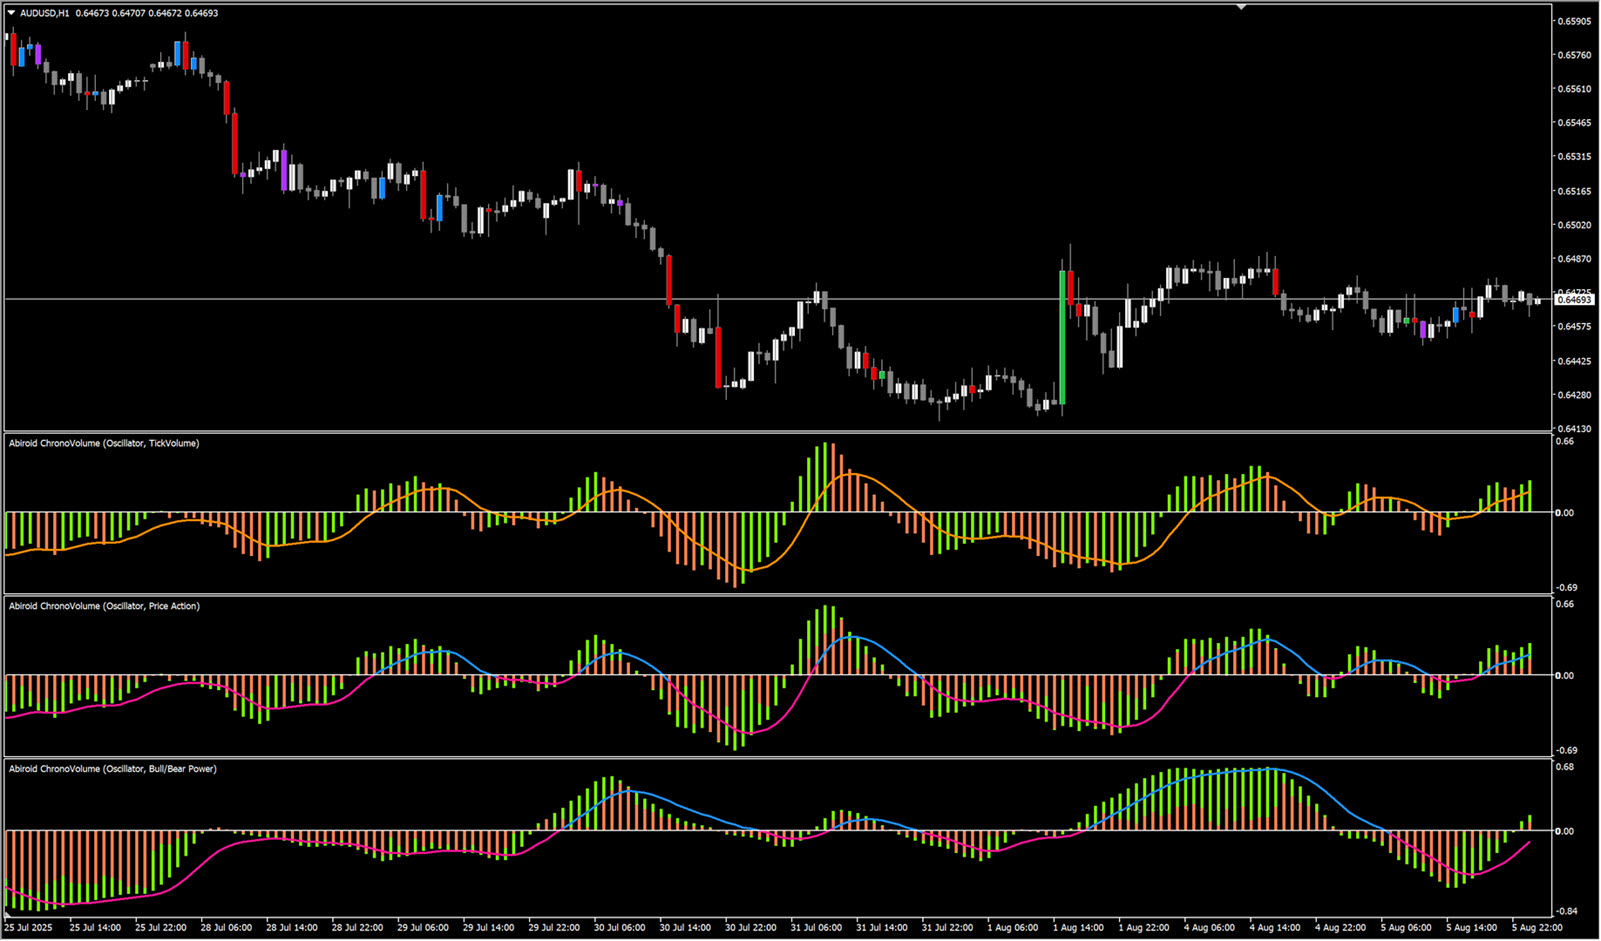
b) Oscillator Mode
Transforms volume into momentum format, oscillating around zero to show directional pressure.
What you see:
- Values above zero = Net buying pressure
- Values below zero = Net selling pressure
- Optional smooth line showing momentum direction
Calculations:
- Calculate buying vs selling difference
- Apply two EMAs (21 and 36 periods) to smooth the data
- Take difference between fast and slow EMA4. Normalize using sigmoid function for bounded oscillator
Use for: Momentum shifts, overbought/oversold conditions, zero-line crosses
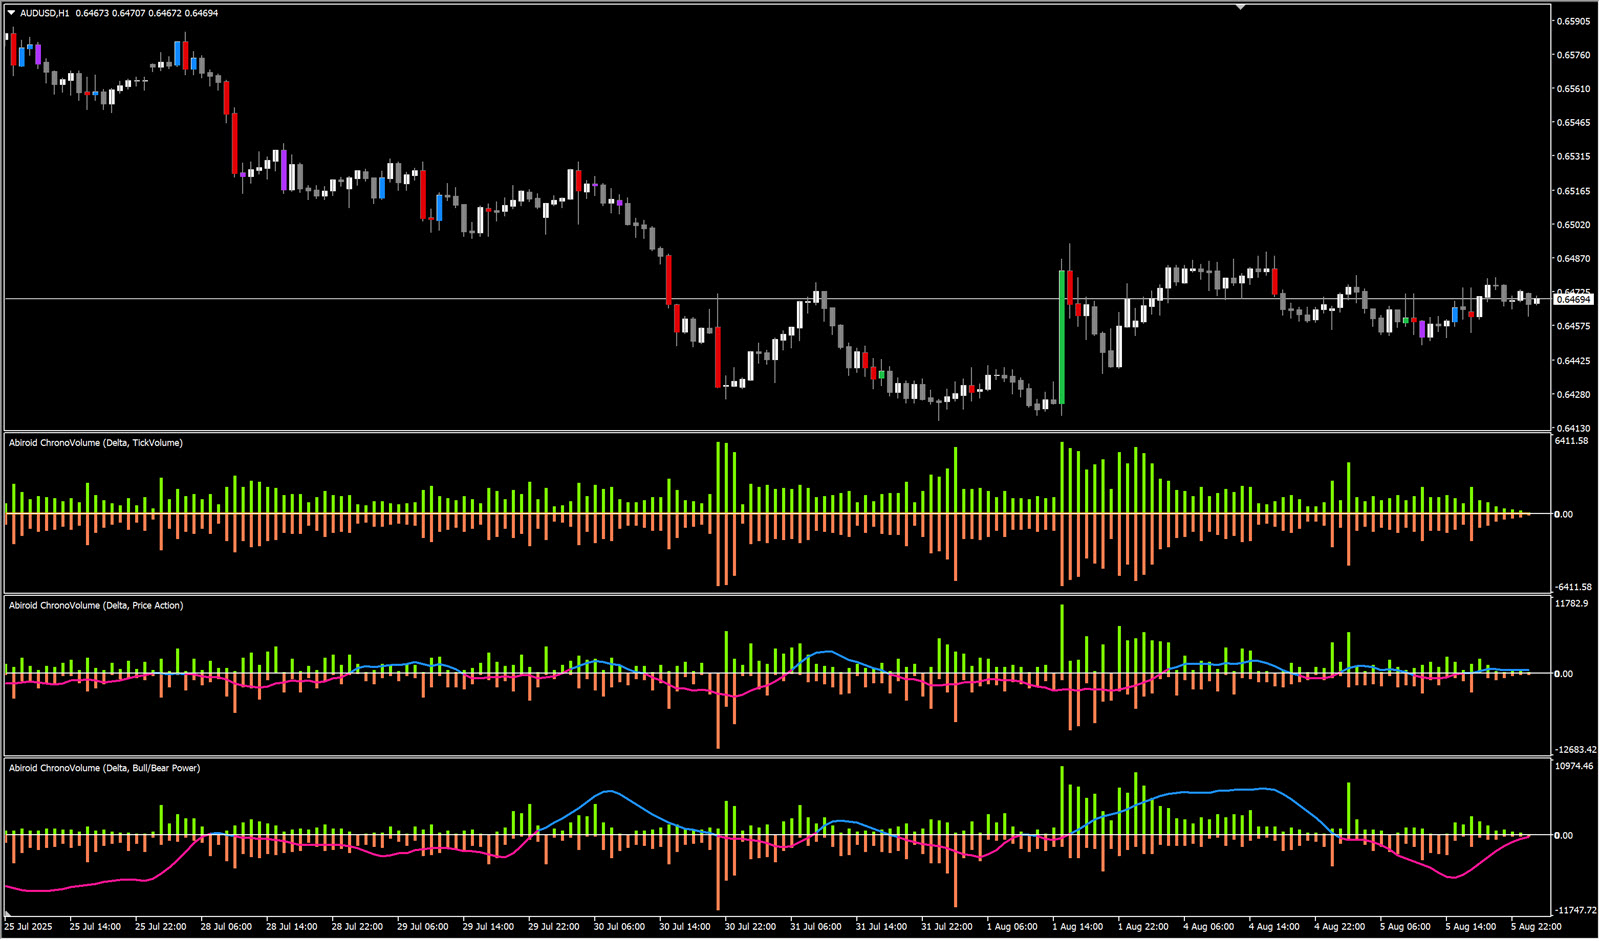
c) Delta Mode
Shows net buying vs selling pressure, revealing institutional order flow.
What you see:
- Positive bars = Buying dominance
- Negative bars = Selling dominance
- Magnitude shows strength of net flow
Mathematical process:
1. Start with buying vs selling difference
2. Scale by volume context (× 200-period average × 20)
3. Apply EMAs (21 and 36 periods) to scaled values
4. Smooth the difference with adjustable smoothing factor
Use for: Institutional flow analysis, early reversal detection, net pressure assessment
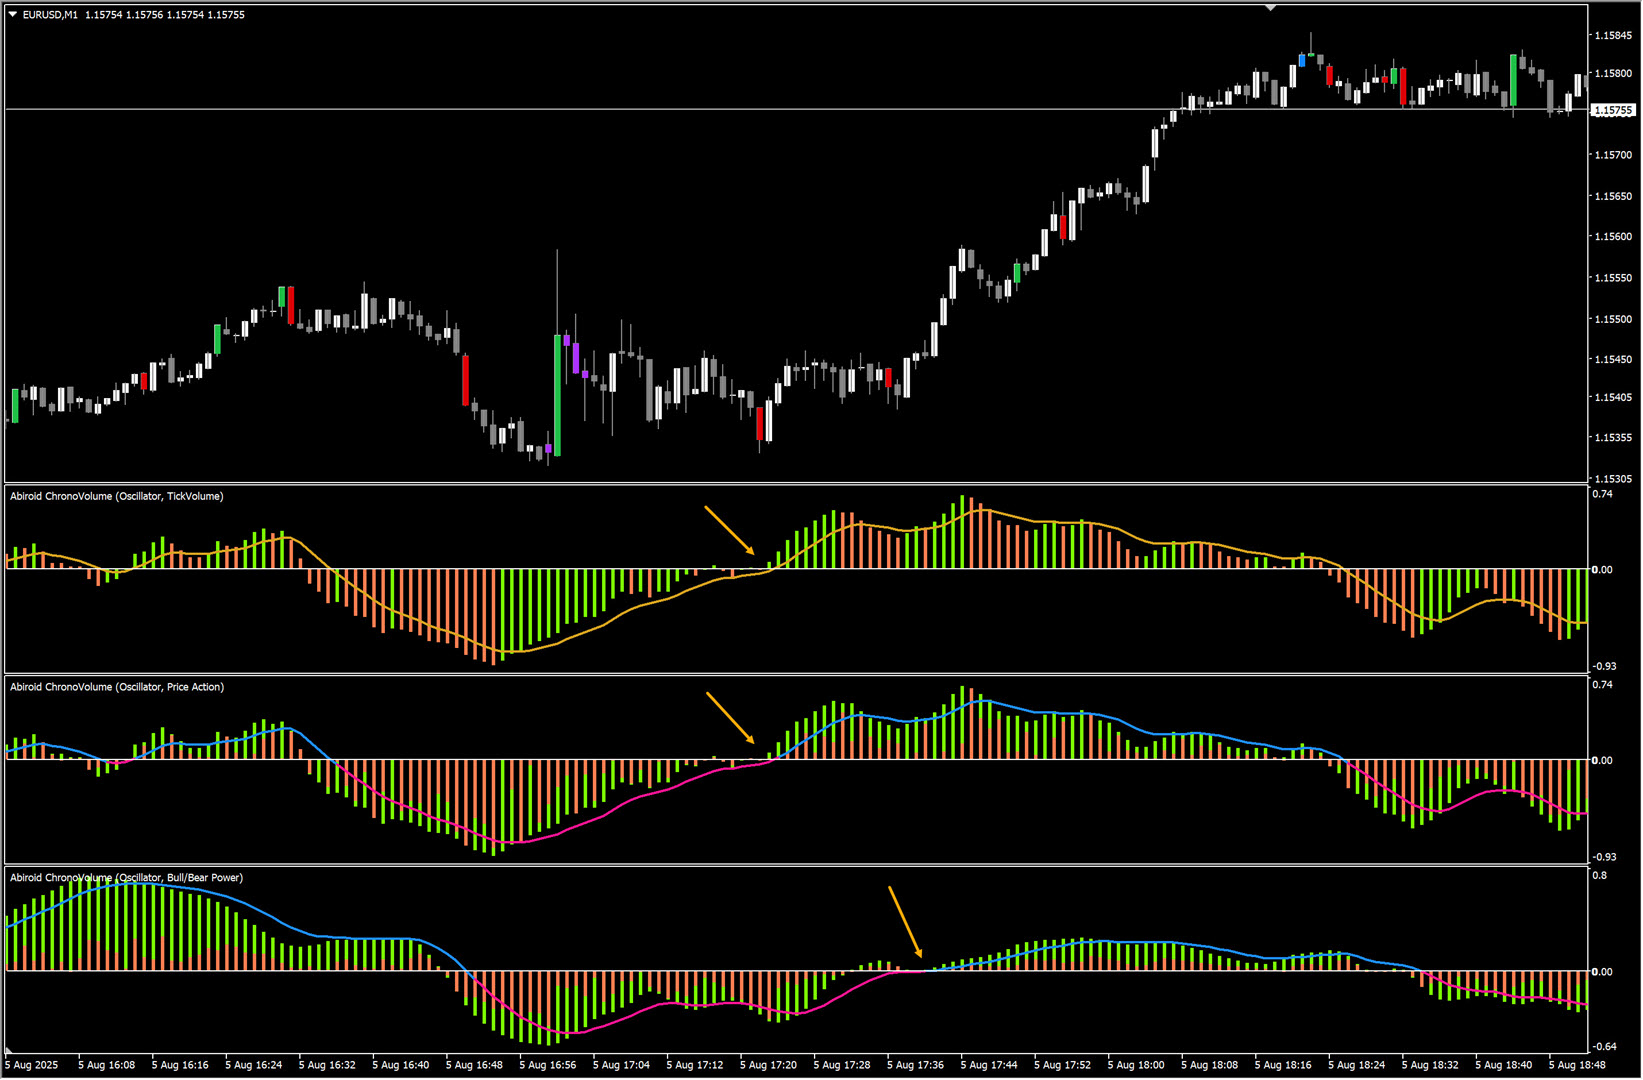
Settings:
Core Settings
- Relative Length (1-10): How many bars to look back for average volume calculation. Lower = more sensitive to recent changes
- Display Mode: Choose Classic, Oscillator, or Delta based on your analysis needs
- Volume Type: Select Price Action, Bull/Bear Power, or Tick Volume calculation
- Bar Shift: Controls repainting behavior (0 = real-time updates, 1 = confirmed signals only)
- Show Raw Tick Volume: Adds gray background bars showing actual tick volume for reference
- Show Smoothing Line: Enables trend line with intelligent color coding
- Color Customization: Adjust all colors to match your chart theme
- Oscillator EMA Lengths: Fine-tune the 21 and 36-period averages for momentum calculation
- Delta Smoothing Factor: Adjust noise reduction in Delta mode (higher = smoother)
- Maximum Past Bars: Limit calculation scope for better performance
Reading the Signals
Volume Spikes (All Types):
- Large bars indicate unusual activity
- Compare current bar height to recent average
- Spikes often precede significant price moves
Color Interpretation:
- Green/Teal: Buying pressure or upward momentum
- Red: Selling pressure or downward momentum
- Gray: Neutral or raw tick volume
Smooth Line Signals:
- Direction changes: Potential momentum shifts
- Color changes: Trend confirmation or reversal warning
- Slope: Strength of current trend
Mode-Specific Applications
Classic Mode Applications:
- Confirm breakouts with volume spikes
- Spot divergences (price up, volume down = weakness)
- Identify accumulation/distribution phases
- Validate support/resistance levels
Oscillator Mode Applications:
- Trade zero-line crosses with price confirmation
- Identify momentum divergences
- Spot overbought/oversold extremes
- Confirm trend strength
Delta Mode Applications:
- Track institutional buying/selling campaigns
- Identify early reversal signals
- Confirm trend sustainability
- Analyze net order flow imbalances
Best Practices
Timeframe Selection:
- Lower timeframes (M1, M5): More noise, use for entry timing
- Higher timeframes (H1, H4): Cleaner signals, better for trend analysis
- Multiple timeframes: Best overall perspective
Combining with Price Action:
- High volume breakouts are more reliable than low volume ones
- Volume should confirm price direction for strong trends
- Divergences between price and volume often signal reversals
Risk Management:
- Use volume confirmation to size positions (high volume = higher confidence)
- Be cautious of moves on declining volume
- Monitor volume patterns for early exit signals
Common Patterns
Breakout Confirmation
- Price breaks resistance + volume spike = Strong breakout
- Price breaks resistance + low volume = Potential false breakout
- Uptrend + increasing volume = Healthy trend continuation
- Uptrend + decreasing volume = Potential trend weakness
- Price makes new high + volume makes lower high = Bearish divergence
- Heavy volume at support/resistance = Potential reversal zone
- Price consolidates + volume increases = Potential breakout setup
- Price rises + volume decreases = Possible distribution phase
Tips for Different Trading Styles
Day Trading
- Use Oscillator mode on lower timeframes
- Focus on zero-line crosses and momentum shifts
- Combine with price action for entry timing
- Use Classic or Delta mode on higher timeframes
- Look for volume confirmation on weekly/daily levels
- Focus on multi-day volume patterns
- Use any mode on M1-M5 timeframes
- Focus on immediate volume spikes
- Quick in/out based on volume momentum
- Use Delta mode on daily/weekly charts
- Track long-term institutional flow
- Focus on major volume trend changes
Why Oscillator Mode Needs to Recalculate Past Bars:
The oscillator mode uses a chain of three Exponential Moving Averages (EMAs) - a 21-period EMA, a 36-period EMA, and a final 9-period EMA of their difference. Each EMA calculation depends on the previous bar's EMA value.
Smoothing Effects: Unlike simple moving averages that only look at a fixed window of data, EMAs give exponentially decreasing weight to older values and more weight to newer values.
Calculation Order Sensitivity: The oscillator's final value comes from normalizing the difference between the short and long EMAs using a 200-period Simple Moving Average (SMA) of absolute differences.
This creates a feedback loop where:
- New price data affects the buy/sell momentum calculation
- This changes the EMA values for recent bars
- The EMA changes affect the normalization factor (boundSMA)
- The new normalization factor recalculates oscillator values for past bars
Practical Impact: While this recalculation is mathematically correct and provides smoother, more responsive signals, it means that oscillator values for the last 50-200 bars may shift slightly when new data arrives. For most trading applications, this smoothing benefit outweighs the historical value adjustments. Because new data is more essential for current trades. If you want absolutely non-repainting volume bars, then don't use the oscillator mode.
Remember: Volume analysis works best when combined with price action and other technical analysis methods.
Use ChronoVolume to confirm your trading ideas rather than as a standalone signal generator.
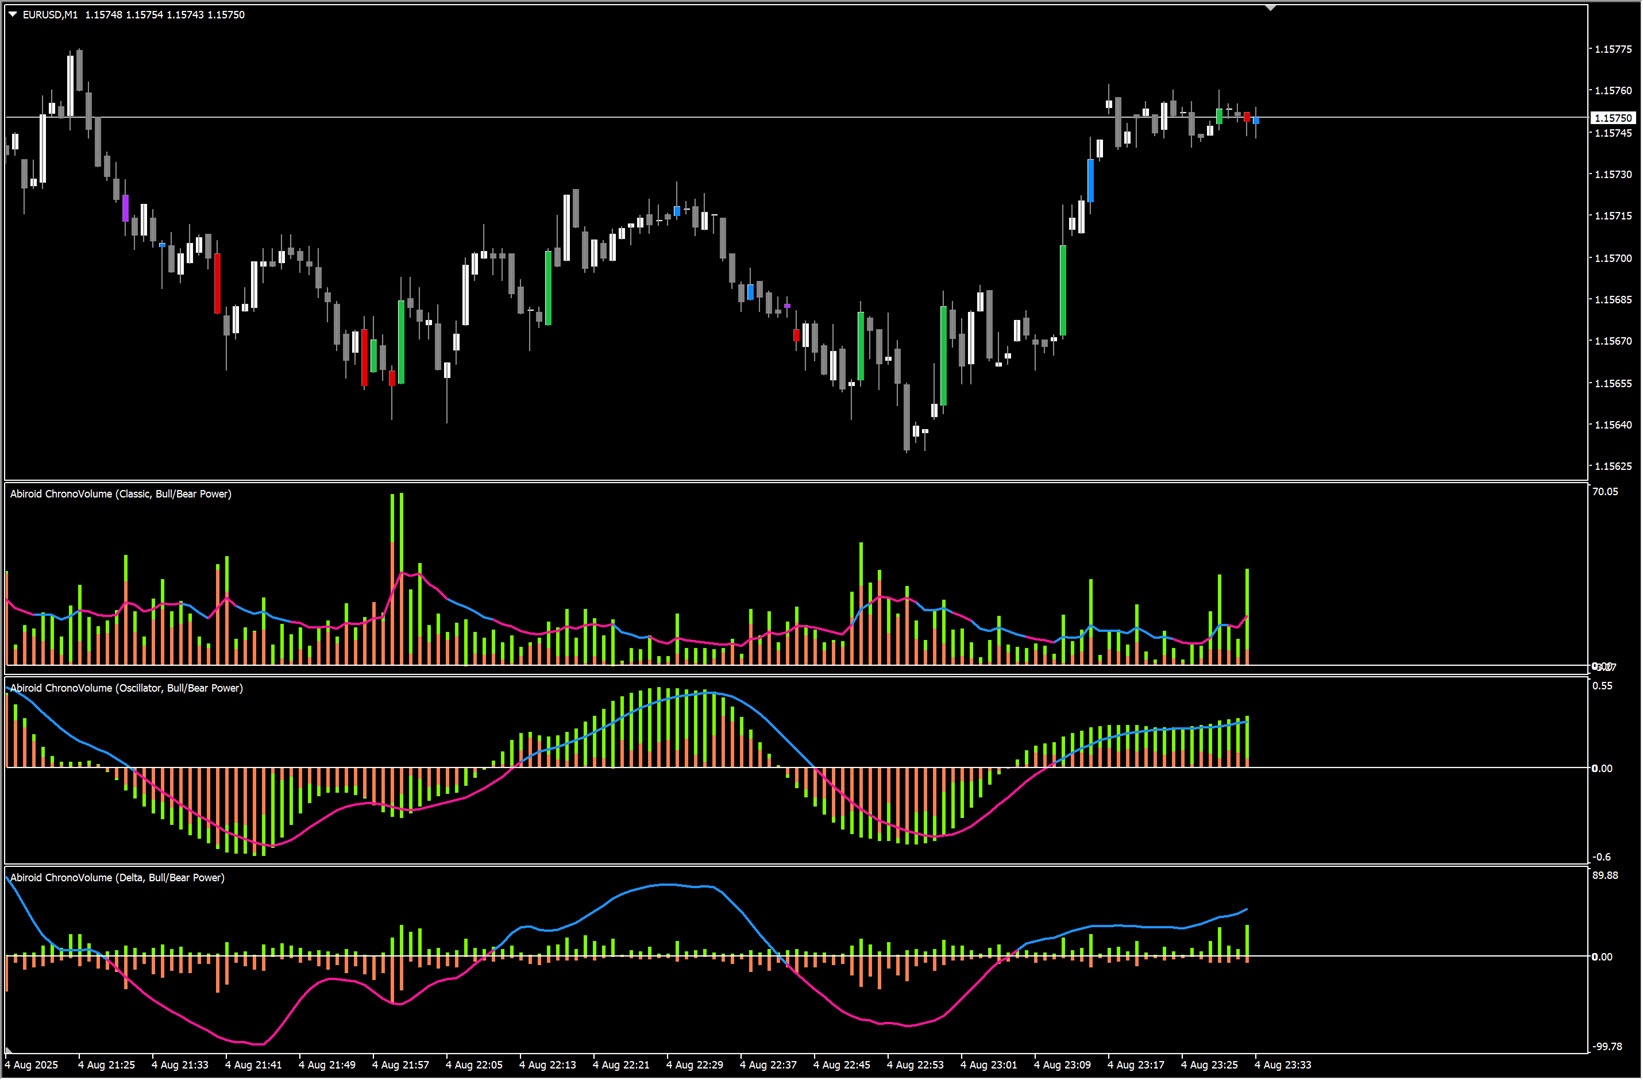
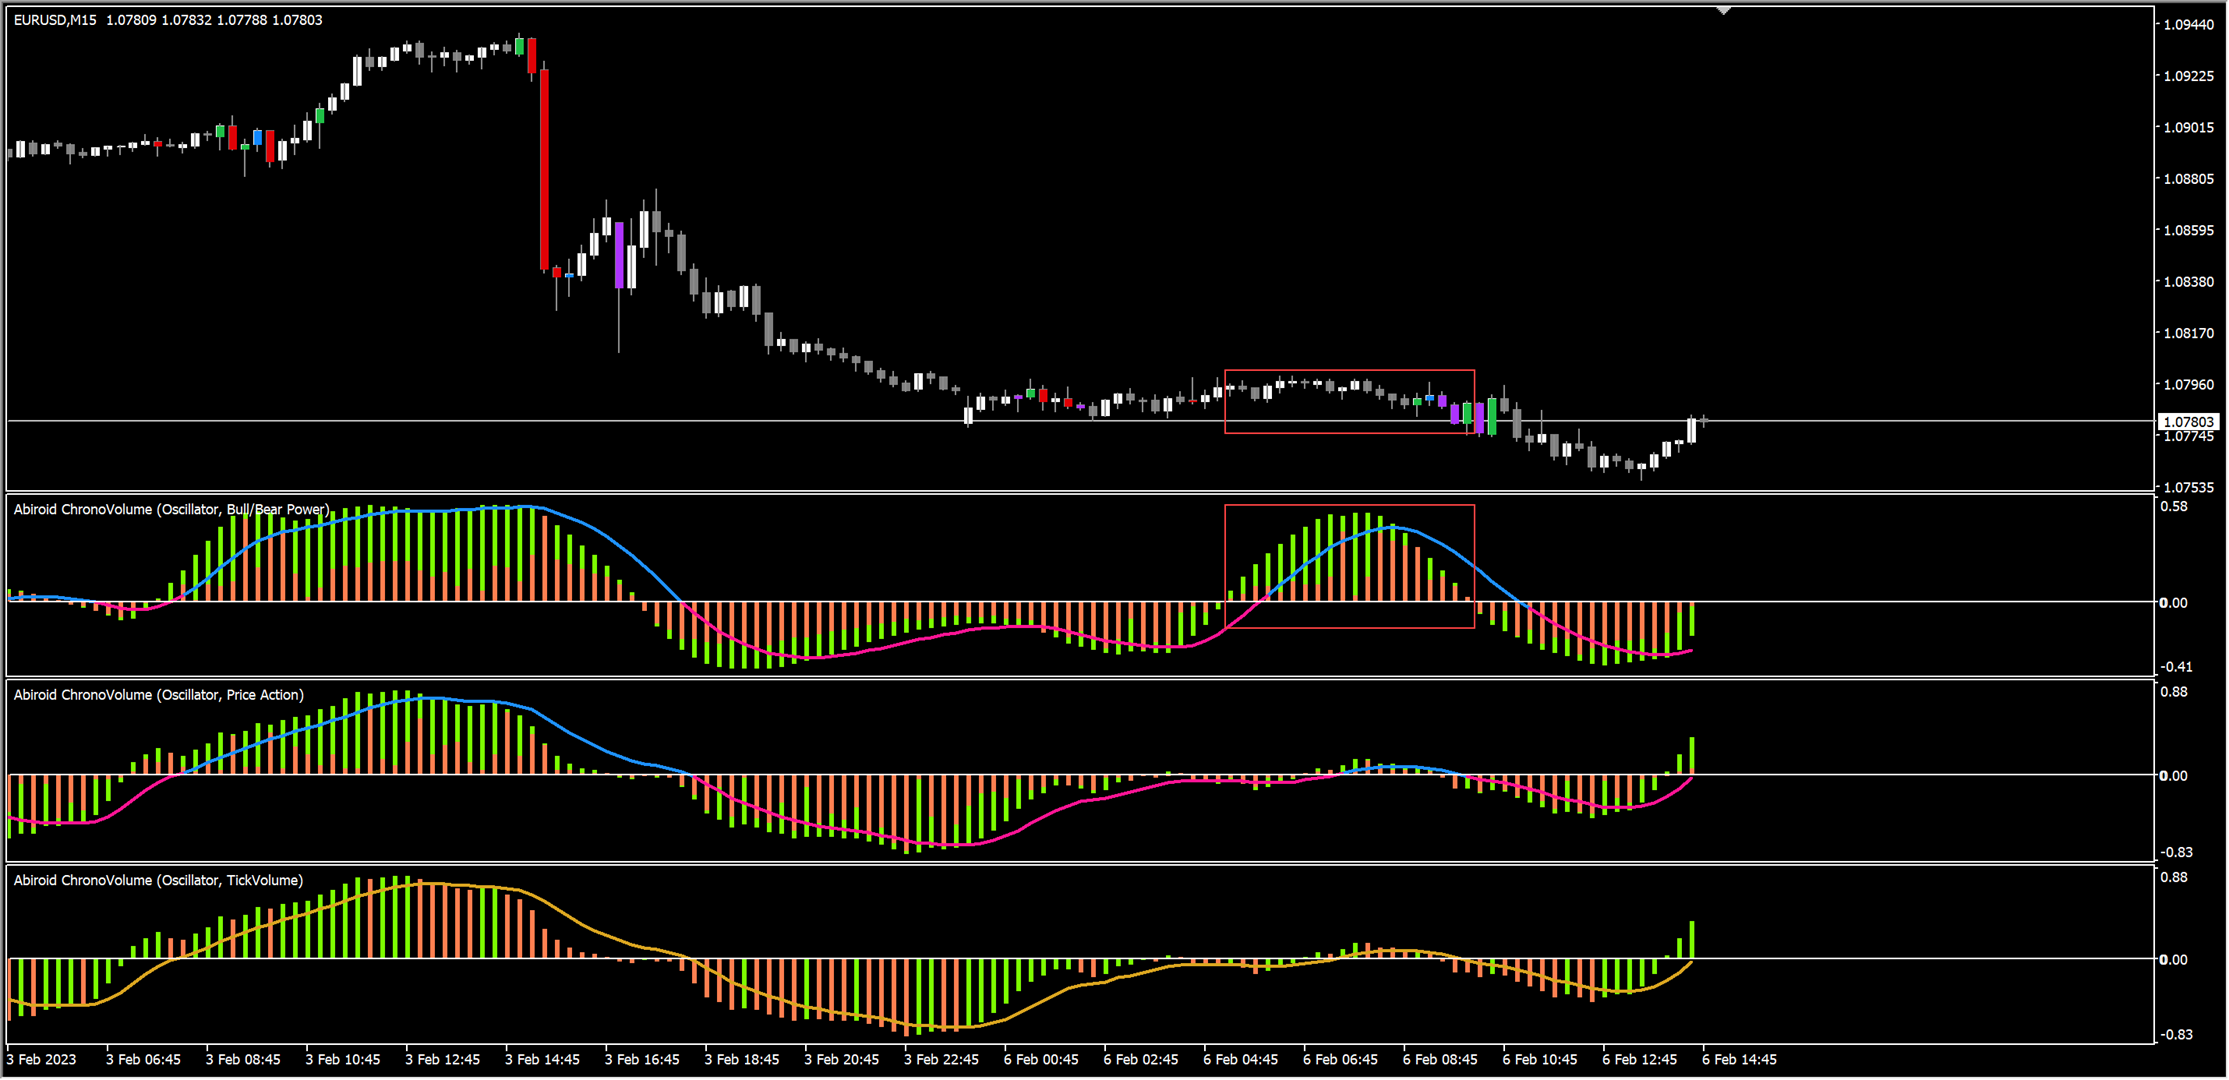
How Oscillators are Actually Useful:
They are great for vaildating trades. Example, here price looks like it's breaking out of a tight range, and might enter a bullish move.
But oscillators are still below 0, and show bearish lines. So not the best time to trade just yet:
And surely enough, after a few bars, price still stays in a range:
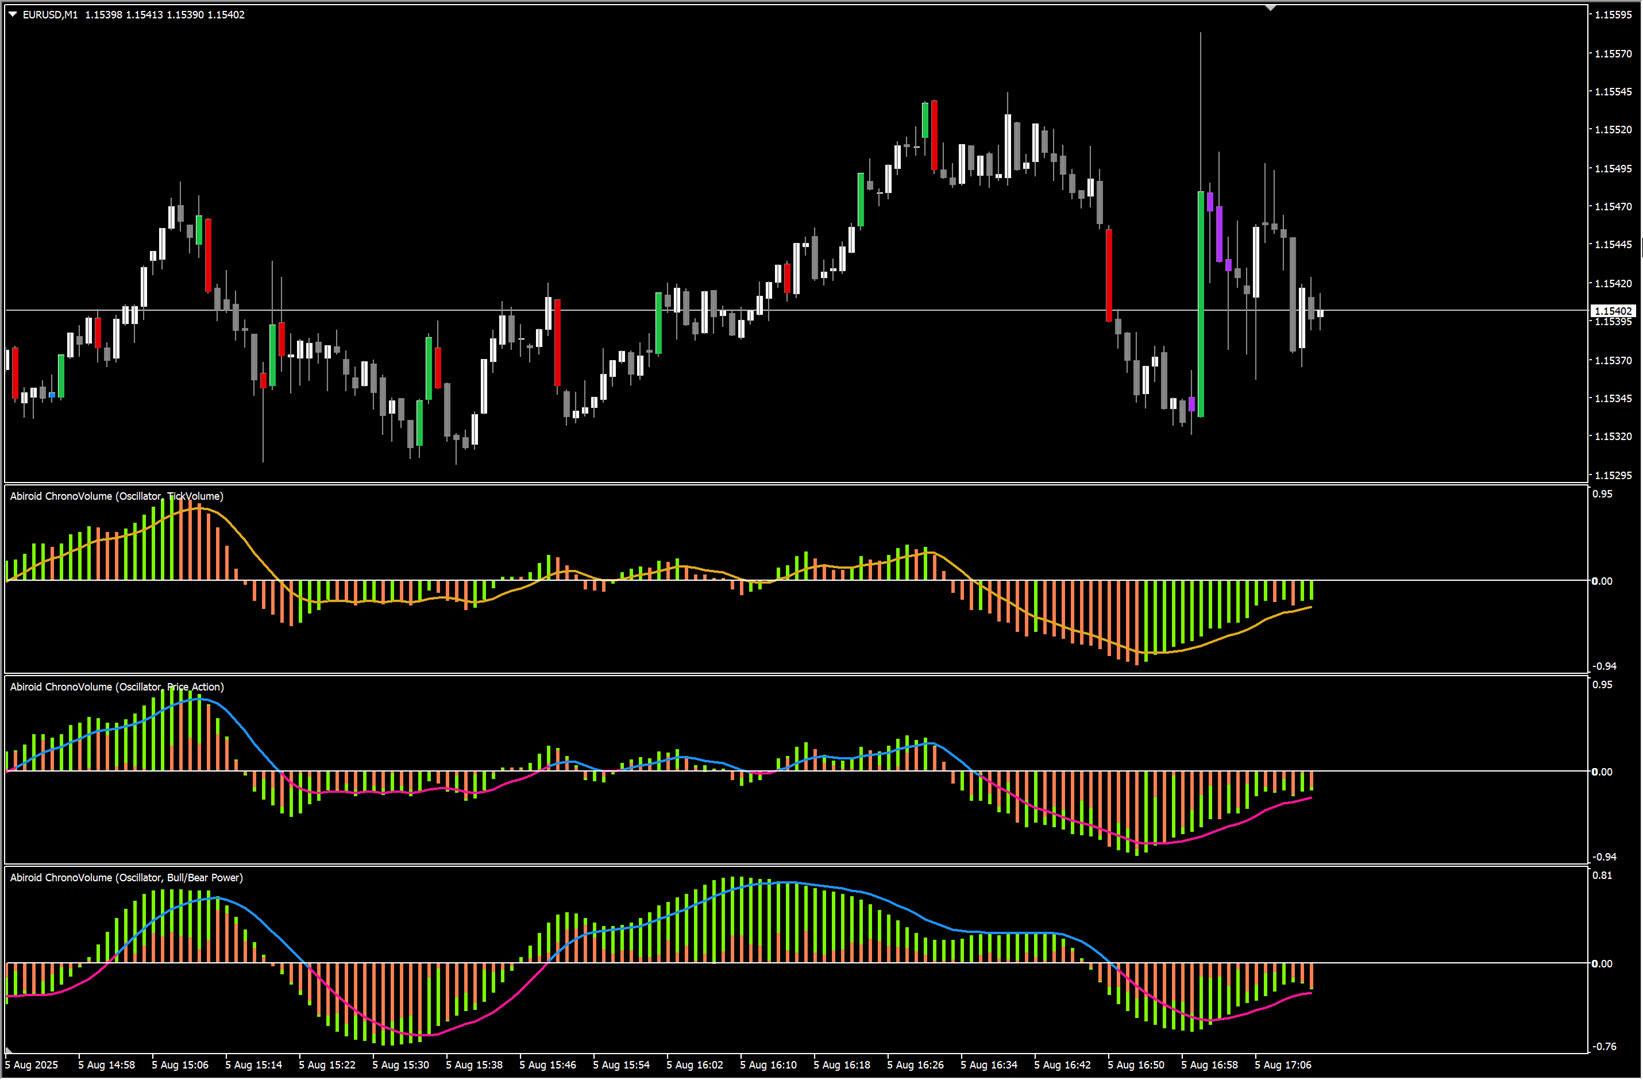
Finally when oscillators do move above 0, price goes Bullish:
Bull/Bear power oscillator takes it's time to go above 0, but after that the trend really picks up.
But, one thing to be careful about Bull/Bear Power, is that it studies the Bull vs Bear power push and pull.
And so the histogram bars might sometimes look too long, even when price is in a slow market move.
So it's great for capturing trend shifts, but be careful during slow markets. Other volume types reflect slow markets a lot better:
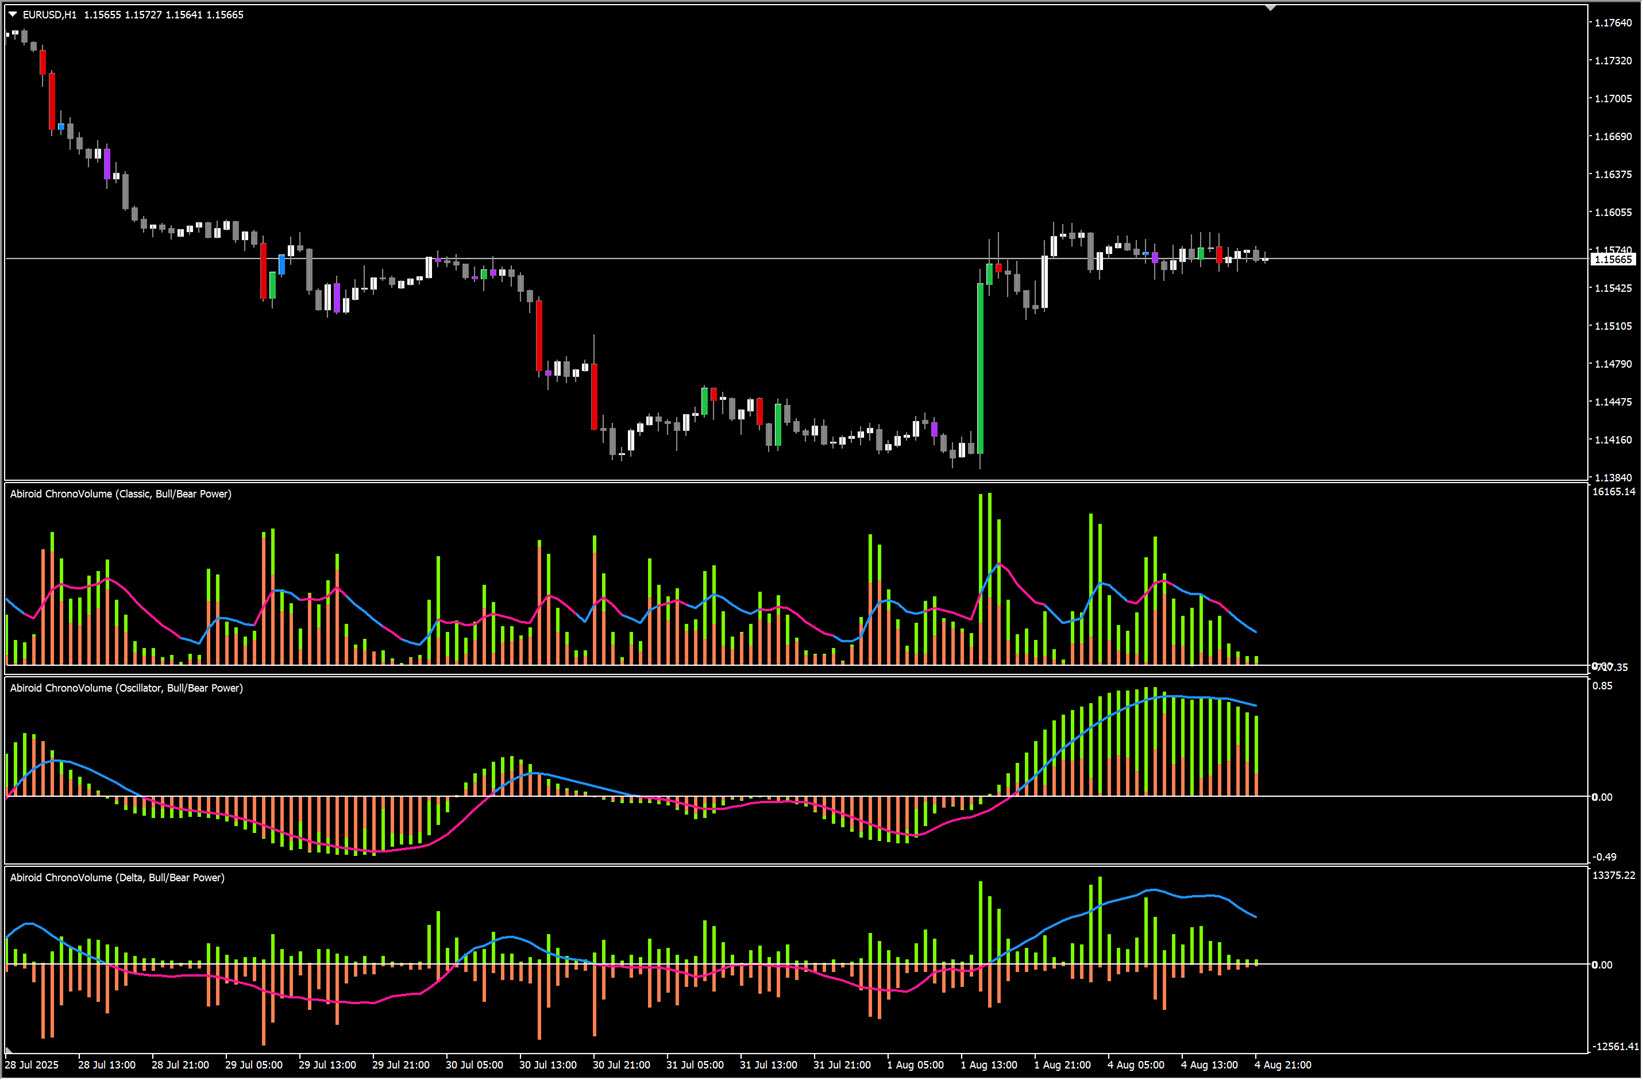
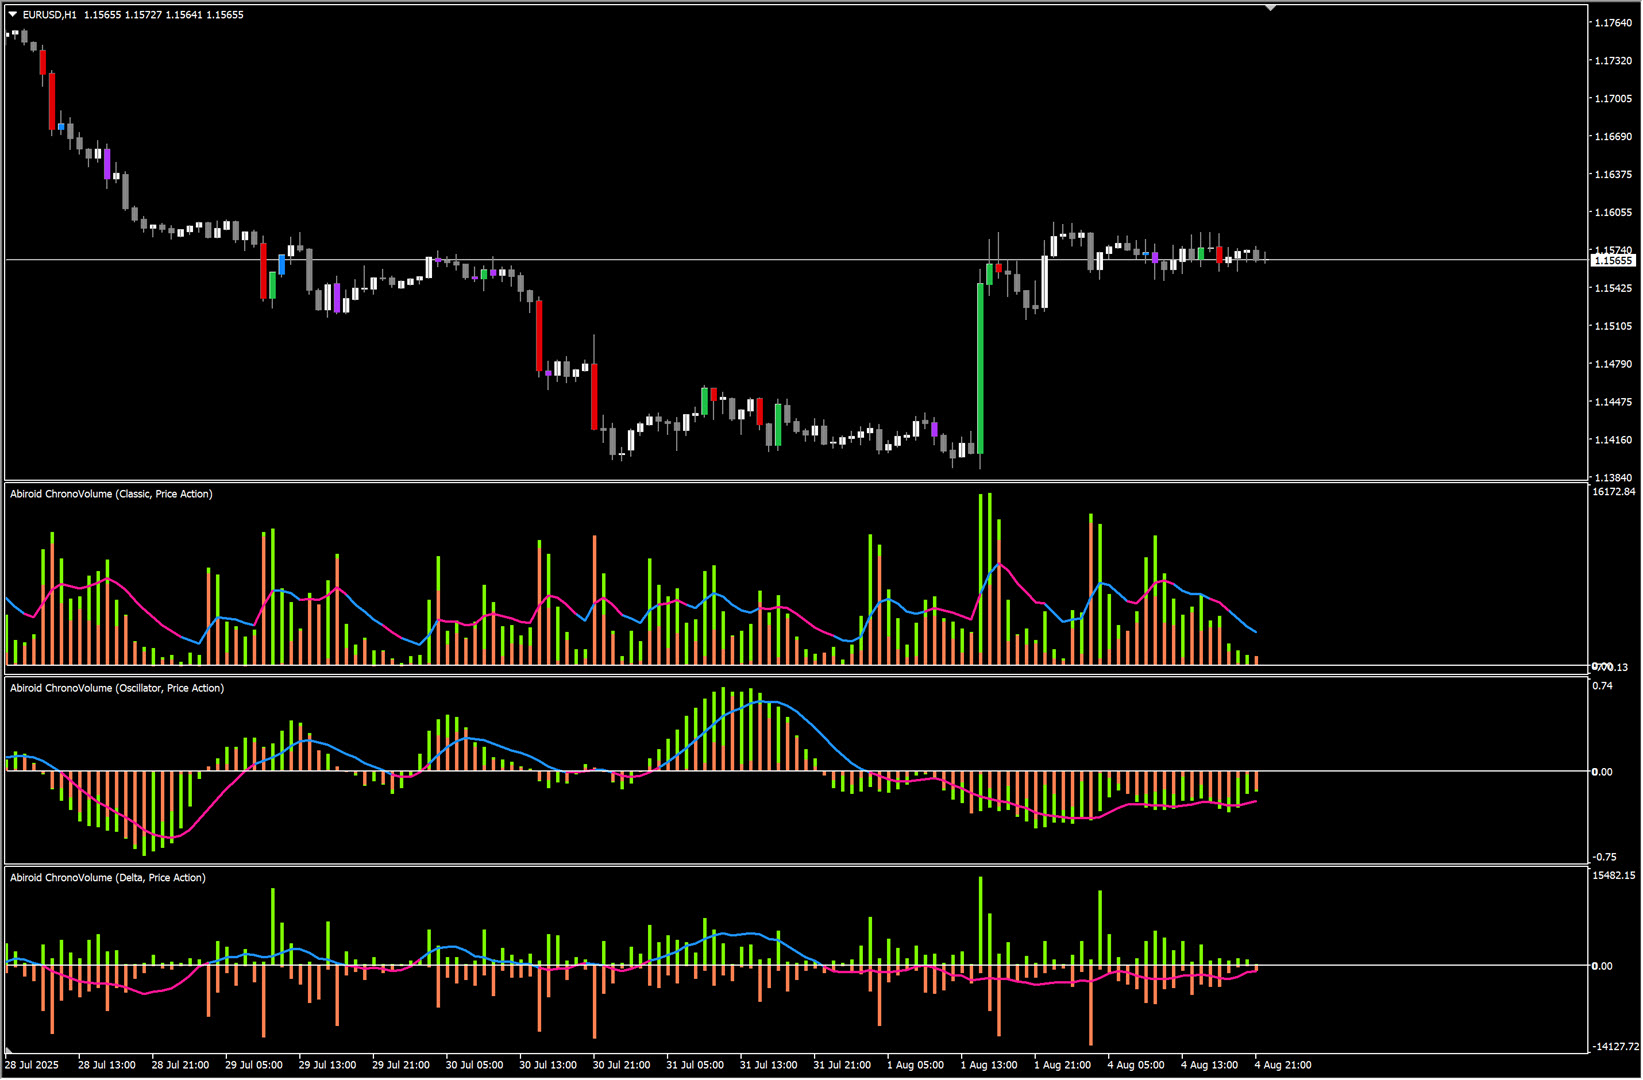
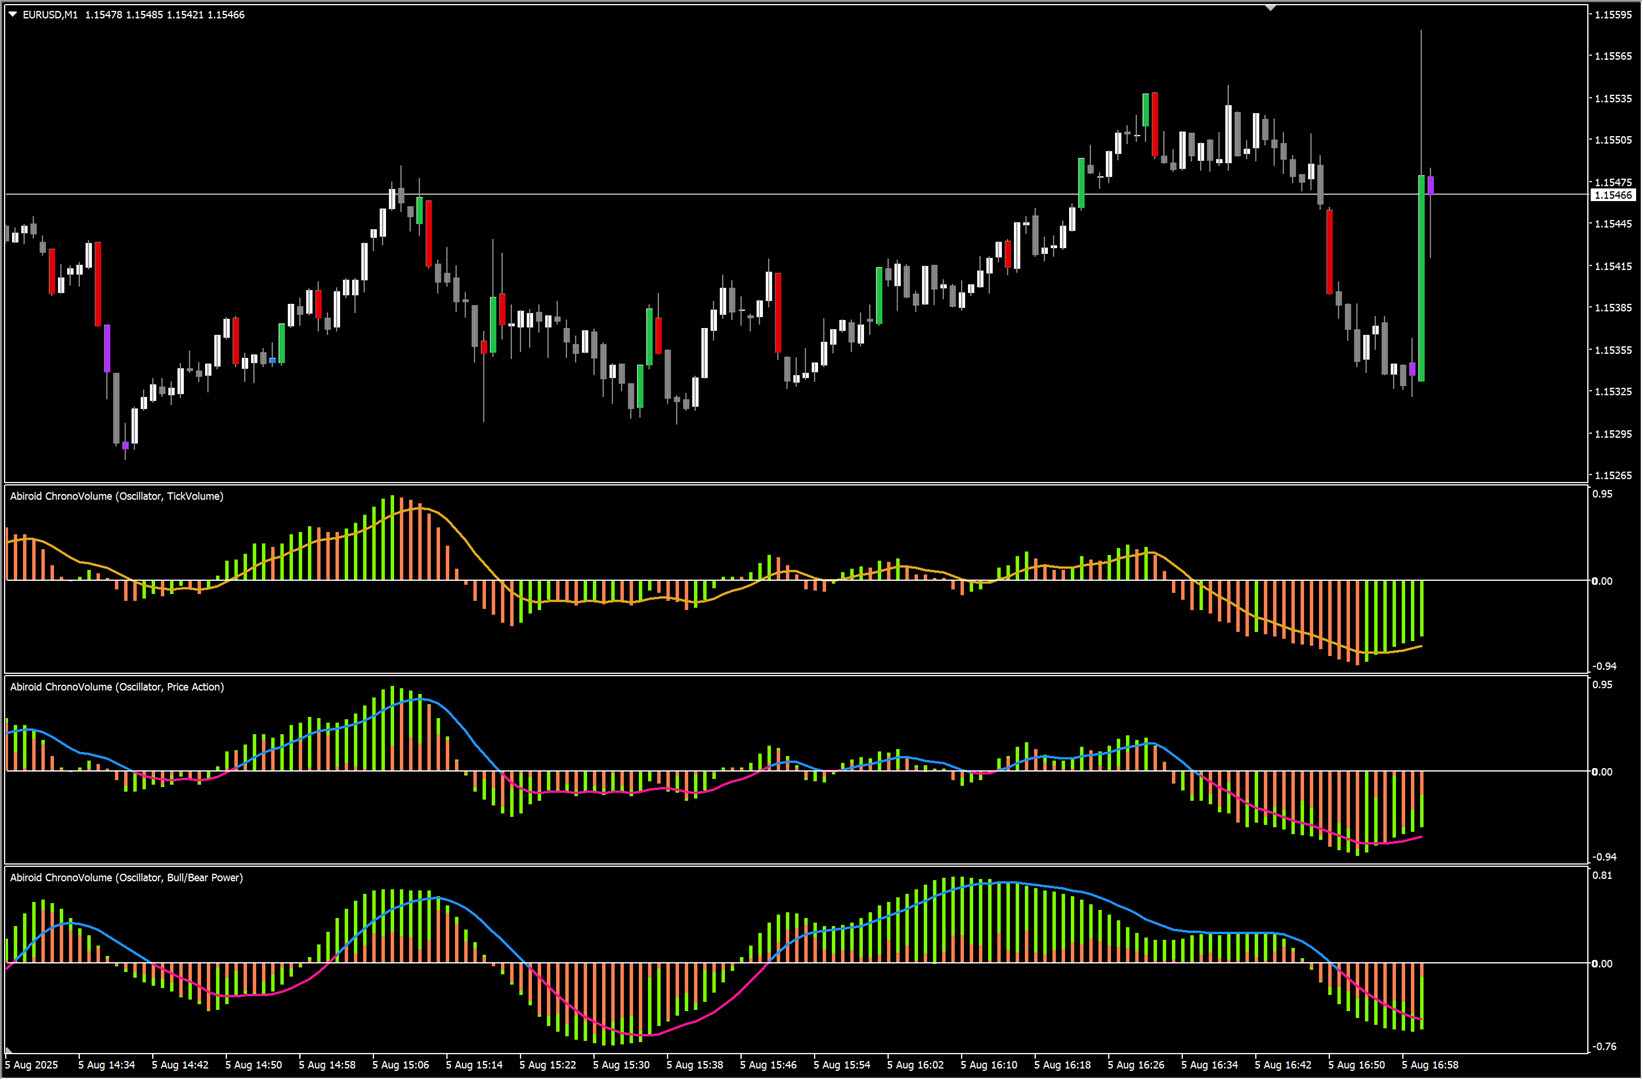
Best thing to do is to compare all modes and volume types side-by-side and see which one suits your trading best.
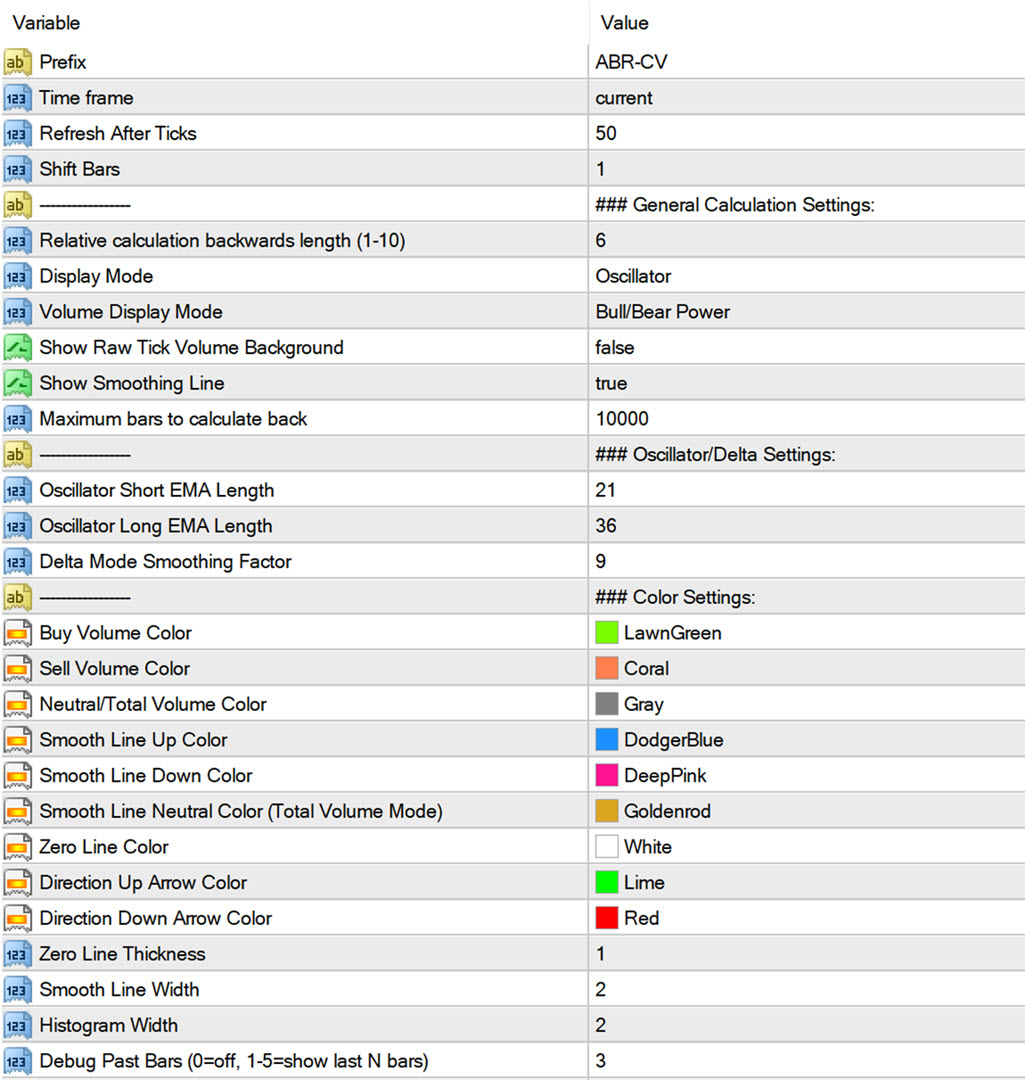
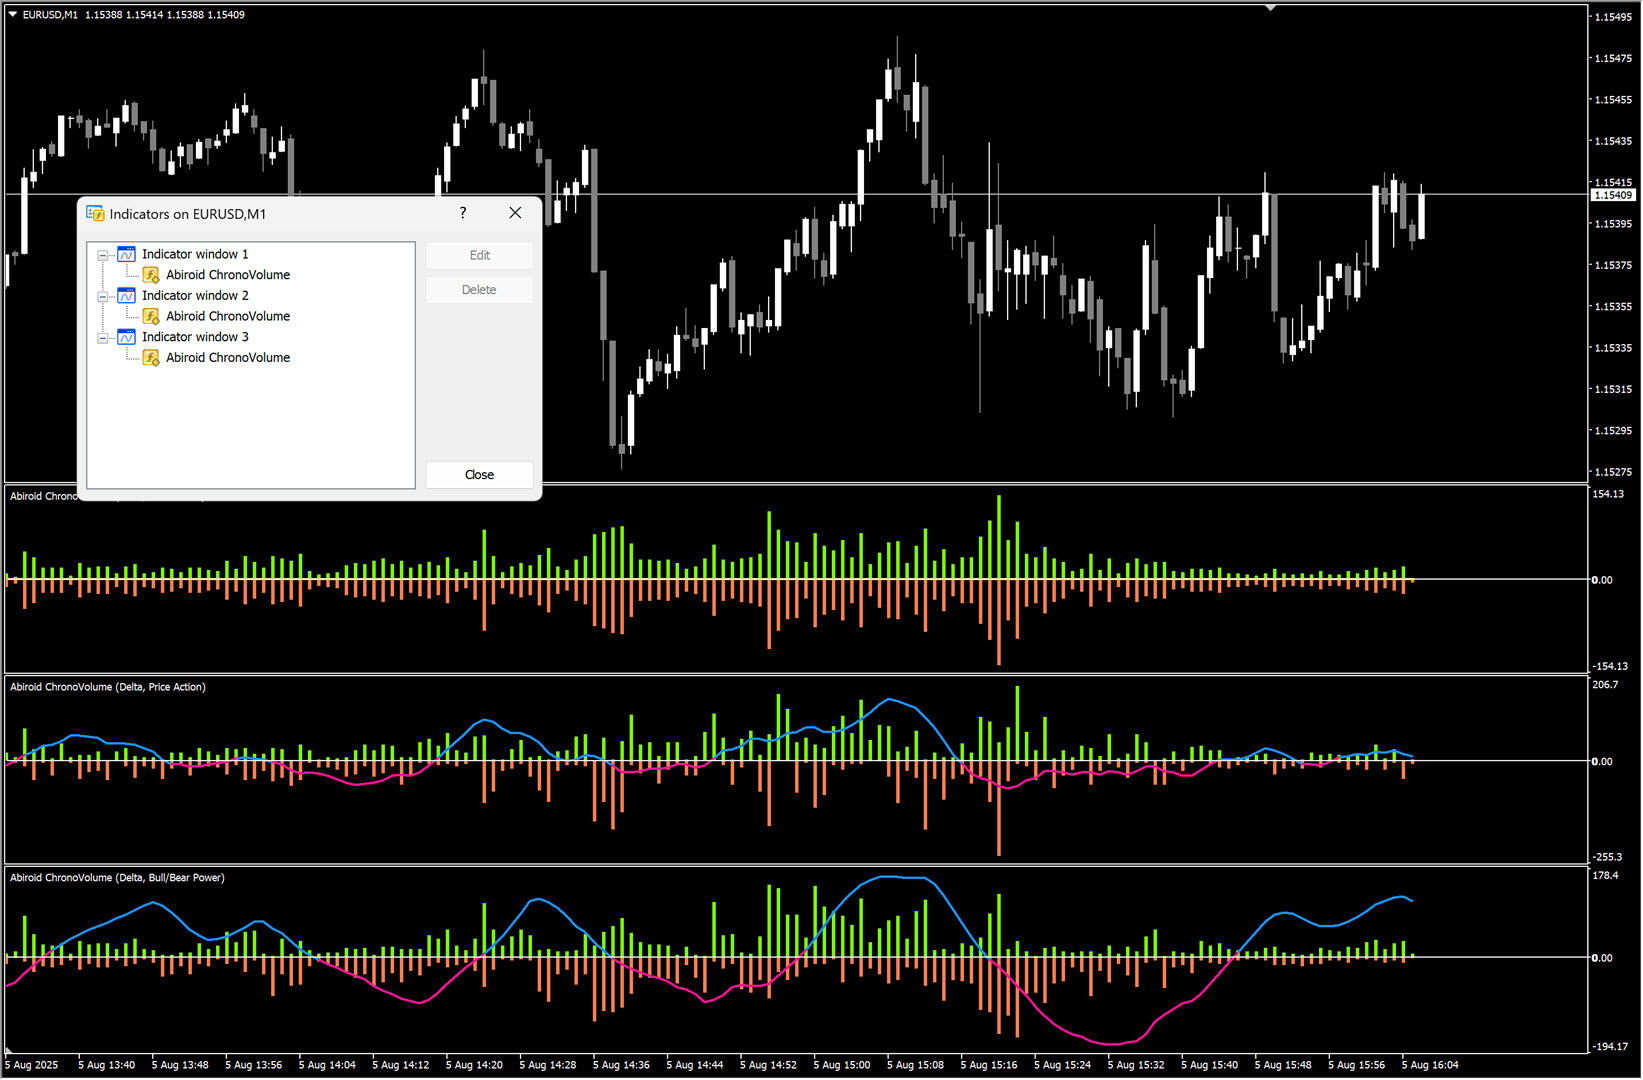
The indicator is a single histogram only. But you can place several on the chart:
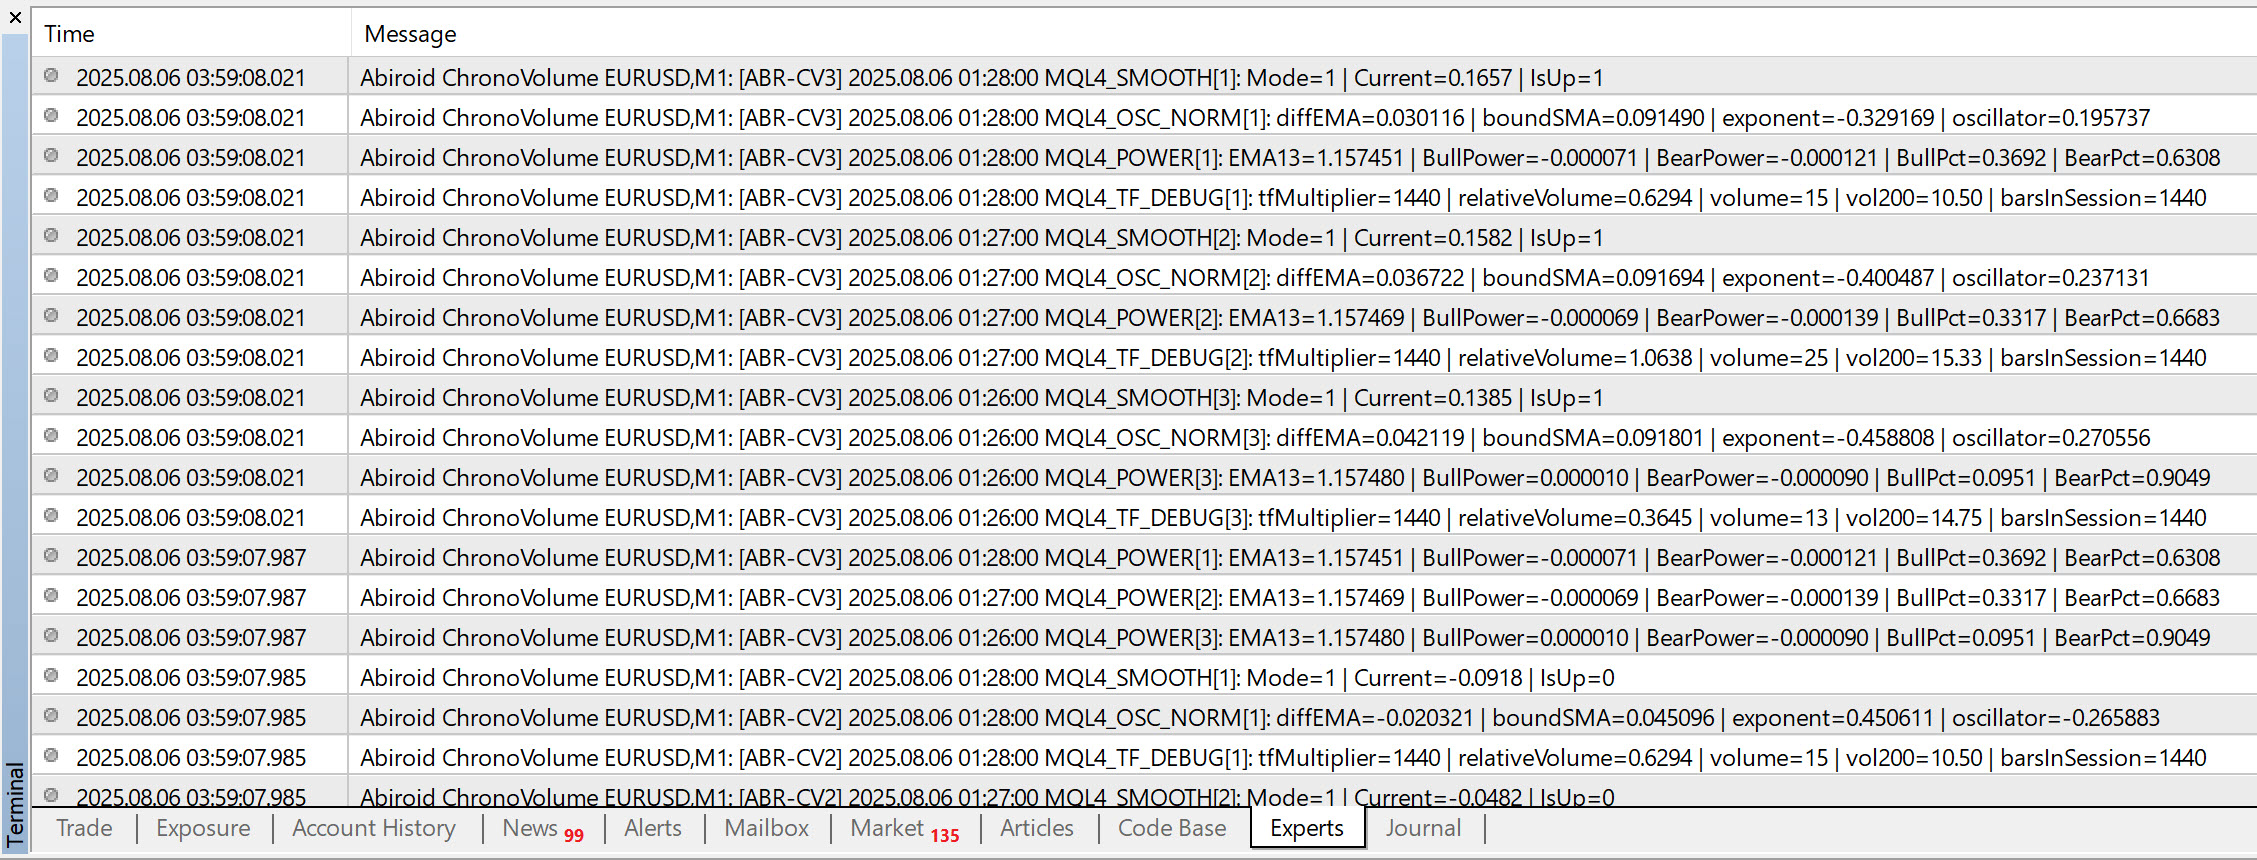
Debugging:
Keep DebugPastBars to any value more than 0, and it will show you detailed debug logs in your Experts tab.
It's very useful when comparing values. By default it is off (set to 0):
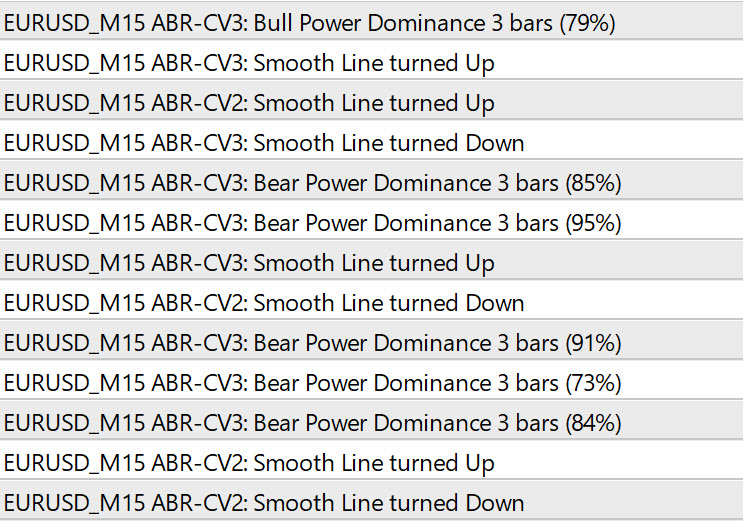
Enhanced Alert System
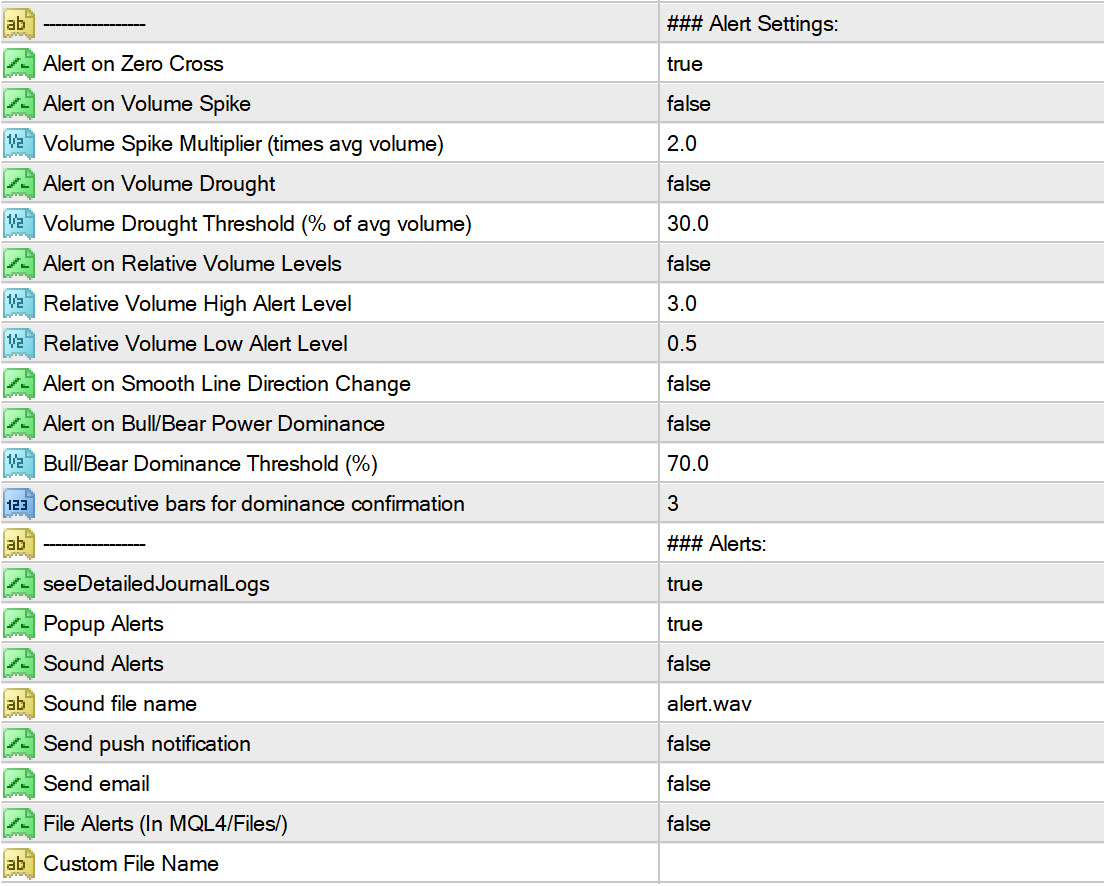
Alerts are designed to notify traders of significant volume and trend events across all display modes.
The alert system includes six distinct alert types that can be turned on/off:
Core Volume Alerts:
- Volume Spike Detection: Triggers when current volume exceeds a configurable multiple (default 2x) of the 200-period average, helping identify sudden increases in market activity
- Volume Drought Alerts: Notifies when volume drops below a specified percentage (default 30%) of the average, indicating periods of low market participation
- Relative Volume Thresholds: Provides alerts when relative volume crosses above high levels (default 3.0) or below low levels (default 0.5), offering early warning of unusual volume conditions
Technical Analysis Alerts:
- Zero Cross Alerts: Available in Oscillator and Delta modes, these alerts trigger when the indicator crosses above or below the zero line, signaling potential trend changes
- Smooth Line Direction Changes: Detects when the smooth line transitions between bullish and bearish states, providing trend reversal signals based on the selected volume mode
- Bull/Bear Power Dominance: Exclusive to Power mode, this alert monitors consecutive bars where bull or bear power exceeds a threshold percentage (default 70% for 3+ consecutive bars), indicating sustained directional pressure
Keep shiftBars 1, to ensure that alerts are based on confirmed bar data rather than fluctuating real-time values for ongoing bar 0.
If you have multiple indicators on same chart, use Prefix to separate the alerts:
Smooth Line Alerts don't work for Classic Mode, as that only has a single colored line. And doesn't track the up/down trend movements.
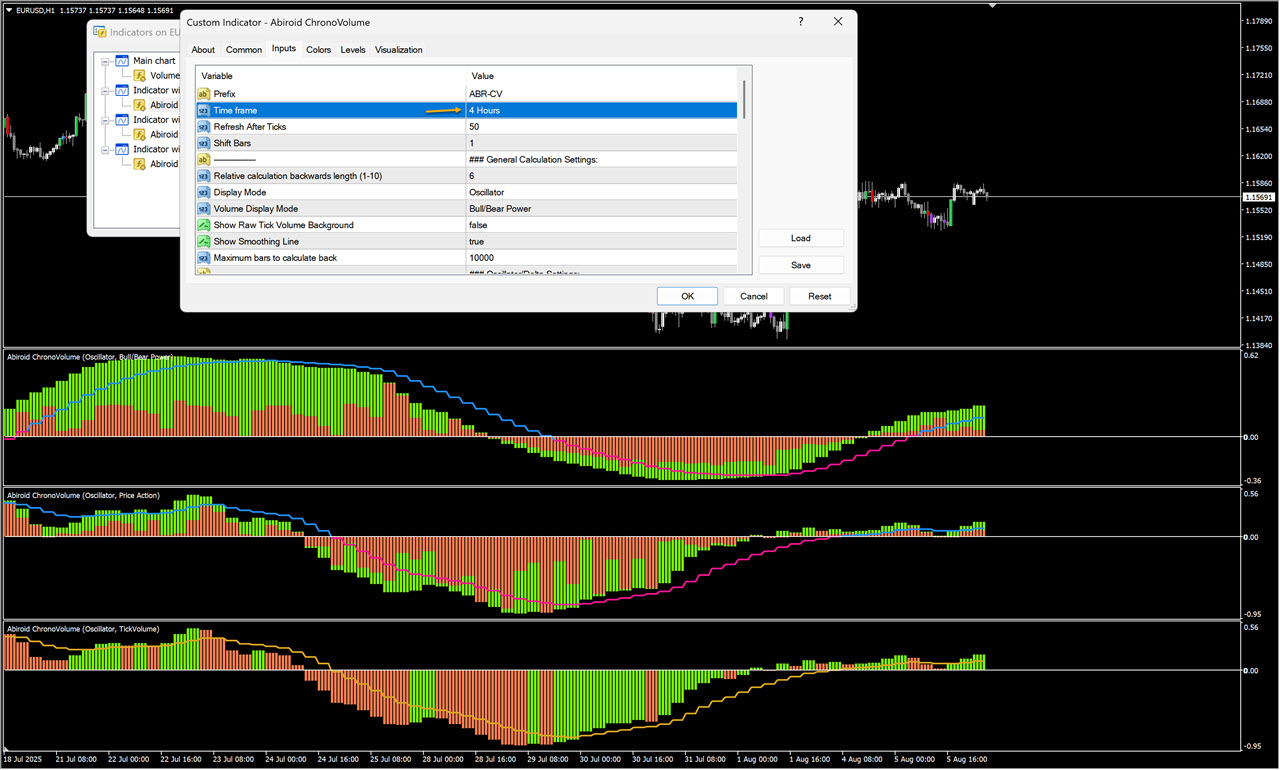
Higher Timeframes:
You can also select a higher timeframe from drop-down.
Here's EURUSD H1 chart using a higher H4 timeframe: