Dynamic Zigzag Levels
- Indicadores
-
Aleh Sasonka
 ✍️ Development and modification of experts, scripts, indicators MQL4, MQL5 to order https://www.mql5.com/en/job/new?prefered=sova75
 - Versión: 1.12
- Actualizado: 30 diciembre 2025
- Activaciones: 5
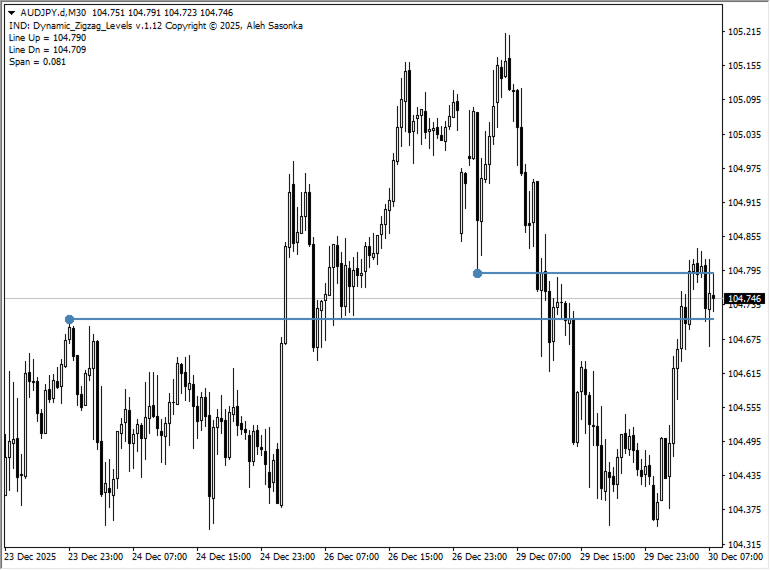
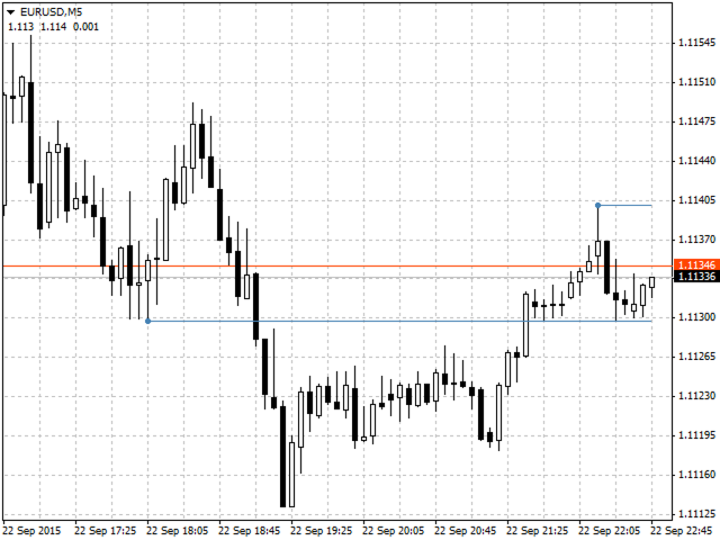
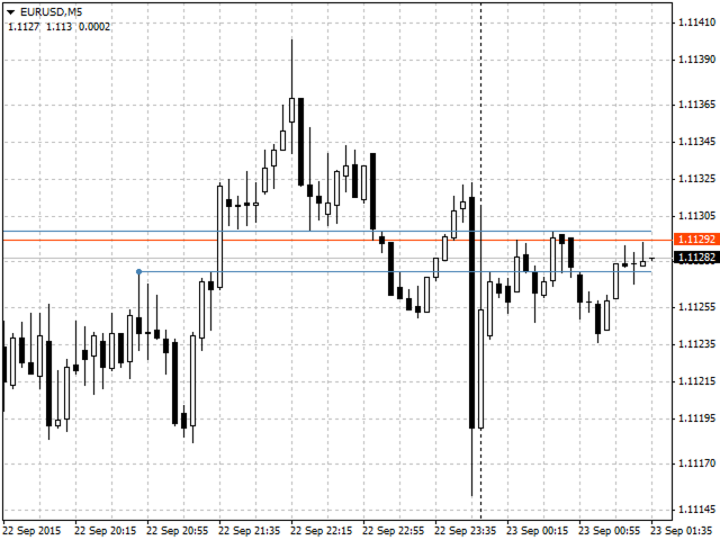
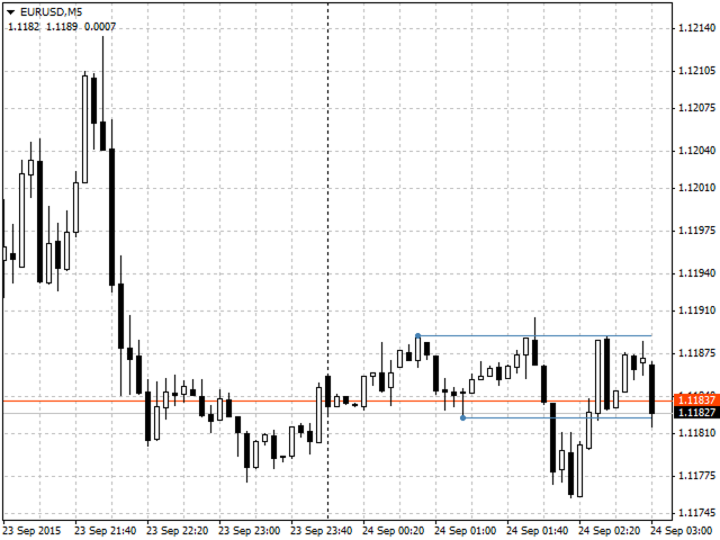
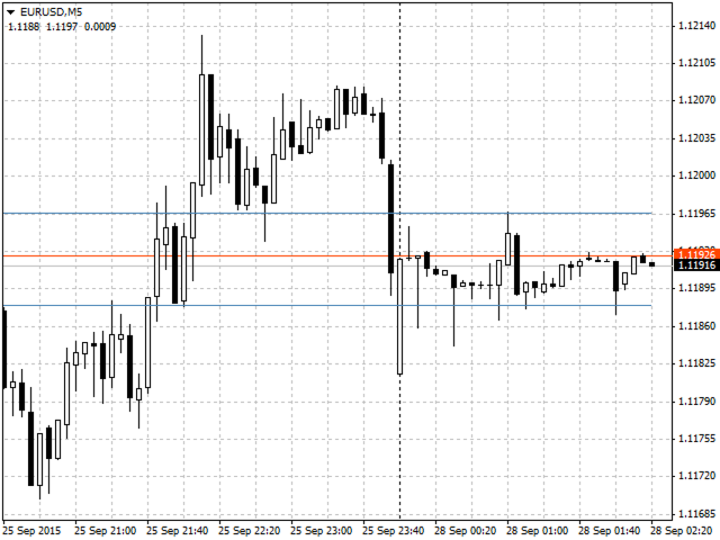
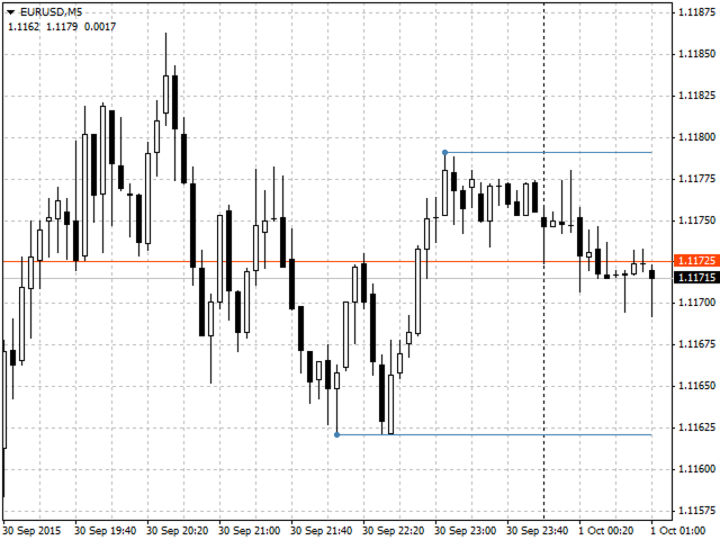
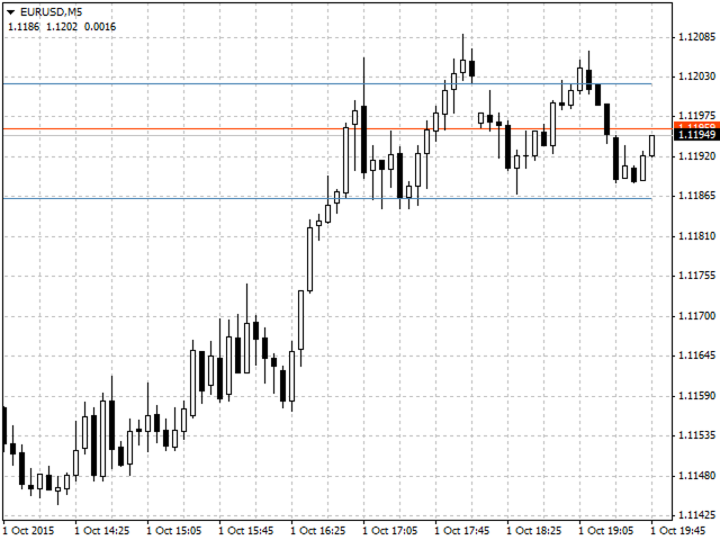
El indicador muestra dos niveles más cercanos en tiempo real. El que está por encima del precio BID actual es un nivel de resistencia. El que está por debajo del precio BID actual es un nivel de soporte.
Los niveles son calculados por el indicador estándar ZigZag.
Aplicación
El indicador puede utilizarse como asistente en la negociación manual para obtener datos sobre los niveles de soporte/resistencia más cercanos.
El indicador puede utilizarse en cualquier marco temporal.
Cuando un nivel mostrado se toca o se rompe, se activa una alerta sonora (especificada en los ajustes).
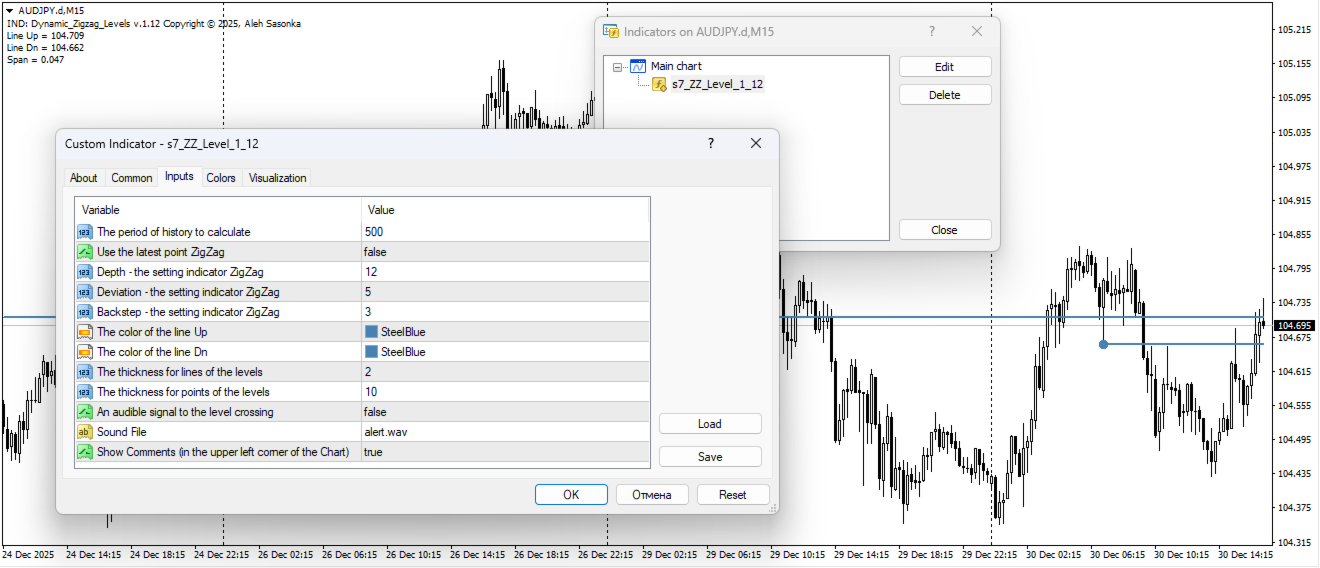
Ajustes
- Periodo históricoa calcular = 500 - periodo histórico, dentro del cual se buscan los niveles (en barras)
- Profundidad -el ajuste indicador zigzag= 12 - parámetro del indicador ZigZag
- Desviación -el ajuste del indicador zigzag= 5 - parámetro del indicador ZigZag
- Paso atrás - el indicador de ajuste zigzag = 3 - parámetro del indicador ZigZag
- El color de la líneaUp = SteelBlue - Color de la línea Up
- El color de lalínea Dn = SteelBlue - Dn color de la línea
- El grosor de las líneas de los niveles = 1
- Grosor de los puntos de los niveles = 5
- Una señal sonora para el paso a nivel= false - activar la alerta sonora del paso a nivel
- Archivo de sonido = "alert.wav" - seleccione un archivo de sonido para la alerta de audio
- Mostrar comentarios (en la esquina superior izquierda del gráfico) = true - comentarios en la esquina superior izquierda del gráfico (activar / desactivar)
This is an awesome indicator, one of a kind actually, I've been looking everywhere for it and now I found it. Thank you so much!