Dynamic Zigzag Levels
- Indikatoren
-
Aleh Sasonka
 ✍️ Development and modification of experts, scripts, indicators MQL4, MQL5 to order https://www.mql5.com/en/job/new?prefered=sova75
 - Version: 1.12
- Aktualisiert: 30 Dezember 2025
- Aktivierungen: 5
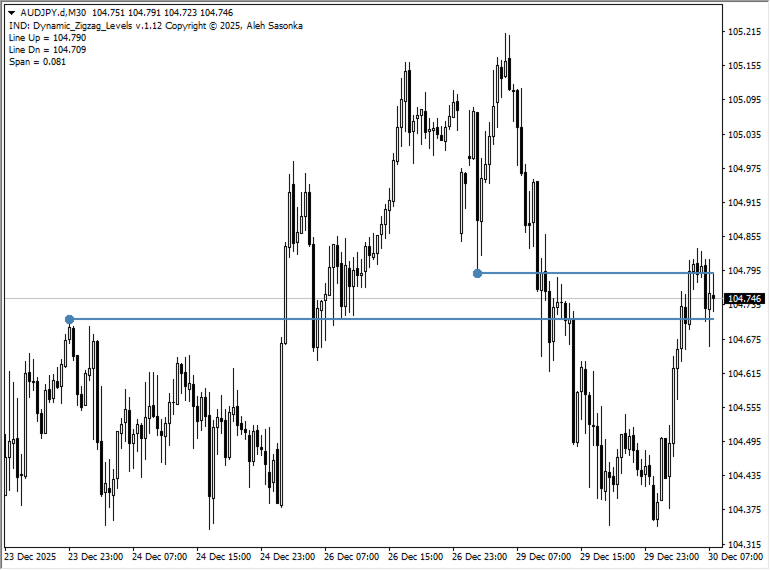
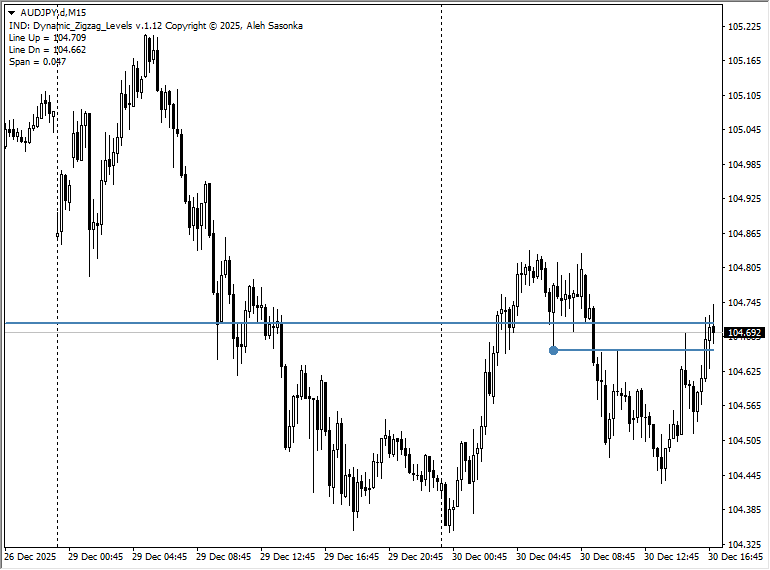
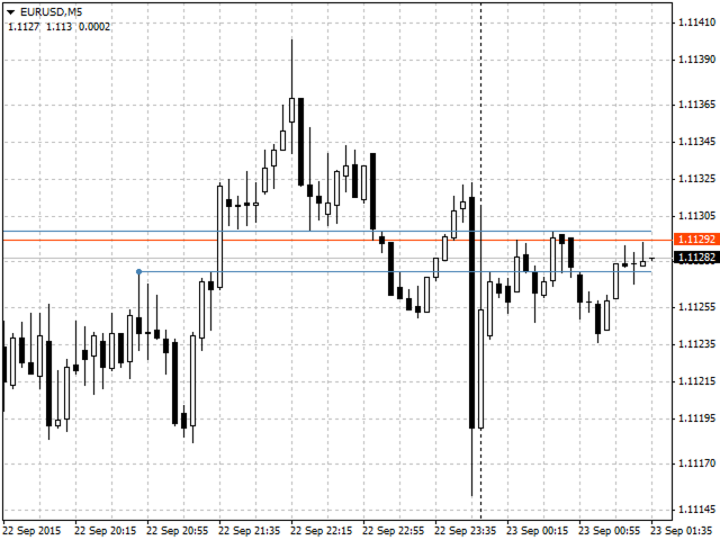
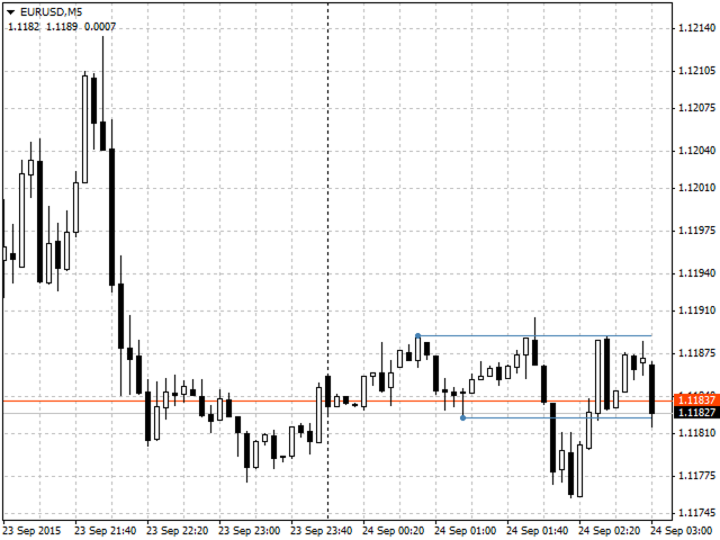
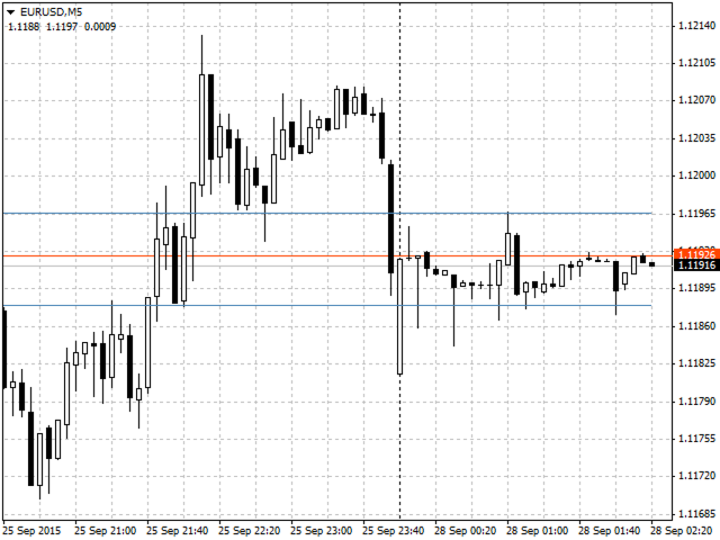
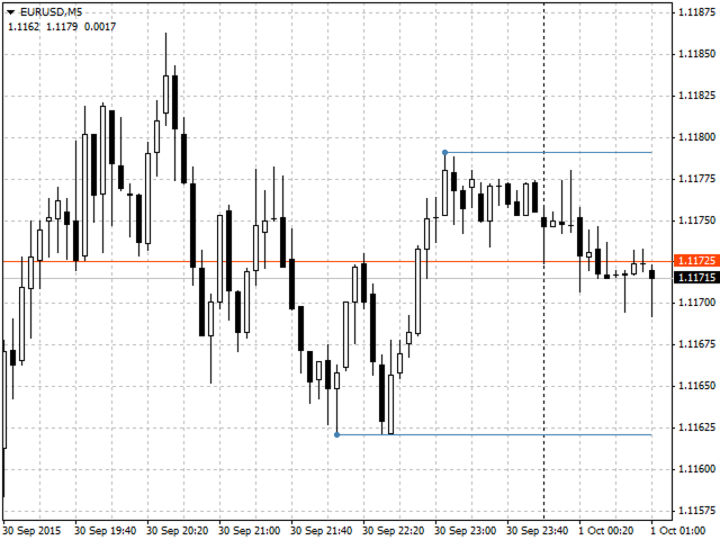
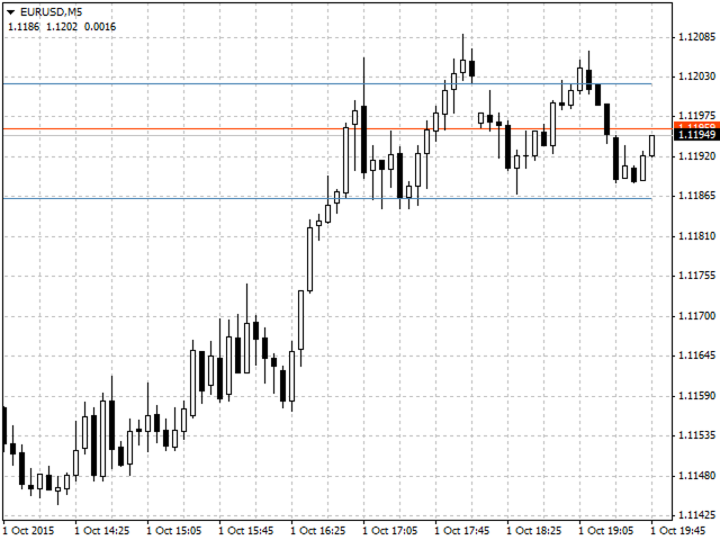
Der Indikator zeigt zwei nächstgelegene Niveaus in Echtzeit an. Das Niveau oberhalb des aktuellen BID-Kurses ist ein Widerstandsniveau. Das Niveau unterhalb des aktuellen BID-Kurses ist ein Unterstützungsniveau.
Die Niveaus werden mit dem Standard-ZigZag-Indikator berechnet.
Anwendung
Der Indikator kann als Hilfsmittel beim manuellen Handel verwendet werden, um Daten über die nächstgelegenen Unterstützungs-/Widerstandsniveaus zu erhalten.
Der Indikator kann auf jedem Zeitrahmen verwendet werden.
Wenn ein angezeigtes Niveau berührt oder durchbrochen wird, wird ein akustischer Alarm ausgelöst (in den Einstellungen festgelegt).
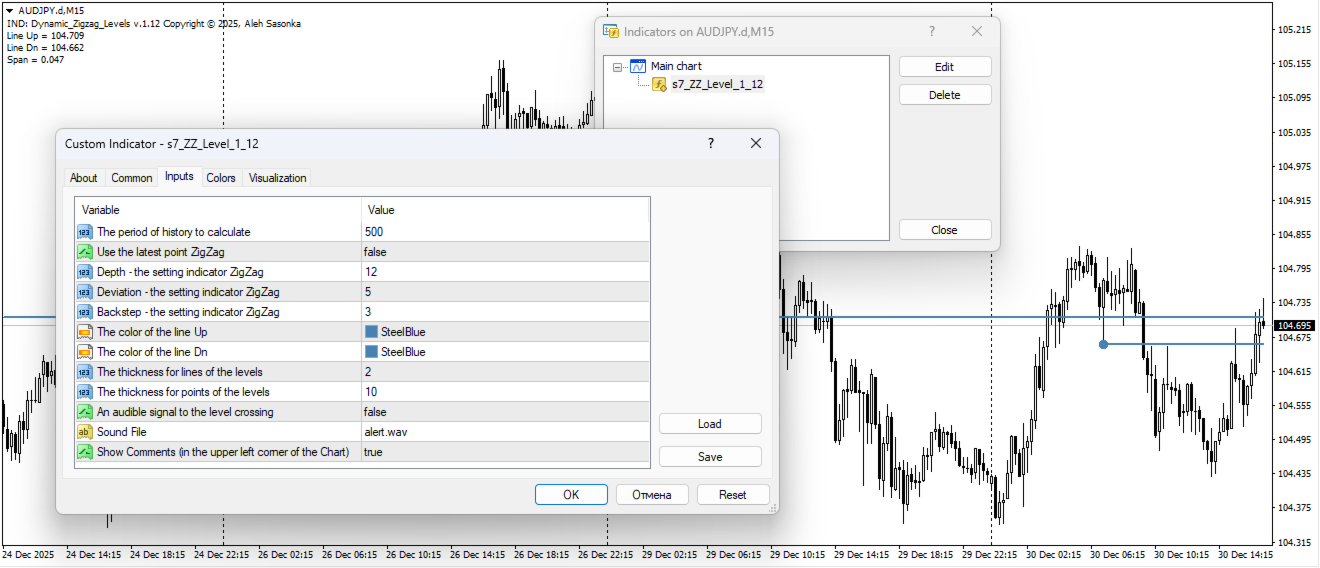
Einstellungen
- Die zu berechnende Zeitspanne = 500 - Zeitspanne, innerhalb derer die Niveaus (in Balken) gesucht werden
- Tiefe - die Einstellung Indikator Zickzack = 12 - Zickzack Indikator Parameter
- Abweichung - die Einstellung Indikator Zickzack = 5 - Zickzack Indikator Parameter
- Rückschritt - die Einstellung Indikator Zickzack = 3 - Zickzack Indikator Parameter
- Die Farbe der Linie Up = SteelBlue - Farbe der Linie Up
- Die Farbe der Linie Dn = SteelBlue - Farbe der Linie Dn
- Die Dicke für die Linien der Ebenen = 1
- Die Dicke für die Punkte der Ebenen = 5
- Ein akustisches Signal für den Bahnübergang = false - aktiviert den akustischen Alarm für den Bahnübergang
- Sound File = "alert.wav" - wählen Sie eine Sounddatei für die akustische Warnung
- Kommentare anzeigen (in der oberen linken Ecke des Diagramms) = true - Kommentare in der oberen linken Ecke des Diagramms (aktivieren / deaktivieren)
This is an awesome indicator, one of a kind actually, I've been looking everywhere for it and now I found it. Thank you so much!