PipTick Currency Index MT5
- Indicadores
-
Michal Jurnik
 "Talent is cheaper than table salt. What separates the talented individual from the successful one is a lot of hard work." - Stephen King. Those few words reflect myself very well. I am probably not the most talented developer in the world but I truly believe in hard work, professional attitude and
 - Versión: 1.1
- Actualizado: 3 diciembre 2021
- Activaciones: 5
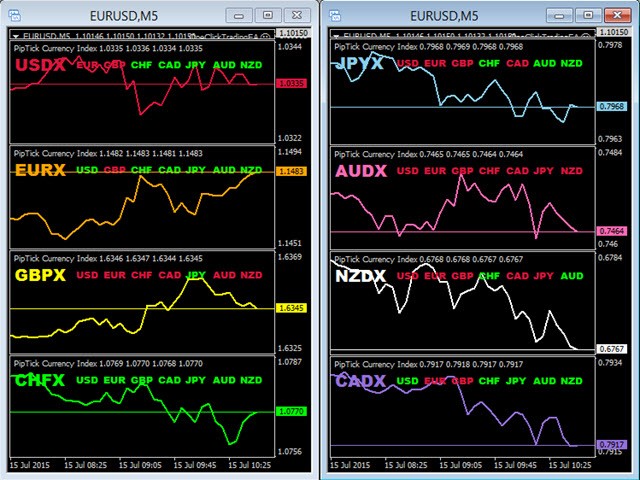
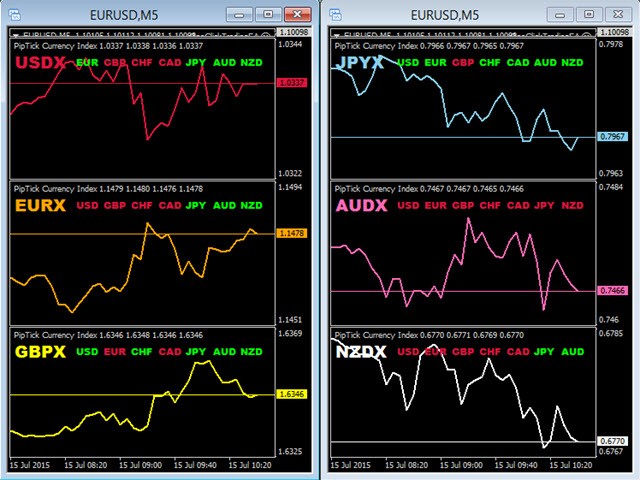
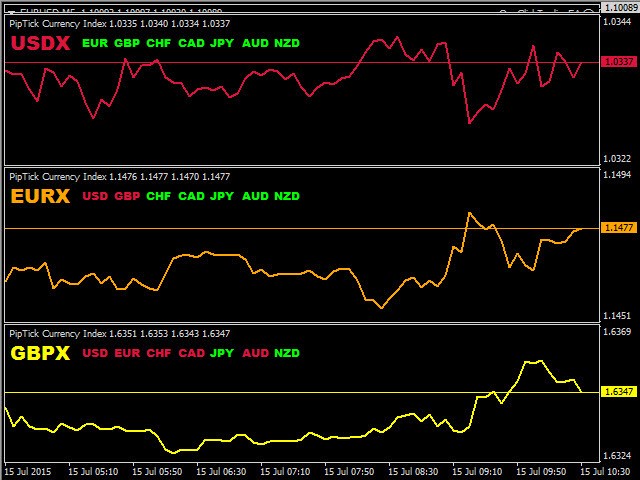
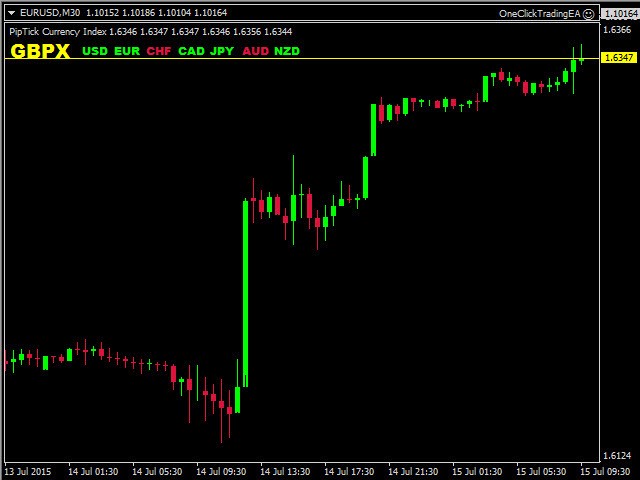
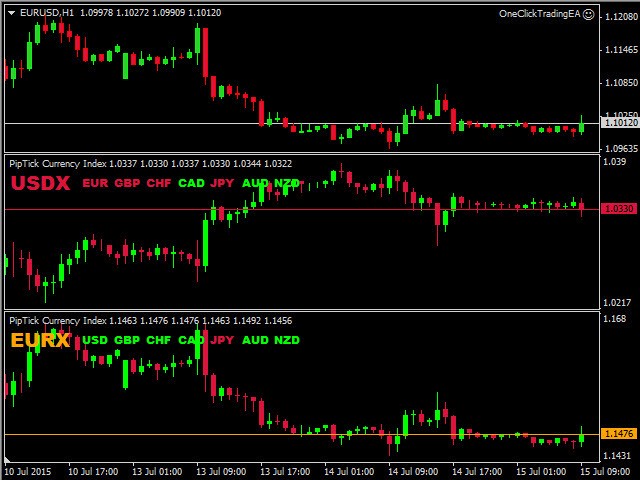
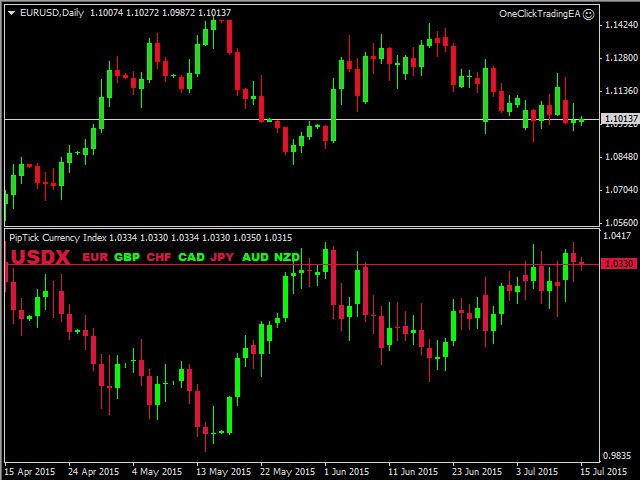
Elindicador Currency Index permite a los operadores visualizar cualquier índice de ocho divisas principales. Utiliza un cálculo especial que tiene en cuenta pares de divisas específicos y sus ponderaciones.
Las ponderaciones por defecto se basan en los resultados de la Encuesta Trienal de Bancos Centrales del BPI. Gracias a esta ventaja, el operador puede ver la verdadera fuerza y debilidad de cada divisa.
Nota: Si el indicador se utiliza en el Probador de Estrategias (versión demo), por favor tenga en cuenta que los datos de todos los pares de divisas deben ser descargados en el Centro de Historia antes de que comience la simulación (Cómo). Si el indicador se añade al gráfico de la forma habitual, no es necesario realizar ninguna descarga.
Índices de divisas
- USDX - Índice de divisas del dólar estadounidense.
- EURX - Índice de divisas del euro.
- GBPX - Índice de la libra esterlina.
- CHFX - Índice de divisas del franco suizo.
- CADX - Índice de divisas del dólar canadiense.
- JPYX - Índice de divisas del yen japonés.
- AUDX - Índice de divisas del dólar australiano.
- NZDX - Índice de divisas del dólar neozelandés.
Características principales
- El indicador muestra el índice de ocho divisas principales (USD, EUR, GBP, CHF, JPY, CAD, AUD, NZD).
- Una simple comparación de la fortaleza y debilidad de una divisa.
- Funciona en todos los marcos temporales (M1, M5, M15, M30, H1, H4, D1, W1, MN).
- El indicador no repinta.
- Listo para backtesting.
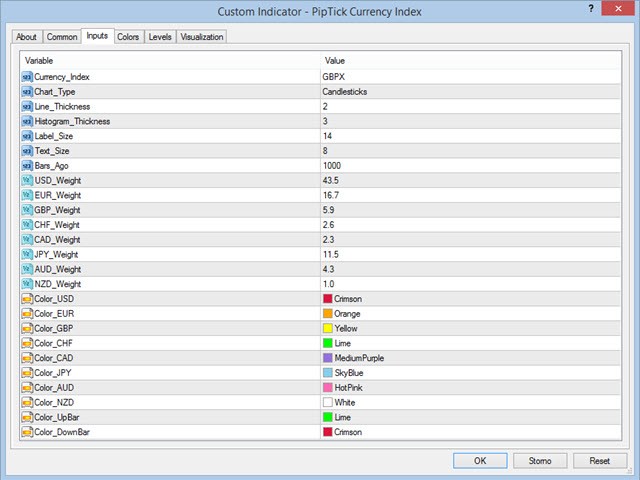
- Parámetros personalizables (colores, grosor de línea, pesos).
- Cálculo de alta velocidad.
- El indicador funciona también con prefijos y sufijos de símbolos (EURUSD.m, EURUSD-pro...).
- Disponible para MT4 y MT5.


Worthless. Doesn't work and no response from seller. Save your money