RMI Indicator
- Indicadores
- Versión: 1.0
- Activaciones: 5
La estrategia subyacente de este indicador se basa en identificar el impulso en el mercado e intentar captar la dirección de la tendencia a través de las transiciones entre momentos alcistas y bajistas. La utilización de bandas alrededor de la RWMA permite identificar posibles situaciones de sobrecompra y sobreventa en el mercado.
1. Cálculo del Range Momentum Index (RMI):
- El RMI se basa en una combinación del Relative Strength Index (RSI) y el Money Flow Index (MFI), ambos indicadores de momentum.
- En primer lugar, se calculan los cambios en el precio de cierre. A continuación, se calculan por separado los movimientos positivos y negativos y se suavizan mediante una media móvil recursiva (RMA).
- Este suavizado es un método para reducir el ruido de los datos.
- Posteriormente, se calculan el RSI y el IMF y se promedian para obtener el RMI.
2. definición de momentos alcistas y bajistas:
- Se definen las condiciones para identificar los momentos alcistas y bajistas. Estas condiciones se basan en la relación entre el RMI, los umbrales predefinidos (pmom y nmom) y la variación de la Media Móvil Exponencial (EMA) del precio de cierre.
3. Cálculo de la banda y de las medias móviles de rango (RWMA):
- Se calcula una banda personalizada basada en el Average True Range (ATR), que se define en torno a la RWMA. Esta banda sirve para definir el rango alrededor de la RWMA.
- El RWMA se calcula dividiendo el rango (High - Low) de la vela actual por una Media Móvil ponderada (MA) de los precios de cierre. A continuación, se muestra alrededor de la banda.
3. trazado y visualización:
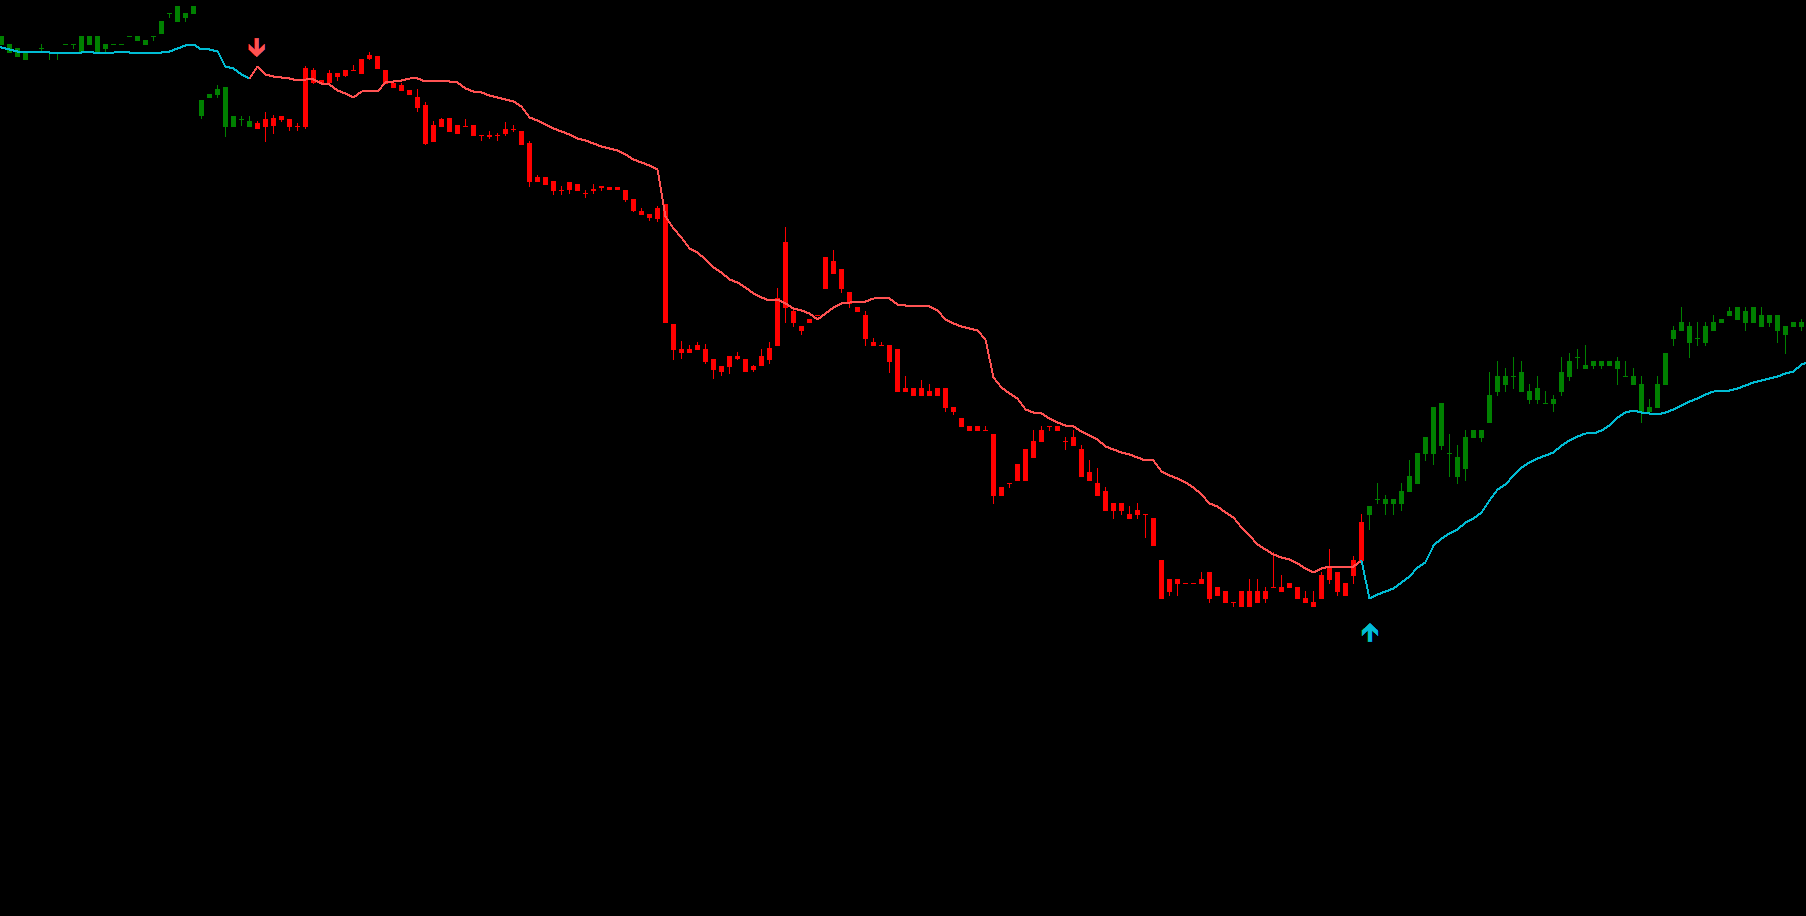
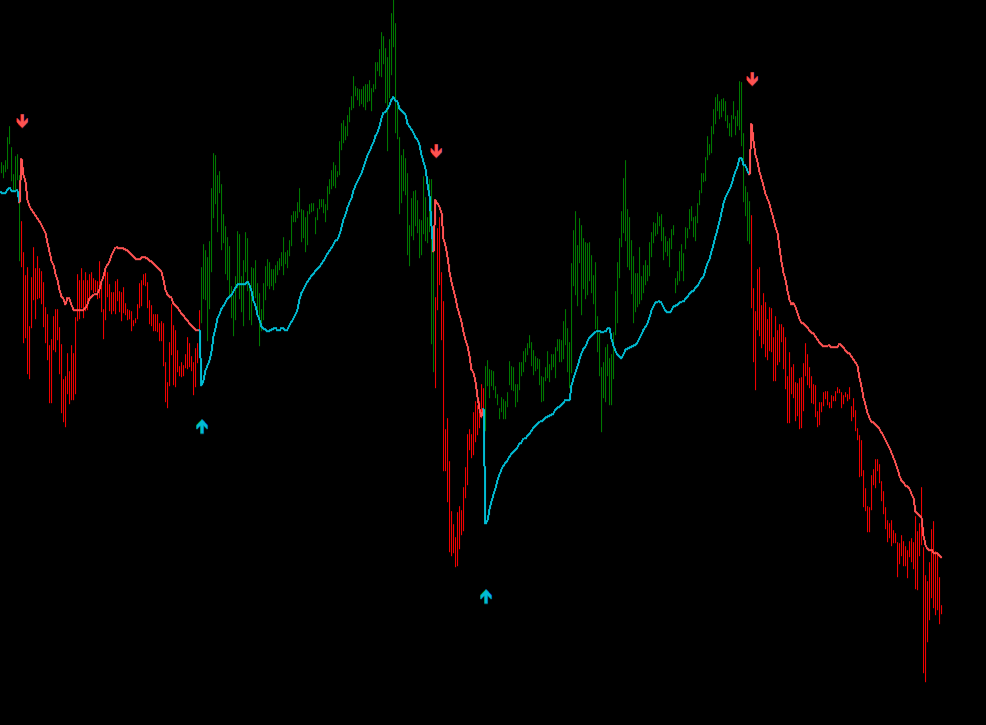
- La RWMA se traza y colorea según los momentos alcistas y bajistas previamente definidos.
- Además, se crean rellenos para marcar el rango alrededor de la RWMA.
- Las velas se colorean en función de los momentos alcistas y bajistas.
4. señales de trading:
- Las señales de trading se generan cuando cambia el signo de la RWMA. Se genera una señal de "COMPRA" cuando el signo cambia de negativo a positivo, y viceversa para una señal de "VENTA".
Well not so bad, but you need to think about upgrading your indicator because false signals and on top of that kindly add signals checklist for someone to follow before taking a trade.