Indicadores técnicos de pago para MetaTrader 4 - 18

Visión general Este es un indicador muy simple que muestra los valores de fuerza relativa de las divisas en el gráfico y marco de tiempo actuales. La fuerza sólo se calcula para las divisas: AUD - Dólar Australiano CAD - Dólar canadiense CHF - Franco Suizo EUR - Euro de la Unión Europea GBP - Libra esterlina JPY - Yen japonés NZD - Dólar neozelandés USD - Dólar estadounidense
Estas son las principales divisas del mundo. Existen 28 combinaciones distintas de pares de divisas principales. Otros va

Este indicador se basa en el indicador clásico CCI (Commodity Channel Index) y será útil para aquellos que aman y saben cómo utilizar no una representación visual, sino digital del indicador. All TimeFrames CCI MT4 indicador muestra los valores de cada marco de tiempo. Usted será capaz de cambiar los principales parámetros de entrada para cada CCI para cada TF. Ejemplo para M1: sTF1_____ = "M1"; Periodo1 = 13; Precio1 = PRECIO_CIERRE.

Este indicador se basa en el indicador STOCHASTIC clásico y será útil para aquellos que aman y saben cómo utilizar no una representación visual, sino digital del indicador. Todos los TimeFrames Estocástico MT4 indicador muestra los valores de cada marco de tiempo (M1, M5, M15, M30, H1, H4, D1, W1 y MN1). Podrá cambiar los principales parámetros de entrada para cada Estocástico de cada TF. Ejemplo para M1: sTF1_____ = "M1"; K_Period1 = 5; D_Period1 = 3; S_Period1 = 3; Método1 = MODE_EMA.

Indicador ForexTrendMT4: Una herramienta fiable para el seguimiento del mercado El indicador ForexTrendMT4 ofrece un seguimiento fiable de la tendencia del mercado, filtrando las fluctuaciones repentinas y el ruido del mercado. Esta herramienta ayuda a identificar tendencias y señala puntos de entrada favorables en el mercado mediante flechas. Es adecuado tanto para scalping en plazos más cortos como para estrategias de negociación a largo plazo. Basado en los principios del análisis técnico, F

Este indicador se basa en el indicador clásico Parabolic SAR y será útil para aquellos que aman y saben cómo utilizar no una representación visual, sino digital del indicador. Todos los plazos PSAR MT5 indicador muestra los valores de cada plazo (M1, M5, M15, M30, H1, H4, D1, W1 y MN1). Podrá cambiar los principales parámetros de entrada para cada Estocástico de cada TF. Ejemplo para M1: sTF1 = M1 pPaso1 = 0.02 pMax1 = 0.2
Zig Zag Swing Detector es una herramienta de indicador parlante, que le permite rastrear nuevos máximos y mínimos usando patrones Zig Zag y le permite reaccionar a nuevos máximos y mínimos. Por ejemplo, para una tendencia alcista, cada vez que se detecta un máximo más alto, la fuerza de la tendencia aumenta. La tendencia finaliza con un mínimo más bajo que el anterior. ¡Sea notificado por Alertas, Discurso y Notificaciones y sea alertado sobre nuevos máximos/mínimos! También puede configurar con

El indicador de un Trader Profesional es un indicador de flecha para predecir la dirección del movimiento del precio. He estado trabajando en este indicador desde 2014.
Puede utilizar este indicador como su indicador principal, utilizar sus señales de entrada y utilizarlo como su único indicador para encontrar puntos de entrada.
Sobre el producto: TF recomendado [H4-D1-W1] . El indicador predice la dirección de la siguiente vela. Se adapta a una gran variedad de instrumentos; Flexibilidad en l

El indicador le muestra señales de compra/venta y no repinta. Funciona bien con casi todos los pares, mientras que los mejores son GBPUSD, XAUUSD y EURUSD. El producto funciona mejor en H1 y H4. Puede cambiar los parámetros en la pestaña de entradas para obtener las mejores señales y los mejores resultados comerciales en cada par. Puede activar/desactivar las alertas cuando aparezca la señal. El indicador es fácil de usar.
Parámetros barstrip & Sensitive: cantidad de barras para procesar los pr

El indicador "Two Moving Average Crossover" para MetaTrader 4 (MT4 es una herramienta de análisis técnico que muestra dos medias móviles y notifica cuando las medias móviles se cruzan entre sí. El indicador calcula y traza dos medias móviles, una de las cuales es más rápida y la otra más lenta. Cuando la media móvil más rápida se cruza por encima de la media móvil más lenta, se considera una señal alcista, que indica un posible cambio de tendencia o el inicio de una nueva tendencia alcista. Por

Cruce de precio de mercado y media móvil con todo tipo de alertas y funciones para mejorar la visualización en el gráfico.
Características Cruce del precio de mercado y la media móvil (MA) en la barra actual o al cierre de la última barra; Puede evitar las mismas señales seguidas, por lo que puede permitir sólo una señal de compra seguida de una señal de venta y viceversa; MA se puede establecer para cualquiera de los siguientes métodos de promediación: Media Móvil Simple (SMA), Media Móvil Exp
El indicador le muestra el tiempo restante hasta la finalización de la vela actual de cualquier marco de tiempo que haya elegido, mostrando la estructura (ver detalles). Minuto: segundo. El indicador tiene 3 parámetros: TF - este parámetro le ayudará a elegir el marco de tiempo que desee, por ejemplo, si desea mostrar el tiempo restante para M30, establezca TF=30. Si desea mostrar el tiempo restante del período actual que está viendo en el gráfico, establezca TF=0 (como por defecto). Local - est

Descripción Muestra las velas Heikin-Ashi (a menudo mal escrito Heiken-Ashi) en el gráfico y puede alertar cuando las velas cambian de color. La alerta es útil tanto para entrar como para salir. Se puede establecer el número de velas del nuevo color antes de que se active una alerta. La alerta se puede controlar de forma interactiva, directamente desde el gráfico. También incluye indicadores adicionales del diferencial actual y de los precios de compra/venta en texto grande, codificados por colo

Pivots es un indicador que muestra los pivotes para los marcos de tiempo relevantes. Además de los pivotes, el indicador también puede mostrar la línea abierta daly, los niveles de resistencia y soporte, los niveles ADR Fibonacci y el orden de los pivotes. Pivots incluye un algoritmo inteligente para eliminar las velas dominicales, pero sólo si su broker se las proporciona. Los pivotes son niveles de precios significativos que pueden servir como soporte, resistencia o niveles de ruptura Configur
Descripción El producto dibuja líneas en el gráfico para mostrar el soporte diario, la resistencia y el pivote, además del pivote semanal y mensual. Se puede establecer una alerta cuando el precio alcanza una de las líneas o el precio cierra por encima/por debajo de ella. Esto puede ser útil tanto para entrar como para salir. Las alertas pueden controlarse de forma interactiva directamente desde el gráfico.
El producto también incluye indicadores adicionales de Average Daily Range (o Average Tru

Lo más importante en mi sistema de fuerzas, es la variación y el cambio de estas fuerzas. Es la clave de todo el sistema, y desde este punto, mi segundo indicador llamado FUERZAS-VARIACIÓN aparece importante. El indicador se representa en una ventana separada en forma de histograma verde y curva roja . El parámetro NPIuPeriod representa el número de barras en las que calculamos la variación de las fuerzas de los compradores. El parámetro NPIdPeriod representa el número de barras en las que calcu
Este panel será muy útil para la investigación de un sistema de estrategia de negociación. El MA-ControlPanel está basado en el popular indicador Moving Averages. Podrá cambiar los parámetros del indicador: Periodo , Desplazamiento , Método y Aplicar Precio haciendo clic en los botones Arriba ( /\ ) y Abajo ( \/ ). Puede elegir sus colores favoritos utilizando los parámetros BackGround, maColor1 y maColor2. A veces, al abrir un par de divisas o un marco temporal poco utilizado, el indicador no m
Este es un Panel de Control para los principales indicadores: ATR, CCI, RSI, RVI, Estocástico y MACD. Tiene la posibilidad de cambiar cualquier parámetro de entrada para cada indicador. Por ejemplo: ATR atrPeriod = 13; atrColor = Amarillo; CCI cciPeriod = 13; cciPrice = PRICE_CLOSE; cciColor = Aqua; Este indicador será útil para aquellos que les gusta usar muchos indicadores antes de cualquier toma de decisiones.
Este es un Panel de Control para los principales indicadores gráficos: Medias Móviles, Bandas de Bollinger, Envolventes, PSAR y Fractales. Tiene la posibilidad de cambiar cualquier parámetro de entrada para cada indicador. Por ejemplo:
MA maPeriod = 13; ma_method = MODE_SMA; ma_precio = PRICE_CLOSE; maColor = Amarillo; Bandas bbPeriod = 20; bb_dev = 2; bb_Precio = PRECIO_CIERRE; bbColor = Aqua; Este indicador será útil para aquellos que les gusta usar muchos indicadores antes de cualquier toma d

El sistema de trading manual [GRAFF] III se basa en múltiples indicadores de MetaTrader (MT4). En conjunto, el PACK completo de indicadores GRAFF III constituye una herramienta de trading avanzada. El sistema consta de más de 20 indicadores personalizados diferentes que han sido cuidadosamente seleccionados y probados a largo plazo para producir señales de trading fuertes y eficientes. Los indicadores particulares se basan en diferentes fórmulas matemáticas, por lo que todo el sistema está calib
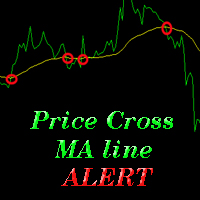
El indicador le avisa cuando el precio de mercado cruza la línea MA. Puede elegir cualquier línea MA para utilizar a través de la pestaña de entrada de parámetros (véase la captura de pantalla a continuación). Parámetros (los mismos que los cuatro parámetros que tiene que elegir cuando añade una línea MA en un gráfico): ma_period ma_desplazamiento ma_method (0=Simple; 1=Exponencial...) ma_apply (0=Cierre; 1=Apertura; 2=Alto; 3=Bajo...) Cuando el precio cruce la línea MA, le alertará con un mensa
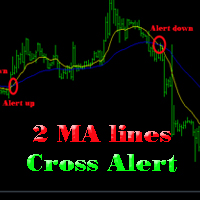
El indicador le ayuda a hacer alerta cuando dos líneas MA cruzan acción Usted puede elegir todos los parámetros para dos de estas líneas MA a utilizar a través de la pestaña de entrada de parámetros (ver captura de pantalla a continuación).
Parámetros Igual que los 4 parámetros que tiene que elegir cuando añade una línea MA al gráfico. MA rápida: ma1_period ma1_desplazamiento ma1_method (0=Simple; 1=Exponencial...) ma1_apply (0=Cerrar; 1=Abrir; 2=Alto; 3=Bajo...) MA lento: ma2_period ma2_despla
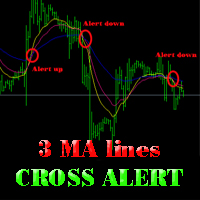
El indicador le avisa cuando 3 líneas MA se cruzan hacia ARRIBA/ABAJO (vea la captura de pantalla a continuación). Puede elegir todos los parámetros para estas 3 líneas MA a utilizar a través de la pestaña de entrada de parámetros.
Parámetros Igual que los 4 parámetros que tiene que elegir cuando añade una línea MA en el gráfico. MA rápida: ma1_period ma1_desplazamiento ma1_method (0=Simple; 1=Exponencial...) ma1_apply (0=Cierre; 1=Apertura; 2=Alto; 3=Bajo...) MA medio: ma2_period ma2_desplazam
Este indicador será muy útil para la investigación de un sistema de estrategia comercial. El RSI-ControlPanel está basado en el popular indicador Relative Strength Index. Podrá cambiar los parámetros del indicador Period , Apply Price, HighLevel y LowLevel haciendo clic en los botones Up ( /\ ) y Down ( \/ ). A veces, cuando abra un par de divisas o un marco temporal poco utilizado, el indicador no mostrará su valor. En este caso debe utilizar el botón "0 ".

"Make it Horizontal puede convertir cualquier linea con ángulo a horizontal. Solo necesitas seleccionar primero la linea que quieras hacer horizontal y después presionar la tecla "H" y listo! tus lineas estarán perfectamente horizontales en un instante! Esta herramienta debe ser arrastrada e incluida en tus gráficos como un indicador, no tiene parámetros de entrada así que sólo arrástrala y listo! Cree esta herramienta porque el MT4 no tiene ninguna funcionalidad incluida que haga esto. Cuantas
Este indicador será muy útil para la investigación de un sistema de estrategia comercial. El panel de control MACD está basado en el muy popular indicador Relative Strength Index. Podrá cambiar los parámetros del indicador FastPeriod , SlowPeriod , SignalPeriod y Apply Price haciendo clic en los botones Up ( /\ ) y Down ( \/ ). A veces, al abrir un par de divisas o un marco temporal poco utilizado, el indicador no mostrará su valor. En este caso debe utilizar el botón "0 ".
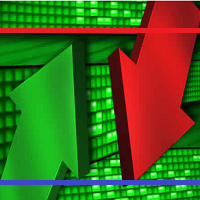
Waddah Attar Indicador Binario de Soporte y Resistencia. Este indicador dibuja en el gráfico niveles de Soporte y Resistencia muy potentes. Calcula estos niveles basados en los valores binarios del precio. Los niveles más fuertes se dibujan en color azul y en color rojo con mayor anchura. Usted puede cambiar el color y el ancho de estos niveles desde la ventana de propiedades del indicador. Este indicador funciona sólo en símbolos de cinco dígitos.
XP Media Móvil - Su Todo-en-Uno Trading Powerhouse Domine los mercados con XP Moving Average , el indicador de medias móviles definitivo para MetaTrader 4. Tanto si está haciendo scalping , swing trading o invirtiendo a largo plazo , esta versátil herramienta combina 9 medias móviles avanzadas en una, mejorada con un moderno panel gráfico y alertas en tiempo real . Con conocimientos impulsados por IA próximamente , XP Moving Average es su clave para operaciones más inteligentes y rentables . ¿P

Conocer la fuerza y la debilidad de cada divisa es vital para todo operador de Forex. Nuestro indicador Currency Strength Meter mide la fortaleza de ocho divisas principales (USD, EUR, GBP, CHF, JPY, CAD, AUD, NZD) mediante el indicador Relative Strength Index, también conocido como RSI. El indicador Currency Strength Meter le muestra, de forma sencilla y rápida, cuándo una divisa está sobrevendida, sobrecomprada o en "zona normal". De este modo, podrá identificar qué divisa es la más fuerte y

Este indicador se basa en el indicador clásico RSI (Relative Strangth Index) y será útil para aquellos que aman y saben cómo utilizar no una representación visual, sino digital del indicador. Todos los plazos RSI MT4 indicador muestra los valores de cada marco de tiempo. Usted será capaz de cambiar los principales parámetros de entrada para cada RSI para cada TF. Ejemplo para M1: sTF1_____ = "M1"; Periodo1 = 14; Precio1 = PRECIO_CIERRE.
Este indicador muestra el movimiento lateral del precio cuando la línea del indicador corresponde a cero y la tendencia alcista/bajista cuando la línea del indicador es superior/inferior y paralela a la línea cero. Por supuesto, el momento en que la línea del indicador cruza la línea cero es el mejor momento para entrar en el mercado. Este indicador no tiene parámetros de entrada... Por lo tanto, los resultados serán siempre los mismos para cada marco de tiempo y pares de divisas.

El indicador ATR es una herramienta útil para medir el rango de las barras. Ayuda a evaluar de forma rápida y sencilla la dispersión (rango) actual del ATR, lo que resulta especialmente útil para los operadores de VSA. El indicador para clasificar el rango de las barras (velas) utiliza la media móvil y sus múltiplos. En consecuencia, la zona en la que se encuentra el volumen (en relación con la media móvil) se etiqueta como ultrabaja, baja, media, alta, muy alta o ultraalta. Nuestro indicador A

El indicador de volumen es una herramienta excelente para medir el volumen de los ticks o la actividad del volumen real. Ayuda de forma rápida y sencilla a los operadores a evaluar el tamaño actual del volumen. El indicador para la clasificación del tamaño del volumen utiliza la media móvil y sus múltiplos. En consecuencia, la zona en la que se encuentra el volumen (en relación con la media móvil) se etiqueta como ultrabaja, baja, media, alta, muy alta o ultraalta. Este indicador puede calcular
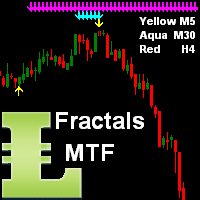
Este indicador muestra flechas como Soporte y Resistencia del marco de tiempo actual (flechas Amarillas) y 2 TF superiores a su elección (TF2 = flechas Aqua, TF3 = flechas Magenta y TF4 = flechas Azules). Cuando las 3 flechas de color aparecen en el mismo lugar, entonces este es un buen momento para entrar en una nueva posición.
Entradas NumOfBars - número de Barras donde el indicador mostrará todas las flechas; DistanceArrow - puede aumentar la distancia (verticalmente) entre flechas especialm
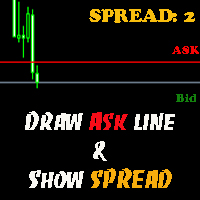
El indicador le ayuda a dibujar la línea Ask en el gráfico actual y mostrar el spread actual. Por lo tanto, le ayuda a hacer scalping comercio más fácil. Vea el vídeo a continuación. Muestra cómo funciona. Parámetros line_color - Color de la línea Ask
text_size - tamaño del texto del valor del spread text_color - color del valor de propagación ¡Gracias! Si usted tiene alguna pregunta, por favor póngase en contacto conmigo a través de Skype: cuongph149, o por correo electrónico: hungcuongkhmt51@g

Cualquier gráfico tiene patrones de consolidación que también se denominan patrones de acumulación. Se trata de secciones en las que el mercado ha permanecido en el mismo nivel de precios durante un periodo de tiempo significativo, por lo que estaba acumulando posiciones. Después de dicha acumulación, las posiciones se distribuyen, y el mercado pasa de plano a tendencia. El indicador Niveles de Consolidación es una herramienta profesional que identifica estas secciones y construye niveles de acu
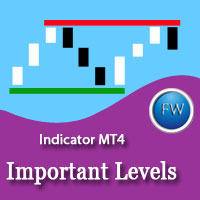
La regla principal del trading rentable es abrir operaciones en la dirección de una tendencia. Puede definir la tendencia actual utilizando el análisis fractal. Niveles importantes ResSup muestra niveles de precios importantes en el gráfico. La ruptura de esos niveles muestra la dirección del precio. El panel de datos le permite seguir las tendencias actuales en todos los marcos temporales. Los valores de los niveles importantes del marco temporal actual se muestran en los comentarios. El indica

El indicador calcula los niveles por rango diario ATR utilizando las ecuaciones: 1AR = Open + ATR -1AS = Abierto - ATR AR 1/2 = Abierto + (ATR / 2) AS -1/2 = Abierto - (ATR / 2) AR 1/4 = Abierto + (ATR / 4) AS -1/4 = Abierto - (ATR / 4) AR 3/4 = Abierto + ((ATR*3) / 4) AS -3/4 = Abierto - ((ATR*3) / 4) AR 2 = Abierto + (ATR*2) AS -2 = Abierto - (ATR*2) Parámetros Periodo ATR - Periodo ATR
Tiempo de cambio - cambio por tiempo para Open Color apertura del día - Color de la línea de apertura
Color

El indicador hace niveles según los máximos y mínimos locales de una semana, un mes o un año. Parámetros: Número de semana - número de semanas para la visualización de las líneas Color del nivel de la semana - Color de la línea de la semana Número de mes - Número de meses para las líneas Nivel de color del mes - Color de la línea del mes Número de año - Número de años para las líneas Color de nivel de año - Color de línea de año Ancho línea - Ancho de las líneas Estilo línea - Estilo de las líne
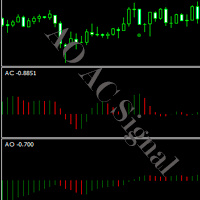
El indicador muestra señales de diferentes indicadores (que pueden seleccionarse en los parámetros) en un gráfico cuando se cruza el nivel cero. AO, AC o AO+AC si las señales de dos indicadores coinciden. El indicador muestra un mensaje de Alerta (ventana emergente) cuando aparece una señal. Parámetros: Indicadores - Selección del indicador AO, AC, AO+AC. Barras - Número de barras en el histórico para la visualización de las señales. Alerta - Ventana emergente en caso de señal.
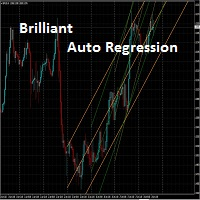
El indicador dibuja automáticamente hasta cinco canales de regresión diferentes. El producto dibuja los canales de los períodos principales anteriores. Por ejemplo Gráfico del indicador Período de trazado
M1
D1
M5 D1
M15 D1 M30 D1 H1 D1 H4 W1 Se actualiza al principio del periodo principal (ej.: D1 o W1). Los periodos están en el dominio del periodo mayor. Por ejemplo : si el indicador se coloca en un gráfico H1, el período de 1 significa 1 día en el gráfico.
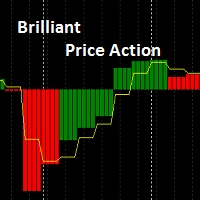
Indicador Brilliant Price Action Brilliant Price Action Indicator es un indicador líder que no se repinta . Puede ser calculado en un marco de tiempo y representado en otro marco de tiempo. Puede ser utilizado en la identificación de la tendencia de los marcos de tiempo más altos O para la entrada en los marcos de tiempo más bajos. Los modos de media móvil son: 0 = Media móvil simple. 1 = Media móvil exponencial. 2 = Media móvil suavizada. 3 = Media móvil lineal ponderada.

N Gestión monetaria Con este asesor, no perderá su drawdown diario. Muestra el apalancamiento real de la cuenta. Muestra todo el historial de entradas en el gráfico. Calcula la gestión monetaria (Gestión del Riesgo para minimizar el drawdown). Ajustes ShowEntryHistory: muestra todo el histórico de entradas. ShowOpenArrow: muestra el precio de apertura de la orden. ShowAccountInfo: muestra el texto de la cuenta. calcLotPerEquity (ej: 50) con una equidad de 100$ >> 100/50 = 2 >> 2x0.01 Lote = 0.02
X-Líneas 2.0 Pro Quiero presentar a su atención una nueva versión completamente actualizada y ampliada de indicador X-Lines. Versión 2.0 Pro tiene muchas nuevas características y puede hacer su análisis más productivo.
Por favor, lea las instrucciones completas aquí .
Por favor, antes de comprar pruebe la versión gratuita.
Versión gratuita y limitada (sólo puede configurar una alerta): aquí
1) Configuraciones multi-tiempo y panel de control fácil de usar. Puede seleccionar y guardar dinámic
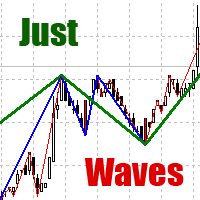
Entre los diversos métodos de análisis técnico del mercado Forex, el análisis de ondas solía ser el básico. De todos modos, cuando se trata del cambio de precios durante un período de tiempo, estamos tratando con ondas. De acuerdo con la teoría de Elliott, las ondas se forman de una manera fractal. Sobre el mismo principio el indicador MT4 "Just Waves" marca ondas de diferentes niveles (hasta 8) y crea líneas gráficas que indican los puntos de inicio y final de las ondas. "Just Waves" ofrece un
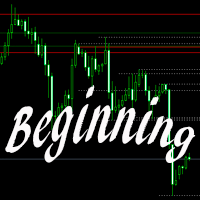
El indicador construye niveles desde principios de semana o de mes, o de acuerdo con los máximos y mínimos locales. Estos niveles sirven para detectar fuertes niveles de soporte y resistencia en un gráfico. La mayoría de los grandes operadores del mercado se guían especialmente por estos datos: apertura de la semana o apertura del mes. La ruptura de uno o varios máximos y la consolidación del precio en estos niveles sugieren que el mercado tiene la intención de crecer. La ruptura de Mínimos y la

VR MultiPrice Analysis es un indicador que permite medir el grado de solidez de un par de divisas. Pongamos como ejemplo el par EUR/USD. ¿Cómo determinar qué moneda en el momento actual es débil y cuál es fuerte? El modo más fácil y confiable consiste en hacer una comparación de la moneda EUR con otras monedas, excluyendo la moneda USD Opciones de distribución del grado de solidez: El EUR aumenta su valor frente a otras divisas, lo que indica que la moneda se ha vuelto más atractiva para los tra

El indicador Barómetro de Divisas es una herramienta única que mide la fuerza de dos divisas representadas en el par y compara la diferencia entre ellas. El resultado se muestra como un histograma en el que puede identificar de forma sencilla qué divisa es la más fuerte. Este indicador está diseñado para medir las fortalezas y debilidades de ocho divisas principales (USD, EUR, GBP, CHF, CAD, JPY, AUD y NZD) y funciona en 28 pares de divisas. El indicador utiliza el método CI (Commodity Channel

El indicador Volume Spread Analysis se basa en el método original Volume Spread Analysis. Fue diseñado para el reconocimiento rápido y fácil de patrones VSA. Aunque este indicador parece muy simple, es la herramienta más sofisticada que hemos creado. Es una herramienta analítica realmente potente que genera señales de trading muy fiables. Debido a que es muy fácil de usar y comprensible, es adecuado para todo tipo de trader, independientemente de su experiencia.
¿Qué es VSA? VSA - Volume Spread
Cuando el precio se mueve rápidamente hacia arriba/abajo, la mayoría de los brokers aumentan el Spread. Este indicador mostrará el Spread para 9 pares de divisas de su elección (dígitos amarillos ) - usted permite cambiar todos los parámetros de entrada, incluyendo el cambio de nombre de los pares de divisas. Este indicador también muestra el indicador clásico RSI (Relative Strength Index) para los pares de divisas definidos y será útil para aquellos que aman y saben cómo utilizar no una represe

El indicador VWAP es nuestra versión del popular indicador Precio medio ponderado por volumen. El VWAP es la relación entre el valor negociado (precio multiplicado por el número de volumen negociado) y el volumen total negociado durante un periodo de tiempo específico. Como resultado, mide el precio medio del instrumento mucho mejor que la media móvil simple. Aunque hay muchas formas de utilizar el VWAP, la mayoría de los inversores lo utilizan para calcular la media diaria.
El indicador funci

Sobrecompra describe un periodo de tiempo en el que se ha producido un movimiento alcista significativo y constante en el precio durante un periodo de tiempo sin mucho retroceso. La sobreventa describe un período de tiempo en el que se ha producido un movimiento bajista significativo y constante en el precio durante un período de tiempo sin mucho retroceso. Este indicador mostrará las condiciones de sobrecompra (barras verdes) y sobreventa (barras rojas). El valor de las Barras Verdes/Rojas repr

El monitor de velas jap onesas escanea las velas japonesas. Muestra una línea vertical y el nombre de un probable patrón de velas. El indicador se actualiza constantemente y se añaden nuevos patrones. Sus comentarios son bienvenidos. Acabo de empezar a trabajar en el indicador, y sus opiniones son muy apreciadas . El indicador no funciona con datos históricos . Si el indicador no ha sido lanzado en la apertura de una vela, esa vela no es considerada. Esto significa que el indicador funciona en t

Se trata de un indicador interactivo y fácil de configurar que permite formar siete canales igualmente espaciados que tienen sus ajustes simultáneamente. Los siete canales están habilitados por defecto. Pero puede activar fácilmente uno u otro canal utilizando los botones de control situados en la parte superior del panel de control del indicador. Puede cambiar un periodo del cálculo del indicador haciendo clic en uno de los botones que indican el número del canal en la parte inferior del panel

Descripción Muestra si el mercado está en tendencia o no, en qué medida, en qué dirección y si la tendencia es creciente. El indicador es muy útil para las estrategias de seguimiento de tendencias. El indicador también puede alertar cuando el mercado pasa de estar plano a estar en tendencia, lo que puede servir como un gran punto de entrada. La alerta se puede controlar directamente desde el gráfico, con una casilla en el gráfico para activar la alerta. También incluye indicadores adicionales de

Este indicador se basa en los indicadores clásicos: RSI (Relative Strength Index) y PSAR (Parabolic Stop and Reverse) y será útil para aquellos que aman y saben cómo utilizar no una representación visual, sino digital de los indicadores. El indicador muestra valores de 9 pares de divisas. Usted será capaz de cambiar los principales parámetros de entrada para el RSI: OverboughtLevel = 70; OversoldLevel = 30; Period = 14; Precio = PRICE_CLOSE; y PSAR: paso = 0.02 máximo = 0.2; También puede cambia

Basta con colocar el indicador en el gráfico y los niveles de soporte y resistencia se mostrarán automáticamente. El indicador para el dibujo automático de niveles de soporte y resistencia basado en TRES puntos. Los puntos identificados se marcan en el gráfico El indicador muestra el precio de ruptura tanto para tendencias alcistas como bajistas (si se encuentra) Puede especificar en cuántas barras debe mirar el indicador para identificar los puntos de soporte. Además, puede seleccionar en qué m

El indicador para el trazado automático de medias móviles basadas en Fibonacci en el gráfico. Admite hasta ocho líneas a la vez. El usuario puede configurar el periodo de cada línea. El indicador también ofrece opciones para configurar el color y el estilo de cada línea. Además, es posible mostrar el indicador sólo en determinados marcos temporales. Por favor, póngase en contacto con el autor para proporcionar niveles adicionales o si tiene alguna otra sugerencia.
El nuevo indicador Impostol se basa en el índice de fuerza relativa (RSI) y el indicador de tendencia ADX. Con él, puede identificar una tendencia para sus operaciones. Sus señales son fáciles de interpretar, ya que muestra las entradas recomendadas mediante flechas hacia arriba y hacia abajo. El indicador tiene un mínimo de ajustes y es fácil de usar.
Impostol Expert para MetaTrader 4 - AQUÍ
Características principales Utiliza flechas para mostrar los puntos de entrada en el mercado. El indic

¡El indicador de Breakout que ha sido probado y testado! Breakout Analyzer utiliza un algoritmo avanzado basado en patrones de precios de alta probabilidad. Cada operación se analiza en el panel de estadísticas para ayudarle a evaluar las mejores configuraciones de ruptura.
Bono Estrategia 1
Breakout Analyzer con Volumen Crítico Ver Video: (Haga clic aquí)
Bono Estrategia 2
Analizador de Breakout con Medidor de Fuerza
Ver Video: (Haga clic aquí)
Características Compatibilidad universal con d

BB St Dev BB St Dev es análogo al indicador Bollinger. Las partes superior e inferior del canal de Bollinger se calculan mediante iStdDev . iStdDev es un indicador estándar de МetaТrader 4. La media móvil tiene un algoritmo especial de suavizado. Ajustes M - período de Media móvil Parámetro BandsDeviations - factor de generación del canal. Aparte de las Bandas de Bollinger clásicas, BandsDeviations puede poseer aquí cualquier valor. Parámetro Visio Si Visio = False , este indicador coincidirá co
El indicador para presentar el spread actual en tiempo real. Se trata de un indicador muy sencillo pero útil para la negociación manual y el análisis de mercado. El indicador muestra el spread actual (en formato de 4 dígitos) para el instrumento seleccionado. Puede especificar el lugar en el gráfico donde el indicador debe imprimir la salida, así como el color de salida. Por favor, póngase en contacto con el autor si se requiere algún cambio.

El modelo B150 es una versión totalmente revisada del indicador de Memoria Histórica con un algoritmo de búsqueda mejorado. También cuenta con una interfaz gráfica que hace que trabajar con esta herramienta sea rápido y cómodo. Indicador-pronosticador. Muy útil como asistente, actúa como punto clave para pronosticar el movimiento futuro de los precios. El pronóstico se realiza utilizando el método de búsqueda de la parte más similar en la historia (patrón). El indicador se dibuja como una línea
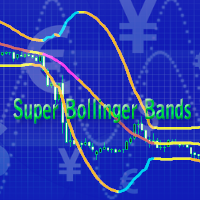
Se trata de un indicador prospectivo para operar con todos los instrumentos. Es una versión avanzada del indicador Bandas de Bollinger creado por el destacado analista John Bollinger. Una de las principales diferencias del indicador Super Bollinger Bands respecto a su predecesor consiste en mostrar el comportamiento de las bandas superior e inferior en la línea media con unos colores específicos. De este modo, el indicador proporciona al operador información visual sobre el desarrollo de la tend

La tendencia en Forex siempre ha sido amiga de los operadores, y los indicadores de tendencia ayudan a determinar la tendencia y a tomar las decisiones correctas. La mayoría de los sistemas de trading desarrollados por los gurús del trading se basan en la tendencia.
Se utiliza mejor en marcos temporales por encima de la M30, desde el comienzo de la sesión de Londres hasta América.
Hay que recordar que no hay indicadores que no se equivoquen. Cualquier estrategia requiere la confirmación de su
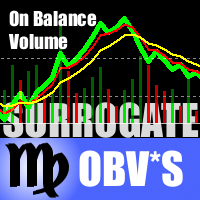
Esta es una edición especial del indicador On-Balance Volume basado en volúmenes pseudo-reales emulados a partir de volúmenes de tick. Calcula una estimación cercana a la real de la distribución de los volúmenes de operaciones para los instrumentos de Forex (donde sólo están disponibles los volúmenes de ticks) y luego les aplica la fórmula OBV convencional. Los volúmenes se calculan mediante el mismo algoritmo que se utiliza en el indicador TrueVolumeSurrogate . El indicador en sí no es necesari
¡Avanzado indicador ADX que permite operar en muchos marcos temporales simultáneamente! Indicador único con la capacidad de mostrar gráficos ADX no sólo en el marco de tiempo actual, sino también en los superiores. El ejemplo adjunto muestra cómo es posible ver 3 ADX gráfico en M5, M15 y M30 plazos, respectivamente. Esta funcionalidad permite mejorar significativamente la precisión en la determinación de la tendencia. El parámetro Timeframe Delta especifica cuánto debe diferir el timeframe del i

Este indicador está diseñado para el marco de tiempo M1 y muestra 2 líneas: Suma de Puntos cuando el precio sube dividido en Suma de Ticks cuando el precio sube (color Aqua). Suma de Puntos cuando el precio baja dividido en Suma de Ticks cuando el precio baja (color Naranja). Verá todos los datos principales como un comentario en la esquina superior izquierda del gráfico. Tenga en cuenta que la Suma de Puntos será mayor o igual a la Suma de Ticks. Por supuesto, el ATT está calculando todos los t
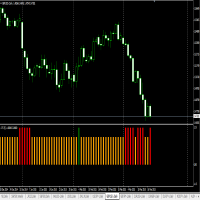
Este es un indicador para encontrar la tendencia más fuerte cada día, adecuado para operaciones intradía o swing trading. Vea el rendimiento en vivo en : https://www.mql5.com/en/signals/93383
Cómo utilizarlo: BARRA RO JA significa Tendencia Bajista para la siguiente vela BARRA VERDE significa tendencia alcista para la siguiente vela BARRA NARANJA significa Tendencia Lateral para la siguiente vela
Ejemplo:
Si estamos usando el timeframe D1, ver la última BARRA, si la barra es BARRA ROJA, abrir
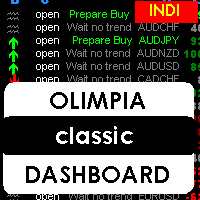
Este indicador es un tablero multipares que reconoce la mejor configuración de pares para abrir órdenes con 8 familias de divisas. Las familias de divisas incluyen: AUD, USD, EUR, GBP, CAD, NZD, CHF, JPY; 28 pares en total. El momento preciso para abrir una orden se muestra en la columna A del panel de control, también puede configurar alertas, correos electrónicos y notificaciones a dispositivos móviles. Puede filtrar las alertas por el valor del spread de los pares.
¿Qué muestra el cuadro de

Se trata de un indicador para filtrar señales adicionales. Se puede utilizar como un filtro adicional en un sistema de comercio. El indicador no vuelve a dibujar sus datos y se puede utilizar tanto en el comercio de divisas y con opciones binarias. Tiene 3 modos de funcionamiento y ajustes de sensibilidad flexibles. El indicador utiliza múltiples buffers, por lo tanto puede ser fácilmente utilizado en varios Asesores Expertos.
Compruebe lo fácil y sencillo que es comprar un robot en la MetaTrader AppStore, la tienda de aplicaciones para la plataforma MetaTrader.
El Sistema de pago MQL5.community permite efectuar pagos con ayuda de PayPal, tarjeta bancaria y los sistemas de pago más populares. Además, le recomendamos encarecidamente testar el robot comercial antes de la compra, para así hacerse una idea más completa sobre él.
Está perdiendo oportunidades comerciales:
- Aplicaciones de trading gratuitas
- 8 000+ señales para copiar
- Noticias económicas para analizar los mercados financieros
Registro
Entrada
Si no tiene cuenta de usuario, regístrese
Para iniciar sesión y usar el sitio web MQL5.com es necesario permitir el uso de Сookies.
Por favor, active este ajuste en su navegador, de lo contrario, no podrá iniciar sesión.