Candle time multi frame
- Indicadores
-
Cuong Pham
 coding and modifying EA, indicators professionally, fast and more...(languages:MQL/C,C++/Java/C#)
email hungcuongkhmt51@gmail.com
skype cuongph149 - Versión: 1.2
- Actualizado: 20 noviembre 2021
- Activaciones: 5
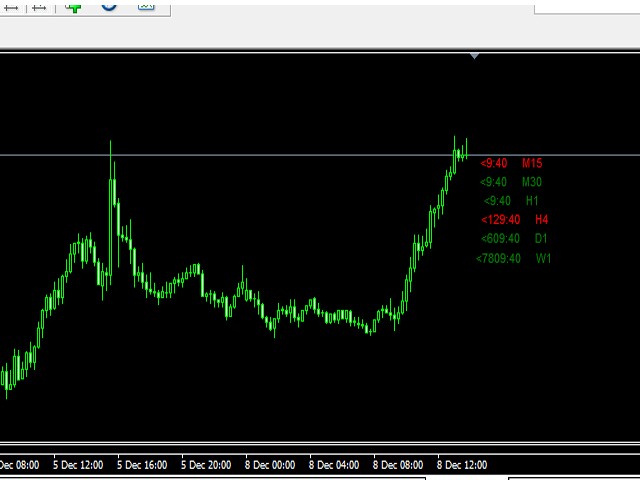
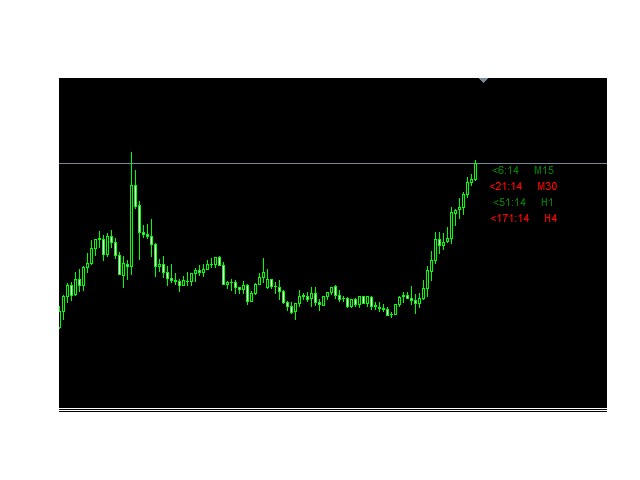
El indicador le muestra el tiempo restante hasta la finalización de la vela actual de cualquier marco de tiempo que haya elegido, mostrando la estructura (ver detalles).
Minuto: segundo.
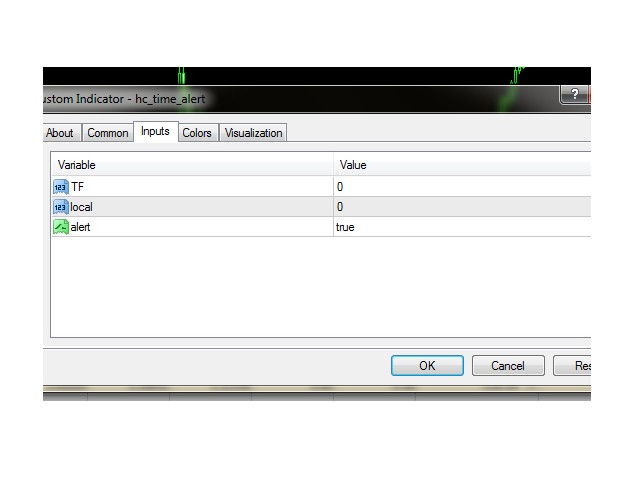
El indicador tiene 3 parámetros:
- TF - este parámetro le ayudará a elegir el marco de tiempo que desee, por ejemplo, si desea mostrar el tiempo restante para M30, establezca TF=30. Si desea mostrar el tiempo restante del período actual que está viendo en el gráfico, establezca TF=0 (como por defecto).
- Local - este parámetro le ayudará a elegir la ubicación en el gráfico donde se mostrará el texto. En caso de que desee mostrar muchos marcos de tiempo en el gráfico, sólo tiene que añadir el indicador muchas veces, y elegir diferentes valores para 'Local' para verlo, como en la primera captura de pantalla, donde lo añadí 6 veces y elegí este valor así:
- primera vez: local=0
- segunda: local =-2
- tercero: local=-4
Sólo para ayudarnos a tener una buena vista en el gráfico.
- Alerta - si lo pones = true cuando añades el indicador, te avisará cuando aparezca la siguiente vela (del TF que elijas).
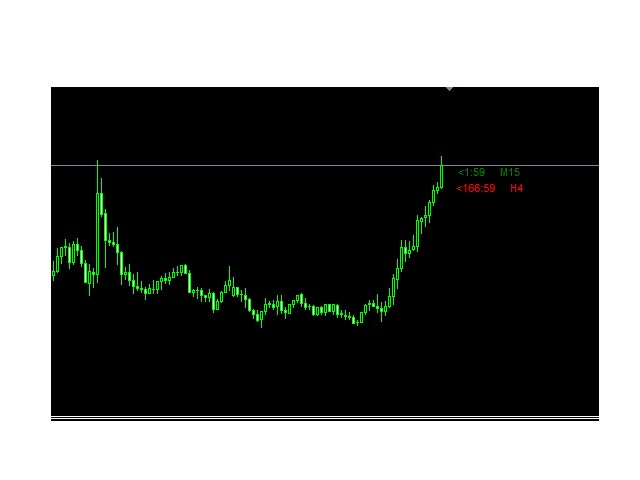
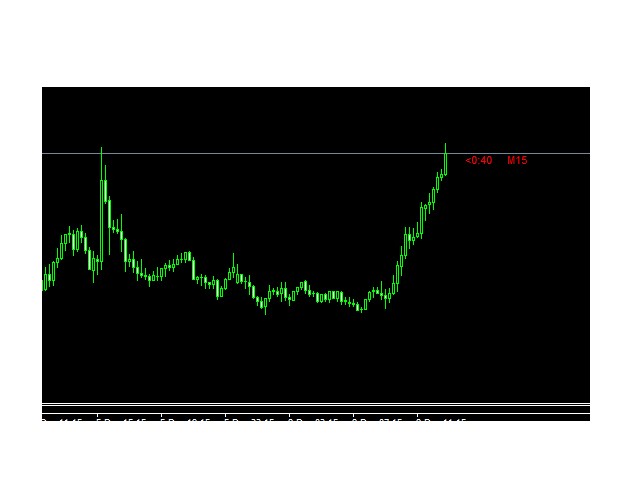
Si el param "alerta" = true, el tiempo se mostrará en color rojo, si no, tendrá color verde.
Para cualquier pregunta contactame skype: cuongph149.
Gracias por leernos.