Indicadores técnicos de pago para MetaTrader 4 - 16
Fractal Support/Resistance Clusters es un indicador que traza líneas de soporte y resistencia basadas en fractales cuyos orígenes aún no se han roto y, por lo tanto, siguen siendo relevantes. Un fractal es relevante como indicador de soporte o resistencia cuando el precio de su fractal opuesto anterior no se ha roto. Los clusters de zonas de soporte y resistencia se obtienen mediante el algoritmo de agrupación espacial de aplicaciones con ruido basado en la densidad (DBSCAN) y pueden dibujarse e

El indicador muestra señales según la estrategia de Bill Williams en un gráfico:
1. La señal "Primer Sabio" se forma cuando hay una barra divergente con angulación. Una barra divergente alcista tiene un mínimo inferior y el precio de cierre en su mitad superior. Una barra divergente bajista tiene un máximo más alto y el precio de cierre en su mitad inferior. La angulación se forma cuando las tres líneas alcistas están entrelazadas y el precio ha subido significativamente (o bajado). Una barra
Vista general Esta es la versión DELUXE de la serie Pivot Point Plotter. Es un indicador robusto que calcula y traza dinámicamente cualquiera de los 4 principales puntos de pivote en su gráfico, independientemente del marco de tiempo intradiario en el que se coloca el indicador. Este indicador es capaz de trazar puntos pivote diarios ESTÁNDAR, CAMARILLA, FIBONNACI o WOODIE. Sea cual sea el que utilice en sus operaciones, este indicador es su ventanilla única. Tenga en cuenta que se trata de un P

El indicador Two Moving Averages, muestra simultáneamente en la ventana principal del gráfico dos líneas Medias Móviles con los ajustes por defecto: la Verde y la Roja, que representan la tendencia a corto plazo. Es posible cambiar los ajustes de las medias móviles, así como el color. Sin embargo, debo observar que los parámetros han sido elegidos de tal forma que permitan comerciar en todos los intervalos temporales. Es una variante de aplicación de las líneas Medias Móviles en una Estrategia

El indicador Three Moving Average, muestra simultáneamente en la ventana principal del gráfico tres líneas Medias Móviles con los ajustes por defecto: la Verde y la Roja, que representan la tendencia a corto plazo, la Roja y la Azul, que representan la tendencia a medio plazo. Es posible cambiar los ajustes de las medias móviles, así como el color. Sin embargo, debo observar que los parámetros han sido elegidos de tal forma que permitan comerciar en todos los intervalos temporales. Es una varian

Este indicador predice los cambios de cotización basándose en el principio de visualización de gráficos. Utiliza la idea de que las fluctuaciones del precio constan de fases de "acción" y "reacción", y la "reacción" es comparable y similar a la "acción", por lo que se puede utilizar el reflejo para predecirla. El indicador tiene tres parámetros predict - el número de barras para la predicción (24 por defecto); depth - el número de barras pasadas que se utilizarán como puntos de reflejo; para tod

Este indicador analiza la acción pasada de los precios para anticipar la presión de compra y venta en el mercado: lo hace mirando hacia atrás en el pasado y analizando los picos y valles de precios en torno al precio actual. Es un indicador de confirmación de última generación. [ Guía de instalación | Guía de actualización | Solución de problemas | FAQ | Todos los productos ] Predecir la presión de compra y venta en el mercado Evite quedar atrapado comprando vendiendo frenéticos No se necesita
El soporte se produce cuando los precios caen, se detienen, cambian de dirección y comienzan a subir. El soporte a menudo se ve como un "piso" que es el soporte o la retención de los precios. La resistencia es un nivel de precios donde los precios crecientes se detienen, cambian de dirección y comienzan a caer. La resistencia a menudo se ve como un "techo" que impide que los precios suban más. Este indicador dibuja las líneas de soporte y resistencia calculadas según las barras nBars . Si el par

Este indicador está destinado a proteger su posición abierta en cualquier marco temporal y par de divisas.
Posición larga En caso de que el precio actual suba por encima del precio Take Profit o por debajo del precio Stop Loss de la posición abierta y la Mesa de Negociación no cierre esta posición, el indicador crea un archivo Excel con el nombre: Buy-TP_Symbol_Date.csv o Buy-SL_Symbol_Date.csv que se colocará en la carpeta: C:\Program Files\ ........\MQL4\Files Archivo Excel para Buy-TP: Tendr

Si le gusta operar con cruces (como AUDJPY, CADJPY, EURCHF y similares), debe tener en cuenta lo que sucede con las principales divisas (especialmente, USD y EUR) frente al par de trabajo: por ejemplo, mientras opera con AUDJPY, los niveles importantes de AUDUSD y USDJPY pueden tener un efecto implícito. Este indicador le permite ver los niveles ocultos, calculados a partir de las cotizaciones principales. Encuentra los extremos más cercanos en las cotizaciones principales para la profundidad hi
Indicador Autoexplicativo: comprar cuando la línea Aqua cruce la línea Amarilla hacia arriba y Vender cuando la línea Aqua cruce la línea Amarilla hacia abajo. Parámetros de entrada: Periodo1 = 13. Método1 = 2. MODE_SMA=0, MODE_EMA=1, MODE_SMMA=2, MODE_LWMA=3. Period2 = 5. Método2 = 0. MODE_SMA=0, MODE_EMA=1, MODE_SMMA=2, MODE_LWMA=3.

Este indicador está diseñado para el marco de tiempo H1 y muestra: Suma de puntos cuando el precio sube (Histograma Verde). Suma de puntos cuando el precio baja (histograma rojo). En otras palabras, por el número y la proporción de puntos alcistas y bajistas, se puede hacer un análisis técnico del estado del mercado.
Si el histograma verde prevalece sobre el rojo, se puede concluir que en este momento los compradores son más fuertes que los vendedores, y viceversa, si el histograma rojo prevale

El indicador muestra los niveles de precios más destacados y sus cambios en el historial. Detecta dinámicamente las regiones en las que los movimientos de los precios forman atractores y muestra hasta 8 de ellos. Los atractores pueden servir como niveles de resistencia o soporte y como límites exteriores para las cotizaciones. Parámetros: WindowSize - número de barras en la ventana deslizante que se utiliza para la detección de atractores; por defecto es 100; MaxBar - número de barras a procesar

Se trata de un indicador intradiario que utiliza fórmulas convencionales para los niveles diarios y semanales de pivote, resistencia y soporte, pero los actualiza dinámicamente barra a barra. Responde a la pregunta de cómo se comportarían los niveles de pivote si cada barra se considerara como la última barra del día. En cada momento, toma en consideración N últimas barras, donde N es el número de barras en un día (en 24 horas) o el número de barras en una semana - para niveles diarios y semanal
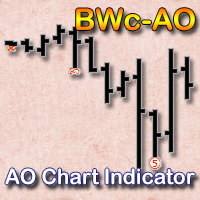
El indicador muestra las señales del Oscilador Asombroso en el gráfico según la estrategia de Bill Williams:
Señal "Platillo " - es la única señal de compra (venta), que se forma cuando el histograma del Awesome Oscillator está por encima (por debajo) de la línea cero. Un "Platillo" se forma cuando el histograma cambia su dirección de descendente a ascendente (señal de compra) o de ascendente a descendente (señal de venta). En este caso todas las columnas del histograma AO deben estar por enci

De los cuatro principales mercados de capitales, el mundo de las operaciones con divisas es el más complejo y difícil de dominar, a menos que se disponga de las herramientas adecuadas. La razón de esta complejidad no es difícil de entender. En primer lugar, las divisas se negocian por pares. Cada posición es un juicio de las fuerzas que mueven dos mercados independientes. Si el GBP/USD, por ejemplo, es alcista, ¿se debe a la fortaleza de la libra o a la debilidad del dólar estadounidense? Imagin

Indicador Gann Time Clusters Este indicador se basa en el método del Cuadrado de 9 de W. D. Gann para el eje temporal. Utiliza puntos de inversión de mercado pasados y aplica la fórmula matemática para el Cuadrado de 9 de Gann y luego hace proyecciones hacia el futuro. Una fecha/hora en la que se alinean las proyecciones futuras se denomina "grupo temporal". Estos grupos de tiempo se dibujan como líneas verticales en el lado derecho del gráfico donde el mercado aún no ha avanzado. Un racimo de t

La mayoría de los operadores utilizan niveles de resistencia y soporte para operar, y muchas personas dibujan estos niveles como líneas que pasan por los extremos de un gráfico. Cuando alguien hace esto manualmente, normalmente lo hace a su manera, y cada trader encuentra diferentes líneas como importantes. ¿Cómo puede uno estar seguro de que su visión es correcta? Este indicador ayuda a resolver este problema. Construye un conjunto completo de líneas virtuales de resistencia y soporte alrededor

Imagen automática, en directo e interactiva de todas las líneas de tendencia. Asigne alertas push, de correo electrónico y sonoras a las líneas de su elección y manténgase informado sobre el retroceso del precio, la ruptura, el retroceso después de la ruptura, el número de retrocesos, la expiración de la línea por doble ruptura. Corrija, arrastre o elimine las líneas y ajuste interactivamente el sistema de líneas. https://youtu.be/EJUo9pYiHFA. Ejemplos de gráficos https://www.mql5.com/en/users/e

El indicador dibuja un histograma de niveles importantes para varias divisas principales unido a los tipos de cambio cruzados actuales. Está pensado para su uso en gráficos de cruces. Muestra un histograma calculado a partir de los niveles de los extremos más cercanos de las principales divisas relacionadas. Por ejemplo, los niveles ocultos para AUDJPY pueden detectarse analizando los extremos de los tipos AUD y JPY frente a USD, EUR, GBP y CHF. Todos los instrumentos construidos a partir de est

El indicador proporciona un histograma estadístico de los movimientos de precios estimados para las barras intradía. Construye un histograma de los movimientos medios de los precios para cada barra intradía de la historia, por separado para cada día de la semana. Las barras con movimientos superiores a la desviación estándar o con un mayor porcentaje de compras que de ventas, o viceversa, pueden utilizarse como señales directas de negociación. El indicador busca en el historial del símbolo actua
Los niveles de "Soporte" y "Resistencia" - puntos en los que la tendencia del tipo de cambio puede ser interrumpida e invertida - son ampliamente utilizados para la previsión del tipo de cambio a corto plazo. Uno puede utilizar este indicador como señales de Compra/Venta cuando el precio actual va por encima o más allá de los niveles de Resistencia/Soporte respectivamente y como un valor de StopLoss para la posición abierta.

Se trata de un indicador de señales fácil de usar que muestra y alerta sobre las medidas de probabilidad de compra y venta en un futuro próximo. Se basa en datos estadísticos recogidos en el historial existente y tiene en cuenta todos los cambios de precios observados frente a los intervalos de barras correspondientes en el pasado. Los cálculos estadísticos utilizan la misma matriz que otro indicador relacionado - PointsVsBars. Una vez que el indicador se coloca en un gráfico, muestra 2 etiqueta

La tendencia es la dirección en la que se mueven los precios, basándose en dónde han estado en el pasado . Las tendencias se componen de máximos y mínimos. La dirección de esos máximos y mínimos constituye la tendencia de un mercado. Si esos máximos y mínimos se mueven hacia arriba, hacia abajo o lateralmente, indica la dirección de la tendencia.
El indicador PineTrees es lo suficientemente sensible (hay que utilizar el parámetro de entrada nPeriod) para mostrar la tendencia alcista (línea verd

CCFpExtra es una versión extendida del clásico indicador de cluster - CCFp. Esta es la versión MT4 del indicador CCFpExt disponible para MT5. A pesar de que la versión MT5 se publicó primero, es la versión MT4 la que se desarrolló y probó inicialmente, mucho antes de que se lanzara el mercado MT4. Características principales Soporta grupos arbitrarios de tickers o divisas: pueden ser Forex, CFDs, futuros, spot, índices; Alineación temporal de barras para diferentes símbolos con un manejo adecuad

Esta metodología particular. Tenga en cuenta la secuencia impar en el conteo, como verá, es necesario para el análisis inductivo. Comenzando por un máximo nos aseguramos de comenzar nuestro recuento en una nueva onda. (Lo contrario se aplicaría para una onda bajista). El punto 2 es un techo. El punto 3 es el mínimo del primer descenso. El punto 1 es el mínimo anterior al punto 2 (techo), que el 3 ha superado. El punto 4 es el máximo del rally posterior al punto 3. El punto 5 es la parte inferior

Los tres tipos básicos de tendencias son alcista, bajista y lateral. Una tendencia alcista se caracteriza por un aumento general del precio. Nada se mueve hacia arriba durante mucho tiempo, por lo que siempre habrá oscilaciones, pero la dirección general tiene que ser al alza. Una tendencia bajista se produce cuando el precio de un activo baja durante un periodo de tiempo. Se trata de un indicador de ventana independiente sin parámetros de entrada. El histograma verde representa una tendencia al

Cuando las bandas se acercan, estrechando la media móvil, se denomina "squeeze". Un estrangulamiento indica un periodo de baja volatilidad y los operadores lo consideran una señal potencial de un futuro aumento de la volatilidad y de posibles oportunidades de negociación. Por el contrario, cuanto más separadas estén las bandas, mayor será la probabilidad de que disminuya la volatilidad y mayor la posibilidad de salir de una operación. Este indicador puede utilizarse en cualquier marco temporal y
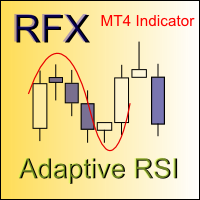
El Índice de Fuerza Relativa (RSI) es uno de los osciladores más populares y precisos ampliamente utilizado por los operadores para capturar las zonas de sobrecompra y sobreventa de la acción del precio. Aunque el indicador RSI funciona bien durante un período de mercado, no logra generar señales rentables cuando la condición del mercado cambia, y por lo tanto produce señales erróneas que resultan en grandes pérdidas. ¿Ha pensado alguna vez en un indicador RSI adaptativo que adapte su periodo de

Se trata de un indicador de señales para la negociación automática que muestra medidas de probabilidad de compra y venta para cada barra. Se basa en datos estadísticos recogidos en el historial existente y tiene en cuenta todos los cambios de precios observados en relación con los intervalos de barras correspondientes en el pasado. El núcleo del indicador es el mismo que en PriceProbablility indicador destinado a la negociación manual. A diferencia de PriceProbability este indicador debe ser lla

La idea principal de este indicador es el análisis y la predicción de los tipos mediante la transformada de Fourier. El indicador descompone los tipos de cambio en armónicos principales y calcula su producto en el futuro. Usted puede utilizar el indicador como un producto independiente, pero para una mejor precisión de predicción hay otro indicador relacionado - FreqoMaster - que utiliza FreqoMeterForecast como motor backend y combina varias instancias de FreqoMeterForecast para diferentes banda

La idea principal de este indicador es el análisis y la predicción de los tipos mediante la transformada de Fourier. El indicador descompone los tipos de cambio en armónicos principales y calcula su producto en el futuro. El indicador muestra 2 marcas de precios en el historial, que representan el rango de precios en el pasado, y 2 marcas de precios en el futuro con la previsión del movimiento de los precios. La decisión de compra o venta y el tamaño de la ganancia se muestran en una etiqueta de

ACTUALIZACIÓN: Pido disculpas por aumentar el precio de 15$ a 30$, pero así lo exigió MetaQuotes durante la actualización de la versión. La antigua compilación de 2015 dejó de funcionar por incompatibilidad con un nuevo terminal. ¿Qué es Squeeze? Una contracción de las Bandas de Bollinger dentro del Canal de Keltner refleja un mercado que se toma un respiro y se consolida, y suele verse como un potencial indicador adelantado de un movimiento direccional posterior o de un gran movimiento de osci

¿Qué es un Squeeze? Una contracción de las Bandas de Bollinger dentro del Canal de Keltner refleja un mercado que se toma un respiro y se consolida, y normalmente se ve como un potencial indicador adelantado de un movimiento direccional posterior o de un gran movimiento de oscilación. Cuando las Bandas de Bollinger abandonan el Canal de Keltner significa que los mercados pasan de una volatilidad baja a una volatilidad alta y la volatilidad alta es algo que todos los operadores buscan. Lo que ech
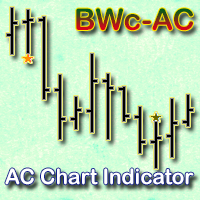
El indicador muestra en las señales de gráficos de Acelerador oscilador (AC) de acuerdo con las estrategias de Bill Williams.
Gráfico de barras de AC es la diferencia entre el valor de 5/34, de la conducción de la fuerza gráfica de barras y el promedio móvil simple de 5 periodos, tomada a partir de ese gráfico de barras.
Interpretación de la Acelerador de oscilador (AC) se basa en las siguientes reglas - Si de CA es mayor que la línea de cero, se considera que la aceleración continuará el movi

Los arcos de Fibonacci en los círculos completos se basan en la vela del día anterior (Máximo - Mínimo).
Estos arcos se cruzan con la línea base en el 23,6%, 38,2%, 50%, 61,8% y 78,6%. Los arcos de Fibonacci representan áreas de soporte y resistencia potenciales.
Punto de referencia: el precio de cierre del día anterior.
Estos círculos permanecerán inmóviles durante todo el día hasta el comienzo del nuevo día de negociación, cuando el indicador construirá automáticamente un nuevo conjunto de

Se trata de un indicador muy potente que proporciona una mezcla de tres totales de rendimientos ponderados lineales. Cada uno es similar a un modo específico del indicador ReturnAutoScale . El resultado es una superposición escalada de tres series temporales integradas y estacionarias en diferencias, cada una para una estrategia de negociación diferente. El indicador muestra tres líneas: amarillo - rendimientos lentos del mercado, corresponde al modo 0 en ReturnAutoScale; azul - rendimientos med
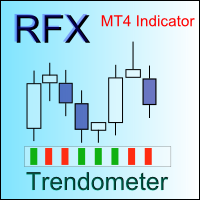
Identificar la tendencia del mercado es una tarea esencial de los operadores. Trendometer implementa un algoritmo avanzado para visualizar la tendencia del mercado. El objetivo principal de este indicador es evaluar el mercado en los marcos de tiempo más bajos (es decir, M1, M5 y M15) con fines de scalping. Si usted es un scalper en busca de un indicador fiable para mejorar la calidad de su comercio, Trendometer es para usted. El indicador se ejecuta en una ventana independiente que muestra un h

El soporte y la resistencia representan coyunturas clave en las que confluyen las fuerzas de la oferta y la demanda. Una nota interesante es que los niveles de resistencia a menudo pueden convertirse en zonas de soporte una vez que se han superado. Este indicador calcula y dibuja 5 pares de líneas de "Soporte y Resistencia" como "Máximo y Mínimo" del día actual y de los 4 días anteriores.

Este indicador utiliza 10 indicadores clásicos: Medias móviles Rango Porcentual de Larry Williams Parada Parabólica e Inversión Convergencia/Divergencia de Medias Móviles Media Móvil de Oscilador Índice del Canal de Materias Primas Momentum Índice de Fuerza Relativa Oscilador Estocástico Índice de Movimiento Direccional Medio para calcular la tendencia alcista o bajista del par de divisas actual por principio mayoritario para todos los TimeFrames.

Este indicador ayuda a encontrar puntos altos/bajos. No es un indicador de tendencia perfecto, porque a veces muestra una tendencia contraria a la del mercado. Pero nunca pasa por alto el precio más alto y más bajo de la historia. Por lo tanto, las reglas de entrada son: Vender con tendencia bajista (línea roja), Comprar con tendencia alcista (línea azul). Flechas amarillas para Vender, pero debe ser confirmado por la tendencia bajista. Flechas azules para comprar, pero debe ser confirmado por l

Este indicador es una combinación visual de 2 indicadores clásicos: Bears y MACD. El uso de este indicador puede ser el mismo que ambos indicadores clásicos por separado o combinados. Parámetros de entrada: input int BearsPeriod = 9; input ENUM_MA_METHOD maMethod = MODE_SMA; input ENUM_APPLIED_PRICE maPrice = PRICE_CLOSE; input int SignalPeriod = 5.

Este indicador es una combinación visual de 2 indicadores clásicos: Bulls y MACD. La idea principal del MACD es que resta la media móvil a más largo plazo de la media móvil a más corto plazo. De esta manera convierte un indicador de seguimiento de tendencia en uno de impulso y combina las características de ambos. El uso de este indicador puede ser el mismo que el de los dos indicadores clásicos por separado o combinados. Parámetros de entrada: BullsPeriod = 9; maMétodo = MODO_SMA; ENUM_MA_MÉTOD

Los indicadores Bull y Bear Power identifican si los compradores o los vendedores en el mercado tienen el poder, y como tal conducen a la ruptura del precio en las direcciones respectivas. El indicador de poder de los osos intenta medir el apetito del mercado por precios más bajos. El indicador Bulls Power intenta medir el apetito del mercado por precios más altos. Este indicador en particular será especialmente muy eficaz cuando el histograma estrecho y el histograma ancho residan en el mismo l

Este indicador vigila el mercado para detectar un estado plano y una posible ruptura. El estado plano se detecta como un número predefinido de barras consecutivas durante las cuales el precio fluctúa dentro de un pequeño rango. Si una de las siguientes barras cierra fuera del rango, se señala una ruptura. El indicador muestra 3 líneas: azul - límite superior de rangos planos Y áreas de ruptura consecutivas; rojo - límite inferior de rangos planos Y áreas de ruptura consecutivas; amarillo - centr

Si la dirección del mercado es alcista, se dice que el mercado está en una tendencia alcista ; si es bajista, está en una tendencia bajista y si no se puede clasificar ni alcista ni bajista o más bien fluctúa entre dos niveles, entonces se dice que el mercado está en una tendencia lateral. Este indicador muestra Tendencia alcista (Histograma verde), Tendencia bajista (Histograma rojo) y Tendencia lateral (Histograma amarillo). Sólo tiene un parámetro de entrada: ActionLevel. Este parámetro depen

Este indicador predice el próximo movimiento ZigZag basándose en las probabilidades históricas de las aristas ZigZag. Procesa la historia disponible para calcular la distribución de densidad de los bordes ZigZag y la probabilidad condicional de sus pares consecutivos. A continuación, utiliza las probabilidades para estimar los niveles en los que pueden aparecer los futuros extremos (puntos de inversión). Este indicador construye el zigzag mediante el indicador HZZM , pero no muestra el zigzag en

Este indicador está diseñado para la formación de líneas de tendencia, soporte y resistencia basadas en el cruce de los extremos del ZigZag. El indicador construye líneas rectas que pasan a través de los últimos extremos ZigZag y detecta su cruce con los precios futuros generando una señal de ruptura de compra o venta. Uno de los indicadores ZigZag incorporados puede utilizarse como motor. Advertencia: La mayoría de los zigzags redibujan el último segmento o retrasan la salida del último extremo

Este indicador se basa en los indicadores clásicos: Commodity Channel Index, Relative Strength Index y Moving Average. Estoy utilizando este indicador para abrir una posición Larga cuando el histograma Rojo cambió a histograma Verde por debajo de la línea cero y para abrir la posición Corta cuando el histograma Verde cambió a histograma Rojo por encima de la línea cero . Una gran ventaja de este sistema radica en el hecho de que el indicador no tiene parámetros de entrada y se adapta a todos los
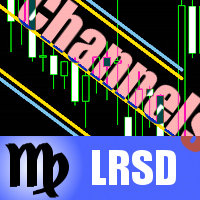
Este es un indicador de ruptura que utiliza canales adaptativos de Regresión Lineal (LR) y Desviación Estándar (SD). Encuentra un mejor ajuste de regresión lineal y canales de desviación estándar en barras consecutivas, a continuación, supervisa los precios en la ruptura del canal, y si es así - genera una señal. El mejor ajuste se realiza eligiendo la longitud de los canales que proporcione menos diferencia entre la anchura de los canales LR y SD. En cada barra los canales pueden tener diferent

Indicador 3S diseñado para la detección de tendencias sin el efecto de los saltos accidentales de los precios. Utiliza series de precios y algunas medias móviles para reducir el ruido. Funciona en múltiples marcos temporales, incluso M1. Para aumentar la eficacia, se recomienda utilizar los parámetros por defecto para el gráfico M1 (ver capturas de pantalla). Puede cambiar los parámetros para otros marcos temporales. Ejemplo de uso de este indicador : Si el Oro cruza al Azul a la baja y tanto el
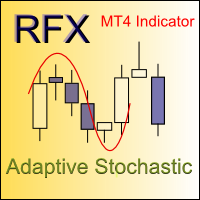
El oscilador estocástico es uno de los osciladores más populares y precisos, ampliamente utilizado por los operadores para captar las zonas de sobrecompra y sobreventa de la acción del precio. Aunque el indicador estocástico funciona bien durante un intervalo del mercado, no logra generar señales rentables cuando las condiciones del mercado cambian, y por lo tanto produce señales erróneas que resultan en grandes pérdidas. ¿Ha pensado alguna vez en un indicador estocástico adaptativo que adapte s

Se trata de un agregador de varias predicciones de niveles ZigZag basadas en la probabilidad. Utiliza el mismo enfoque que otro indicador de predicción basado en ZigZag - ZigZagProbability . Pero a diferencia de ZigZagProbability, este indicador combina el análisis de 5 zigzags con diferentes rangos. Para cada zigzag, procesa la historia disponible para calcular la distribución de densidad de los bordes del zigzag y la probabilidad condicional de sus pares consecutivos. A continuación, suma las

Este indicador se basa en múltiples instancias del indicador de clúster CCFpExtra y proporciona la superposición de sus resultados. El indicador crea un conjunto de instancias CCFpExtra con periodos cuidadosamente seleccionados y combina sus resultados utilizando algoritmos inteligentes de ponderación y normalización. Se acabaron las preocupaciones sobre los ajustes a elegir para el análisis de clusters, se acabaron las señales falsas. Y hereda todas las ventajas de CCFpExtra : grupos arbitrario

Price Breakout pattern Scanner es el escáner automático para operadores e inversores. Puede detectar patrones siguientes automáticamente de su gráfico. Cabeza y Hombro - Patrón común negociable. Reverse Head and Shoulder - Este patrón es la formación inversa de la cabeza y el hombro. Doble techo - Cuando el precio alcanza el nivel de resistencia dos veces y declina hacia el nivel de soporte, el operador puede anticipar una ruptura bajista repentina a través del nivel de soporte. Doble Fondo - El
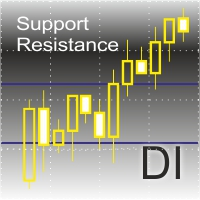
Este indicador muestra en el gráfico los niveles de soporte y resistencia.
Particularidades: Muestra los niveles de soporte y resistencia para los últimos 12 meses. Muestra el máximo y el mínimo de la última semana. Muestra el valor "МА 200". Muestra las brechas (gaps) con filtro establecido.
Ajustes del indicador: ShowMA200 – muestra/no muestra el valor "МА 200". ColorMA200 – color de la línea "МА 200". LineStyleMA200 - estilo de la línea 'МА 200". LineWidthMA200 - ancho de la línea "МА 200
Si le gusta operar según patrones de velas y desea reforzar este enfoque con tecnologías modernas, este indicador y otras herramientas relacionadas son para usted. De hecho, este indicador es una parte de una caja de herramientas, que incluye un motor de red neuronal que implementa el Mapa Auto-Organizado (SOM) para el reconocimiento de patrones de velas, predicción, y le proporciona una opción para explorar los datos de entrada y resultantes. La caja de herramientas contiene: SOMFX1Builder - un

Si le gusta operar según patrones de velas y desea reforzar este enfoque con tecnologías modernas, este indicador y otras herramientas relacionadas son para usted. De hecho, este indicador es una parte de una caja de herramientas, que incluye un motor de red neuronal que implementa el Mapa Auto-Organizado (SOM) para el reconocimiento de patrones de velas, predicción, y le proporciona una opción para explorar los datos de entrada y resultantes. La caja de herramientas contiene: SOMFX1Builder - un

El propósito de esta nueva versión del indicador estándar de MT4 proporcionado en su plataforma es mostrar en una sub-ventana múltiples marcos temporales del mismo indicador con sus divergencias. Vea el ejemplo mostrado en la imagen inferior. Pero la visualización no es como un simple indicador MTF. Esta es la visualización real del indicador en su timeframe. Aquí están las opciones disponibles en el indicador de divergencias FFx: Seleccione los marcos de tiempo a mostrar (M1 a Mensual) Definir

El propósito de esta nueva versión del indicador estándar de MT4 proporcionado en su plataforma es mostrar en una sub-ventana múltiples marcos temporales del mismo indicador con sus divergencias. Vea el ejemplo mostrado en la imagen inferior. Pero la visualización no es como un simple indicador MTF. Esta es la visualización real del indicador en su timeframe. Aquí están las opciones disponibles en el indicador de divergencias FFx: Seleccione los marcos de tiempo a mostrar (M1 a Mensual) Definir

El propósito de esta nueva versión del indicador estándar de MT4 proporcionado en su plataforma es mostrar en una sub-ventana múltiples marcos temporales del mismo indicador con sus divergencias. Vea el ejemplo mostrado en la imagen inferior. Pero la visualización no es como un simple indicador MTF. Esta es la visualización real del indicador en su timeframe. Aquí están las opciones disponibles en el indicador de divergencias FFx: Seleccione los marcos de tiempo a mostrar (M1 a Mensual) Definir
Se trata de un indicador fácil de usar basado en el análisis de conglomerados de marcos multitemporales de divisas específicas. Proporciona señales sencillas pero potentes para operar y da medidas numéricas de la fuerza de la señal en valor porcentual. Después de colocar el indicador en un gráfico, muestra una tabla con la siguiente estructura: todos los símbolos con oportunidades disponibles actualmente para operar se enumeran en filas, y las estrategias de negociación se enumeran en columnas c
Se trata de un indicador de índices multidivisa con funcionalidad ampliada. Muestra cambios lineales en el valor relativo de tickers y divisas en base anual, mensual y semanal. Calcula los valores del mismo modo que CCFpExtra , pero no utiliza medias móviles. En su lugar, todas las cifras se comparan con un valor inicial en algún momento de la historia, por ejemplo, al principio de un año, un mes o una semana. Como resultado, uno puede ver los cambios exactos de los valores, y aplicar sobre ello
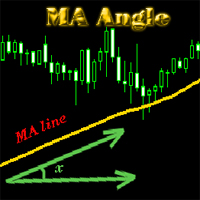
MA_Angle calcula el valor del ángulo entre la línea MA y la línea horizontal en cada barra del gráfico principal. Supongamos que hay una barra número n . La línea MA está especificada por un segmento de línea (vea las capturas de pantalla a continuación, que es la línea roja que conecta el valor del punto MA en la barra n y la barra número n+1 ). Este indicador muestra la fuerza de la tendencia del mercado (alcista o bajista). Puede personalizar cómo se muestra el ángulo mediante el parámetro "a

El propósito de esta nueva versión del indicador estándar de MT4 proporcionado en su plataforma es mostrar en una sub-ventana múltiples marcos temporales del mismo indicador con sus divergencias. Vea el ejemplo mostrado en la imagen inferior. Pero la visualización no es como un simple indicador MTF. Esta es la visualización real del indicador en su timeframe. Aquí están las opciones disponibles en el indicador de divergencias FFx: Seleccione los marcos de tiempo a mostrar (M1 a Mensual). Definir

El propósito de esta nueva versión del indicador estándar de MT4 proporcionado en su plataforma es mostrar en una sub-ventana múltiples marcos temporales del mismo indicador con sus divergencias. Vea el ejemplo mostrado en la imagen inferior. Pero la visualización no es como un simple indicador MTF. Esta es la visualización real del indicador en su timeframe. Aquí están las opciones disponibles en el indicador de divergencias FFx: Seleccione los marcos de tiempo a mostrar (M1 a Mensual). Definir

El sistema de alertas para la plataforma MetaTrader 4 'Two Moving Average Message' consiste en dos líneas de media móvil con parámetros individuales. El indicador puede generar alertas (AlertMessage )б mostrar un comentario en la esquina superior izquierda de la ventana principal del gráfico (CommentMessage ), enviar notificaciones a la versión móvil del terminal (MobileMessage ), enviar correos electrónicos (GmailMessage ) y reproducir dos sonidos diferentes en la intersección de las líneas hac
Si le gustan los patrones de velas, debe ser consciente de su mutabilidad. Desplaza el eje temporal una fracción de una sola barra y verás figuras completamente diferentes. Pero esta fracción puede ser sólo un desplazamiento GMT válido desde otra zona horaria, y estos nuevos patrones de velas deberían funcionar de la misma manera que lo hacen los de su zona horaria. Este indicador construye barras de velas con tiempos de apertura desplazados en el futuro. Tiene en cuenta su período principal, pe

Discrete Trend determina la tendencia dominante. El innovador algoritmo permite que el indicador se adapte automáticamente a cualquier marco temporal y par de divisas, eliminando por completo la necesidad de realizar ajustes manuales. El indicador trabaja sobre cierres de barras. Por lo tanto, es aconsejable considerar las señales en las velas ya formadas. El producto puede utilizarse como filtro y como indicador principal.

A. ¿Qué es A2SR ? * Es un indicador técnico líder (sin repintado, sin retraso).
-- Guía : -- en https://www.mql5.com/en/blogs/post/734748/page4#comment_16532516 -- y https://www.mql5.com/en/users/yohana/blog A2SR tiene una técnica especial para determinar los niveles de Soporte (demanda) y Resistencia (oferta). A diferencia de la forma ordinaria que vimos en la red, A2SR tiene un concepto original para determinar los niveles reales de SR. La técnica original no se tomó de Internet y tampoco
MetaTrader Market es el mejor lugar para vender los robots comerciales e indicadores técnicos.
Sólo necesita escribir un programa demandado para la plataforma MetaTrader, presentarlo de forma bonita y poner una buena descripción. Le ayudaremos publicar su producto en el Servicio Market donde millones de usuarios de MetaTrader podrán comprarlo. Así que, encárguese sólo de sus asuntos profesionales- escribir los programas para el trading automático.
Está perdiendo oportunidades comerciales:
- Aplicaciones de trading gratuitas
- 8 000+ señales para copiar
- Noticias económicas para analizar los mercados financieros
Registro
Entrada
Si no tiene cuenta de usuario, regístrese
Para iniciar sesión y usar el sitio web MQL5.com es necesario permitir el uso de Сookies.
Por favor, active este ajuste en su navegador, de lo contrario, no podrá iniciar sesión.